Marshallese vs Immigrants from Sudan Married-Couple Family Poverty
COMPARE
Marshallese
Immigrants from Sudan
Married-Couple Family Poverty
Married-Couple Family Poverty Comparison
Marshallese
Immigrants from Sudan
5.2%
MARRIED-COUPLE FAMILY POVERTY
47.9/ 100
METRIC RATING
175th/ 347
METRIC RANK
5.7%
MARRIED-COUPLE FAMILY POVERTY
3.5/ 100
METRIC RATING
235th/ 347
METRIC RANK
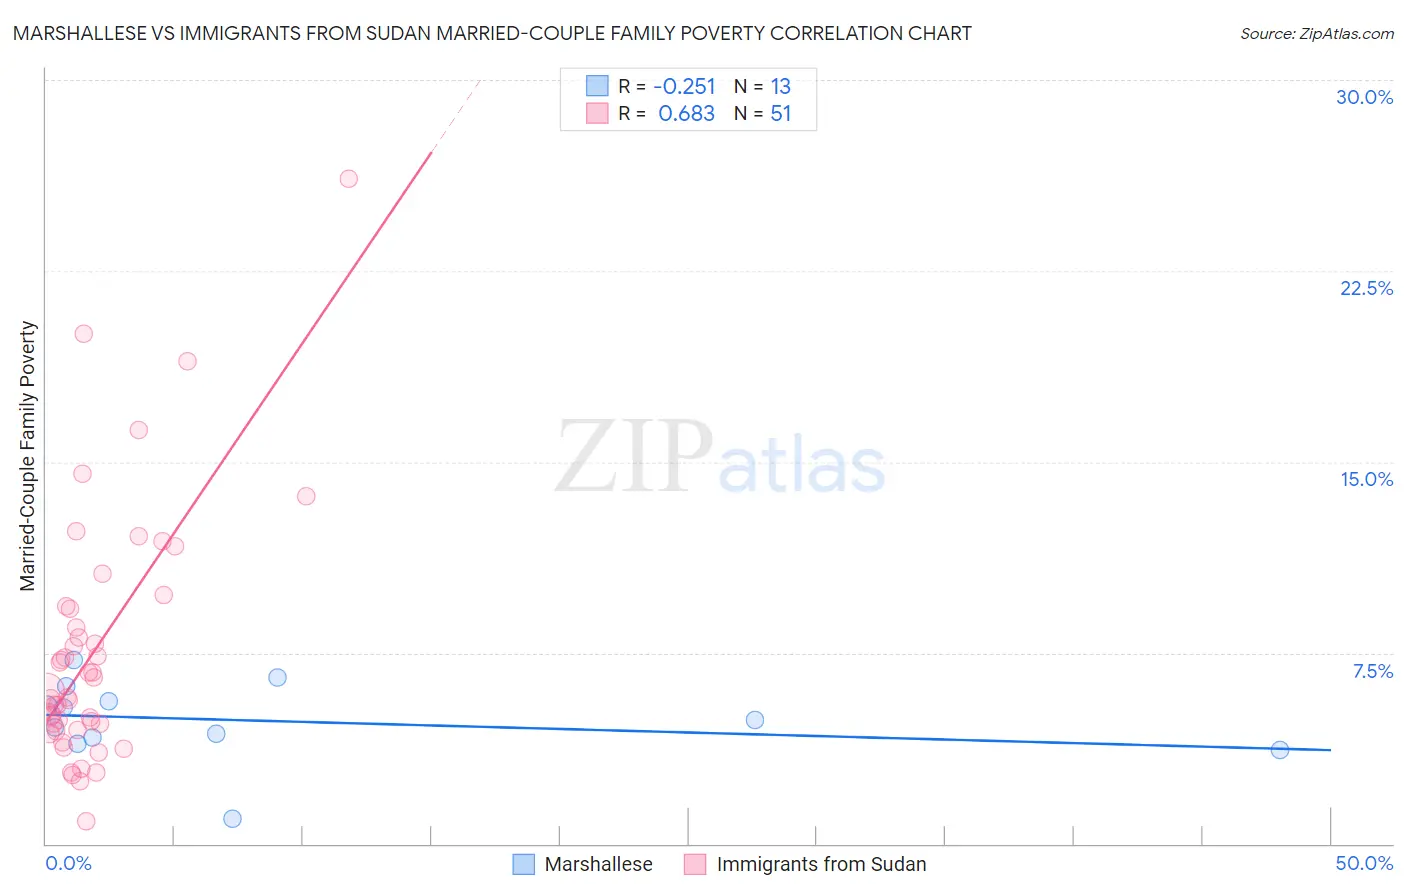
Marshallese vs Immigrants from Sudan Married-Couple Family Poverty Correlation Chart
The statistical analysis conducted on geographies consisting of 14,723,885 people shows a weak negative correlation between the proportion of Marshallese and poverty level among married-couple families in the United States with a correlation coefficient (R) of -0.251 and weighted average of 5.2%. Similarly, the statistical analysis conducted on geographies consisting of 118,776,869 people shows a significant positive correlation between the proportion of Immigrants from Sudan and poverty level among married-couple families in the United States with a correlation coefficient (R) of 0.683 and weighted average of 5.7%, a difference of 9.4%.
Married-Couple Family Poverty Correlation Summary
| Measurement | Marshallese | Immigrants from Sudan |
| Minimum | 1.00% | 0.91% |
| Maximum | 7.2% | 26.1% |
| Range | 6.2% | 25.2% |
| Mean | 4.8% | 7.6% |
| Median | 4.9% | 6.0% |
| Interquartile 25% (IQ1) | 4.1% | 4.5% |
| Interquartile 75% (IQ3) | 5.9% | 9.3% |
| Interquartile Range (IQR) | 1.8% | 4.9% |
| Standard Deviation (Sample) | 1.6% | 4.9% |
| Standard Deviation (Population) | 1.5% | 4.9% |
Similar Demographics by Married-Couple Family Poverty
Demographics Similar to Marshallese by Married-Couple Family Poverty
In terms of married-couple family poverty, the demographic groups most similar to Marshallese are Menominee (5.2%, a difference of 0.010%), Immigrants from Eastern Africa (5.2%, a difference of 0.24%), Immigrants from Kazakhstan (5.2%, a difference of 0.33%), Immigrants from Ukraine (5.2%, a difference of 0.35%), and Alsatian (5.2%, a difference of 0.38%).
| Demographics | Rating | Rank | Married-Couple Family Poverty |
| Immigrants | Uganda | 54.9 /100 | #168 | Average 5.2% |
| Ottawa | 54.5 /100 | #169 | Average 5.2% |
| Immigrants | Argentina | 54.4 /100 | #170 | Average 5.2% |
| Bermudans | 52.9 /100 | #171 | Average 5.2% |
| Immigrants | Northern Africa | 51.3 /100 | #172 | Average 5.2% |
| Alsatians | 51.2 /100 | #173 | Average 5.2% |
| Immigrants | Eastern Africa | 50.0 /100 | #174 | Average 5.2% |
| Marshallese | 47.9 /100 | #175 | Average 5.2% |
| Menominee | 47.8 /100 | #176 | Average 5.2% |
| Immigrants | Kazakhstan | 45.1 /100 | #177 | Average 5.2% |
| Immigrants | Ukraine | 44.9 /100 | #178 | Average 5.2% |
| Spanish | 41.4 /100 | #179 | Average 5.3% |
| Immigrants | Sierra Leone | 39.3 /100 | #180 | Fair 5.3% |
| Immigrants | Chile | 38.8 /100 | #181 | Fair 5.3% |
| Immigrants | Vietnam | 37.7 /100 | #182 | Fair 5.3% |
Demographics Similar to Immigrants from Sudan by Married-Couple Family Poverty
In terms of married-couple family poverty, the demographic groups most similar to Immigrants from Sudan are Ghanaian (5.7%, a difference of 0.16%), Immigrants from Colombia (5.7%, a difference of 0.19%), Immigrants from Uruguay (5.7%, a difference of 0.19%), Immigrants from South America (5.7%, a difference of 0.32%), and Immigrants from Laos (5.7%, a difference of 0.63%).
| Demographics | Rating | Rank | Married-Couple Family Poverty |
| Arabs | 5.4 /100 | #228 | Tragic 5.7% |
| Sub-Saharan Africans | 4.9 /100 | #229 | Tragic 5.7% |
| Moroccans | 4.9 /100 | #230 | Tragic 5.7% |
| Immigrants | Iraq | 4.4 /100 | #231 | Tragic 5.7% |
| Immigrants | Laos | 4.4 /100 | #232 | Tragic 5.7% |
| Immigrants | Colombia | 3.7 /100 | #233 | Tragic 5.7% |
| Immigrants | Uruguay | 3.7 /100 | #234 | Tragic 5.7% |
| Immigrants | Sudan | 3.5 /100 | #235 | Tragic 5.7% |
| Ghanaians | 3.3 /100 | #236 | Tragic 5.7% |
| Immigrants | South America | 3.1 /100 | #237 | Tragic 5.7% |
| Cherokee | 2.7 /100 | #238 | Tragic 5.8% |
| Venezuelans | 2.7 /100 | #239 | Tragic 5.8% |
| Fijians | 2.5 /100 | #240 | Tragic 5.8% |
| Immigrants | Panama | 2.5 /100 | #241 | Tragic 5.8% |
| Immigrants | Western Africa | 2.4 /100 | #242 | Tragic 5.8% |