Immigrants from Saudi Arabia vs Immigrants from Sudan Married-Couple Family Poverty

COMPARE

Immigrants from Saudi Arabia
Race
Ancestry
AfghanAfricanAlaska NativeAlaskan AthabascanAlbanianAleutAlsatianAmericanApacheArabArapahoArgentineanArmenianAssyrian/Chaldean/SyriacAustralianAustrianBahamianBangladeshiBarbadianBasqueBelgianBelizeanBermudanBhutaneseBlackfeetBolivianBrazilianBritishBritish West IndianBulgarianBurmeseCajunCambodianCanadianCape VerdeanCarpatho RusynCelticCentral AmericanCentral American IndianCherokeeCheyenneChickasawChileanChineseChippewaChoctawColombianColvilleComancheCosta RicanCreeCreekCroatianCrowCubanCypriotCzechCzechoslovakianDanishDelawareDominicanDutchDutch West IndianEastern EuropeanEcuadorianEgyptianEnglishEstonianEthiopianEuropeanFijianFilipinoFinnishFrenchFrench American IndianFrench CanadianGermanGerman RussianGhanaianGreekGuamanian/ChamorroGuatemalanGuyaneseHaitianHmongHonduranHopiHoumaHungarianIcelanderIndian (Asian)IndonesianInupiatIranianIraqiIrishIroquoisIsraeliItalianJamaicanJapaneseJordanianKenyanKiowaKoreanLaotianLatvianLebaneseLiberianLithuanianLumbeeLuxembourgerMacedonianMalaysianMalteseMarshalleseMenomineeMexicanMexican American IndianMongolianMoroccanNative HawaiianNavajoNepaleseNew ZealanderNicaraguanNigerianNorthern EuropeanNorwegianOkinawanOsageOttawaPaiutePakistaniPalestinianPanamanianParaguayanPennsylvania GermanPeruvianPimaPolishPortuguesePotawatomiPuebloPuerto RicanPuget Sound SalishRomanianRussianSalvadoranSamoanScandinavianScotch-IrishScottishSeminoleSenegaleseSerbianShoshoneSierra LeoneanSiouxSlavicSlovakSloveneSomaliSouth AfricanSouth AmericanSouth American IndianSoviet UnionSpaniardSpanishSpanish AmericanSpanish American IndianSri LankanSubsaharan AfricanSudaneseSwedishSwissSyrianTaiwaneseThaiTlingit-HaidaTohono O'OdhamTonganTrinidadian and TobagonianTsimshianTurkishU.S. Virgin IslanderUgandanUkrainianUruguayanUteVenezuelanVietnameseWelshWest IndianYakamaYaquiYugoslavianYumanYup'ikZimbabwean
Immigration
NonimmigrantsImmigrantsAfghanistanAfricaAlbaniaArgentinaArmeniaAsiaAustraliaAustriaBahamasBangladeshBarbadosBelarusBelgiumBelizeBoliviaBosnia and HerzegovinaBrazilBulgariaBurma/MyanmarCabo VerdeCambodiaCameroonCanadaCaribbeanCentral AmericaChileChinaColombiaCongoCosta RicaCroatiaCubaCzechoslovakiaDenmarkDominicaDominican RepublicEastern AfricaEastern AsiaEastern EuropeEcuadorEgyptEl SalvadorEnglandEritreaEthiopiaEuropeFijiFranceGermanyGhanaGreeceGrenadaGuatemalaGuyanaHaitiHondurasHong KongHungaryIndiaIndonesiaIranIraqIrelandIsraelItalyJamaicaJapanJordanKazakhstanKenyaKoreaKuwaitLaosLatin AmericaLatviaLebanonLiberiaLithuaniaMalaysiaMexicoMicronesiaMiddle AfricaMoldovaMoroccoNepalNetherlandsNicaraguaNigeriaNorth AmericaNorth MacedoniaNorthern AfricaNorthern EuropeNorwayOceaniaPakistanPanamaPeruPhilippinesPolandPortugalRomaniaRussiaSaudi ArabiaScotlandSenegalSerbiaSierra LeoneSingaporeSomaliaSouth AfricaSouth AmericaSouth Central AsiaSouth Eastern AsiaSouthern EuropeSpainSri LankaSt. Vincent and the GrenadinesSwedenSwitzerlandSyriaTaiwanThailandTrinidad and TobagoTurkeyUgandaUkraineUruguayUzbekistanVenezuelaVietnamWest IndiesWestern AfricaWestern AsiaWestern EuropeYemenZaireZimbabweAzores
Immigrants from Sudan
Race
Ancestry
AfghanAfricanAlaska NativeAlaskan AthabascanAlbanianAleutAlsatianAmericanApacheArabArapahoArgentineanArmenianAssyrian/Chaldean/SyriacAustralianAustrianBahamianBangladeshiBarbadianBasqueBelgianBelizeanBermudanBhutaneseBlackfeetBolivianBrazilianBritishBritish West IndianBulgarianBurmeseCajunCambodianCanadianCape VerdeanCarpatho RusynCelticCentral AmericanCentral American IndianCherokeeCheyenneChickasawChileanChineseChippewaChoctawColombianColvilleComancheCosta RicanCreeCreekCroatianCrowCubanCypriotCzechCzechoslovakianDanishDelawareDominicanDutchDutch West IndianEastern EuropeanEcuadorianEgyptianEnglishEstonianEthiopianEuropeanFijianFilipinoFinnishFrenchFrench American IndianFrench CanadianGermanGerman RussianGhanaianGreekGuamanian/ChamorroGuatemalanGuyaneseHaitianHmongHonduranHopiHoumaHungarianIcelanderIndian (Asian)IndonesianInupiatIranianIraqiIrishIroquoisIsraeliItalianJamaicanJapaneseJordanianKenyanKiowaKoreanLaotianLatvianLebaneseLiberianLithuanianLumbeeLuxembourgerMacedonianMalaysianMalteseMarshalleseMenomineeMexicanMexican American IndianMongolianMoroccanNative HawaiianNavajoNepaleseNew ZealanderNicaraguanNigerianNorthern EuropeanNorwegianOkinawanOsageOttawaPaiutePakistaniPalestinianPanamanianParaguayanPennsylvania GermanPeruvianPimaPolishPortuguesePotawatomiPuebloPuerto RicanPuget Sound SalishRomanianRussianSalvadoranSamoanScandinavianScotch-IrishScottishSeminoleSenegaleseSerbianShoshoneSierra LeoneanSiouxSlavicSlovakSloveneSomaliSouth AfricanSouth AmericanSouth American IndianSoviet UnionSpaniardSpanishSpanish AmericanSpanish American IndianSri LankanSubsaharan AfricanSudaneseSwedishSwissSyrianTaiwaneseThaiTlingit-HaidaTohono O'OdhamTonganTrinidadian and TobagonianTsimshianTurkishU.S. Virgin IslanderUgandanUkrainianUruguayanUteVenezuelanVietnameseWelshWest IndianYakamaYaquiYugoslavianYumanYup'ikZimbabwean
Immigration
NonimmigrantsImmigrantsAfghanistanAfricaAlbaniaArgentinaArmeniaAsiaAustraliaAustriaBahamasBangladeshBarbadosBelarusBelgiumBelizeBoliviaBosnia and HerzegovinaBrazilBulgariaBurma/MyanmarCabo VerdeCambodiaCameroonCanadaCaribbeanCentral AmericaChileChinaColombiaCongoCosta RicaCroatiaCubaCzechoslovakiaDenmarkDominicaDominican RepublicEastern AfricaEastern AsiaEastern EuropeEcuadorEgyptEl SalvadorEnglandEritreaEthiopiaEuropeFijiFranceGermanyGhanaGreeceGrenadaGuatemalaGuyanaHaitiHondurasHong KongHungaryIndiaIndonesiaIranIraqIrelandIsraelItalyJamaicaJapanJordanKazakhstanKenyaKoreaKuwaitLaosLatin AmericaLatviaLebanonLiberiaLithuaniaMalaysiaMexicoMicronesiaMiddle AfricaMoldovaMoroccoNepalNetherlandsNicaraguaNigeriaNorth AmericaNorth MacedoniaNorthern AfricaNorthern EuropeNorwayOceaniaPakistanPanamaPeruPhilippinesPolandPortugalRomaniaRussiaScotlandSenegalSerbiaSierra LeoneSingaporeSomaliaSouth AfricaSouth AmericaSouth Central AsiaSouth Eastern AsiaSouthern EuropeSpainSri LankaSt. Vincent and the GrenadinesSudanSwedenSwitzerlandSyriaTaiwanThailandTrinidad and TobagoTurkeyUgandaUkraineUruguayUzbekistanVenezuelaVietnamWest IndiesWestern AfricaWestern AsiaWestern EuropeYemenZaireZimbabweAzores
Married-Couple Family Poverty
Income
Poverty
Unemployment
Labor Participation
Family Structure
Vehicle Availability
Education Level
Disability

Married-Couple Family Poverty Comparison

Immigrants from Saudi Arabia

Immigrants from Sudan

Good
Tragic
5.1%
MARRIED-COUPLE FAMILY POVERTY
70.3/ 100
METRIC RATING
159th/ 347
METRIC RANK
5.7%
MARRIED-COUPLE FAMILY POVERTY
3.5/ 100
METRIC RATING
235th/ 347
METRIC RANK

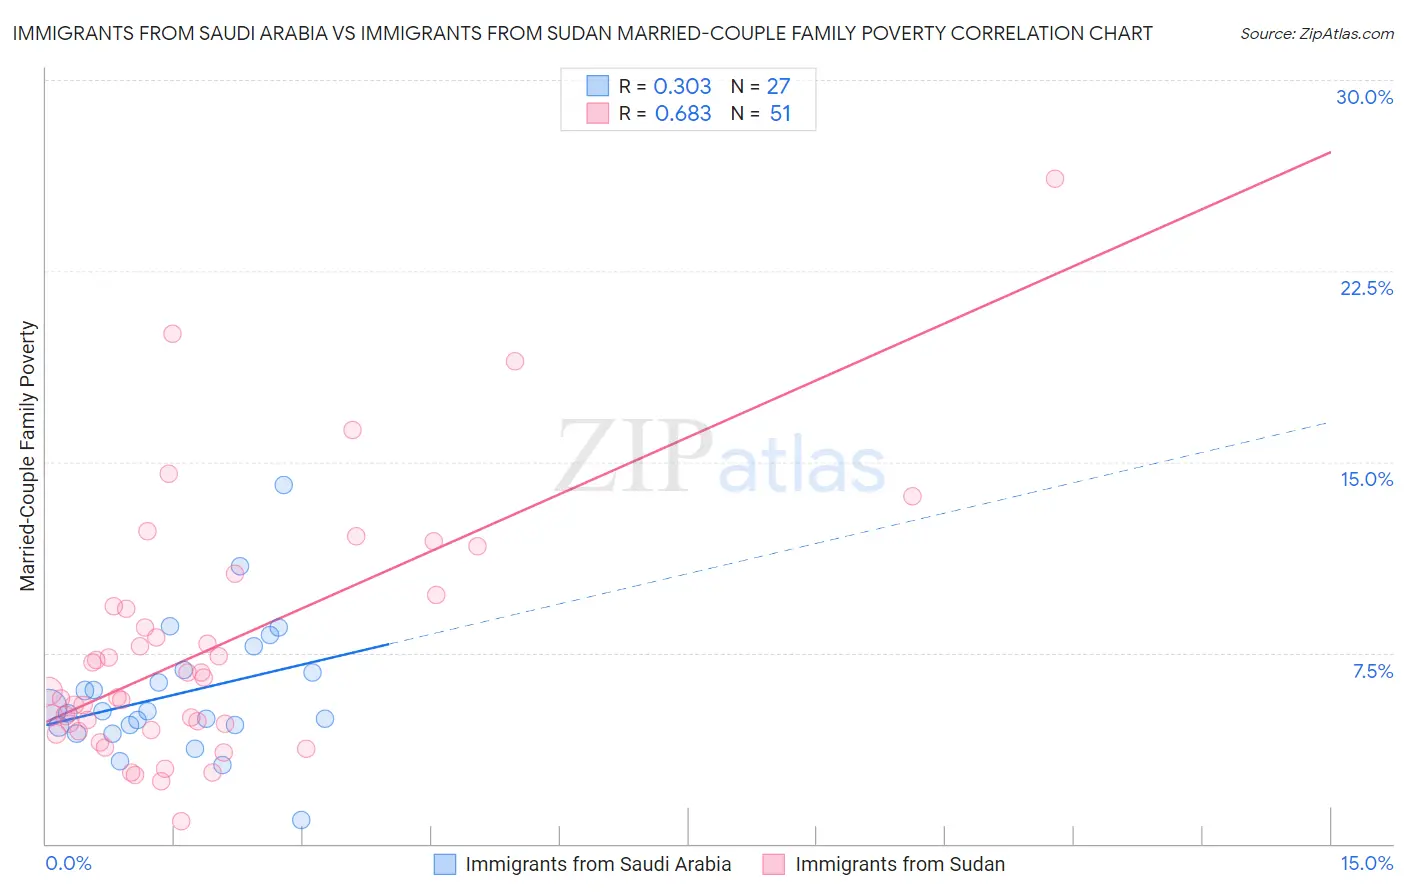
Immigrants from Saudi Arabia vs Immigrants from Sudan Married-Couple Family Poverty Correlation Chart

The statistical analysis conducted on geographies consisting of 163,790,795 people shows a mild positive correlation between the proportion of Immigrants from Saudi Arabia and poverty level among married-couple families in the United States with a correlation coefficient (R) of 0.303 and weighted average of 5.1%. Similarly, the statistical analysis conducted on geographies consisting of 118,776,869 people shows a significant positive correlation between the proportion of Immigrants from Sudan and poverty level among married-couple families in the United States with a correlation coefficient (R) of 0.683 and weighted average of 5.7%, a difference of 12.5%.
Immigrants from Saudi Arabia vs Immigrants from Sudan Married-Couple Family Poverty

Married-Couple Family Poverty Correlation Summary

MeasurementImmigrants from Saudi ArabiaImmigrants from Sudan
Minimum0.95%0.91%
Maximum14.1%26.1%
Range13.2%25.2%
Mean5.9%7.6%
Median5.2%6.0%
Interquartile 25% (IQ1)4.6%4.5%
Interquartile 75% (IQ3)6.8%9.3%
Interquartile Range (IQR)2.2%4.9%
Standard Deviation (Sample)2.6%4.9%
Standard Deviation (Population)2.6%4.9%

Similar Demographics by Married-Couple Family Poverty

Demographics Similar to Immigrants from Saudi Arabia by Married-Couple Family Poverty

In terms of married-couple family poverty, the demographic groups most similar to Immigrants from Saudi Arabia are Immigrants from South Eastern Asia (5.1%, a difference of 0.0%), Argentinean (5.1%, a difference of 0.050%), Pennsylvania German (5.1%, a difference of 0.26%), Sri Lankan (5.1%, a difference of 0.27%), and Immigrants from Ethiopia (5.1%, a difference of 0.31%).
DemographicsRating | RankMarried-Couple Family Poverty
Albanians
77.2
/100
|
#152
Good
5.0%
Immigrants | Kuwait
76.3
/100
|
#153
Good
5.0%
Delaware
73.7
/100
|
#154
Good
5.1%
Immigrants | Ethiopia
72.4
/100
|
#155
Good
5.1%
Sri Lankans
72.2
/100
|
#156
Good
5.1%
Argentineans
70.7
/100
|
#157
Good
5.1%
Immigrants | South Eastern Asia
70.4
/100
|
#158
Good
5.1%
Immigrants | Saudi Arabia
70.3
/100
|
#159
Good
5.1%
Pennsylvania Germans
68.5
/100
|
#160
Good
5.1%
Ethiopians
68.1
/100
|
#161
Good
5.1%
Immigrants | Jordan
66.5
/100
|
#162
Good
5.1%
Sierra Leoneans
64.1
/100
|
#163
Good
5.1%
Hawaiians
62.3
/100
|
#164
Good
5.1%
Immigrants | Malaysia
62.2
/100
|
#165
Good
5.1%
Paraguayans
61.5
/100
|
#166
Good
5.1%

Demographics Similar to Immigrants from Sudan by Married-Couple Family Poverty

In terms of married-couple family poverty, the demographic groups most similar to Immigrants from Sudan are Ghanaian (5.7%, a difference of 0.16%), Immigrants from Colombia (5.7%, a difference of 0.19%), Immigrants from Uruguay (5.7%, a difference of 0.19%), Immigrants from South America (5.7%, a difference of 0.32%), and Immigrants from Laos (5.7%, a difference of 0.63%).
DemographicsRating | RankMarried-Couple Family Poverty
Arabs
5.4
/100
|
#228
Tragic
5.7%
Sub-Saharan Africans
4.9
/100
|
#229
Tragic
5.7%
Moroccans
4.9
/100
|
#230
Tragic
5.7%
Immigrants | Iraq
4.4
/100
|
#231
Tragic
5.7%
Immigrants | Laos
4.4
/100
|
#232
Tragic
5.7%
Immigrants | Colombia
3.7
/100
|
#233
Tragic
5.7%
Immigrants | Uruguay
3.7
/100
|
#234
Tragic
5.7%
Immigrants | Sudan
3.5
/100
|
#235
Tragic
5.7%
Ghanaians
3.3
/100
|
#236
Tragic
5.7%
Immigrants | South America
3.1
/100
|
#237
Tragic
5.7%
Cherokee
2.7
/100
|
#238
Tragic
5.8%
Venezuelans
2.7
/100
|
#239
Tragic
5.8%
Fijians
2.5
/100
|
#240
Tragic
5.8%
Immigrants | Panama
2.5
/100
|
#241
Tragic
5.8%
Immigrants | Western Africa
2.4
/100
|
#242
Tragic
5.8%