Hmong vs Immigrants from Sudan Married-Couple Family Poverty
COMPARE
Hmong
Immigrants from Sudan
Married-Couple Family Poverty
Married-Couple Family Poverty Comparison
Hmong
Immigrants from Sudan
5.0%
MARRIED-COUPLE FAMILY POVERTY
83.2/ 100
METRIC RATING
144th/ 347
METRIC RANK
5.7%
MARRIED-COUPLE FAMILY POVERTY
3.5/ 100
METRIC RATING
235th/ 347
METRIC RANK
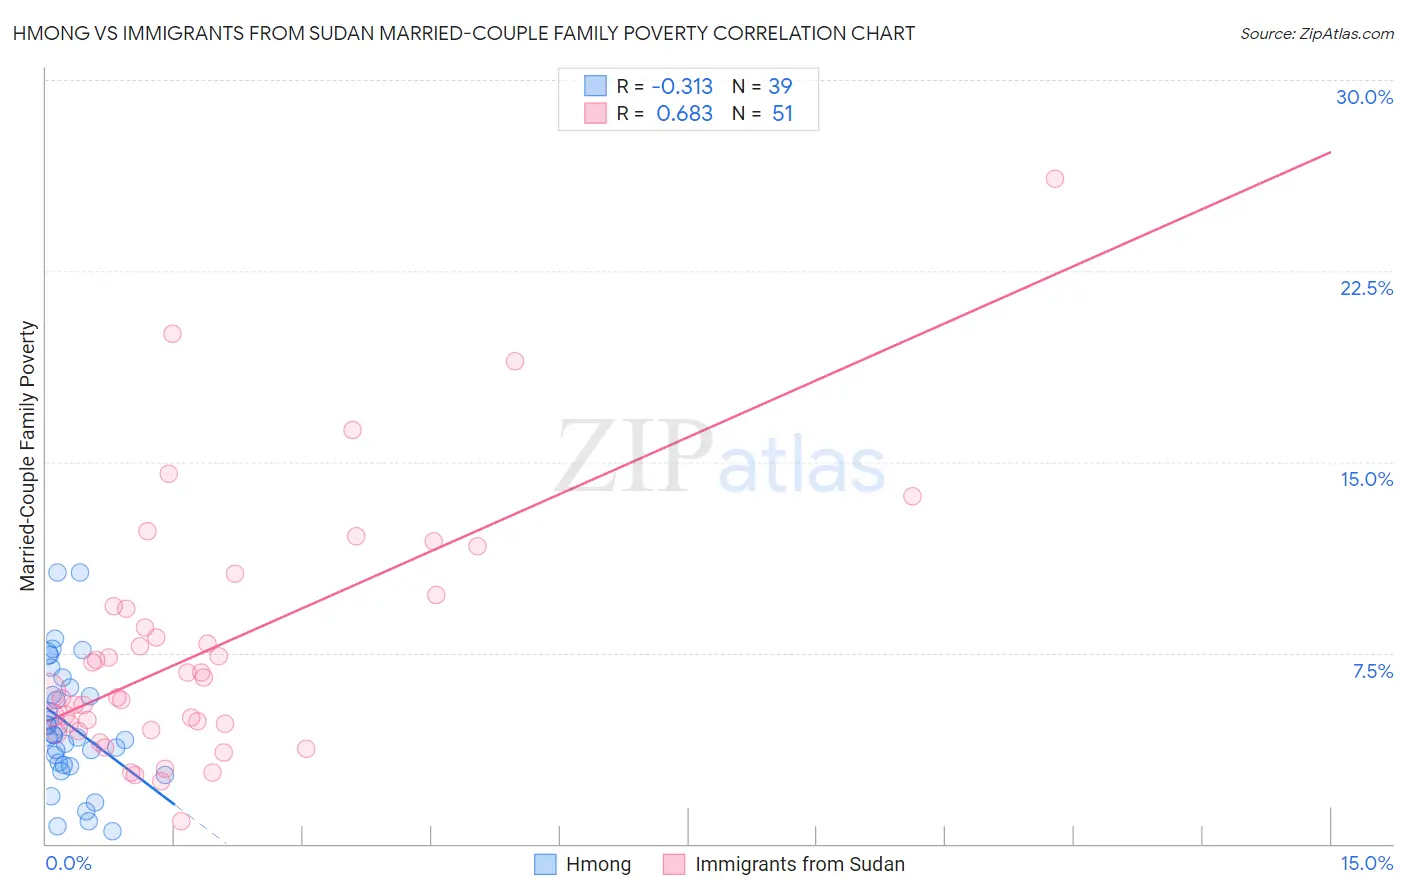
Hmong vs Immigrants from Sudan Married-Couple Family Poverty Correlation Chart
The statistical analysis conducted on geographies consisting of 24,678,157 people shows a mild negative correlation between the proportion of Hmong and poverty level among married-couple families in the United States with a correlation coefficient (R) of -0.313 and weighted average of 5.0%. Similarly, the statistical analysis conducted on geographies consisting of 118,776,869 people shows a significant positive correlation between the proportion of Immigrants from Sudan and poverty level among married-couple families in the United States with a correlation coefficient (R) of 0.683 and weighted average of 5.7%, a difference of 15.0%.
Married-Couple Family Poverty Correlation Summary
| Measurement | Hmong | Immigrants from Sudan |
| Minimum | 0.50% | 0.91% |
| Maximum | 10.7% | 26.1% |
| Range | 10.2% | 25.2% |
| Mean | 4.7% | 7.6% |
| Median | 4.3% | 6.0% |
| Interquartile 25% (IQ1) | 3.1% | 4.5% |
| Interquartile 75% (IQ3) | 6.1% | 9.3% |
| Interquartile Range (IQR) | 3.0% | 4.9% |
| Standard Deviation (Sample) | 2.4% | 4.9% |
| Standard Deviation (Population) | 2.4% | 4.9% |
Similar Demographics by Married-Couple Family Poverty
Demographics Similar to Hmong by Married-Couple Family Poverty
In terms of married-couple family poverty, the demographic groups most similar to Hmong are Immigrants from Egypt (5.0%, a difference of 0.050%), Immigrants from Brazil (5.0%, a difference of 0.32%), Immigrants from China (5.0%, a difference of 0.32%), Immigrants from Portugal (5.0%, a difference of 0.37%), and German Russian (5.0%, a difference of 0.43%).
| Demographics | Rating | Rank | Married-Couple Family Poverty |
| Guamanians/Chamorros | 86.5 /100 | #137 | Excellent 4.9% |
| Chileans | 86.0 /100 | #138 | Excellent 4.9% |
| German Russians | 85.1 /100 | #139 | Excellent 5.0% |
| Immigrants | Portugal | 84.8 /100 | #140 | Excellent 5.0% |
| Immigrants | Brazil | 84.6 /100 | #141 | Excellent 5.0% |
| Immigrants | China | 84.6 /100 | #142 | Excellent 5.0% |
| Immigrants | Egypt | 83.4 /100 | #143 | Excellent 5.0% |
| Hmong | 83.2 /100 | #144 | Excellent 5.0% |
| Immigrants | Spain | 79.9 /100 | #145 | Good 5.0% |
| Mongolians | 79.8 /100 | #146 | Good 5.0% |
| Syrians | 78.7 /100 | #147 | Good 5.0% |
| Immigrants | Russia | 78.7 /100 | #148 | Good 5.0% |
| Immigrants | Oceania | 78.6 /100 | #149 | Good 5.0% |
| Brazilians | 78.3 /100 | #150 | Good 5.0% |
| Immigrants | Cameroon | 77.3 /100 | #151 | Good 5.0% |
Demographics Similar to Immigrants from Sudan by Married-Couple Family Poverty
In terms of married-couple family poverty, the demographic groups most similar to Immigrants from Sudan are Ghanaian (5.7%, a difference of 0.16%), Immigrants from Colombia (5.7%, a difference of 0.19%), Immigrants from Uruguay (5.7%, a difference of 0.19%), Immigrants from South America (5.7%, a difference of 0.32%), and Immigrants from Laos (5.7%, a difference of 0.63%).
| Demographics | Rating | Rank | Married-Couple Family Poverty |
| Arabs | 5.4 /100 | #228 | Tragic 5.7% |
| Sub-Saharan Africans | 4.9 /100 | #229 | Tragic 5.7% |
| Moroccans | 4.9 /100 | #230 | Tragic 5.7% |
| Immigrants | Iraq | 4.4 /100 | #231 | Tragic 5.7% |
| Immigrants | Laos | 4.4 /100 | #232 | Tragic 5.7% |
| Immigrants | Colombia | 3.7 /100 | #233 | Tragic 5.7% |
| Immigrants | Uruguay | 3.7 /100 | #234 | Tragic 5.7% |
| Immigrants | Sudan | 3.5 /100 | #235 | Tragic 5.7% |
| Ghanaians | 3.3 /100 | #236 | Tragic 5.7% |
| Immigrants | South America | 3.1 /100 | #237 | Tragic 5.7% |
| Cherokee | 2.7 /100 | #238 | Tragic 5.8% |
| Venezuelans | 2.7 /100 | #239 | Tragic 5.8% |
| Fijians | 2.5 /100 | #240 | Tragic 5.8% |
| Immigrants | Panama | 2.5 /100 | #241 | Tragic 5.8% |
| Immigrants | Western Africa | 2.4 /100 | #242 | Tragic 5.8% |