Cheyenne vs Immigrants from Sudan Married-Couple Family Poverty
COMPARE
Cheyenne
Immigrants from Sudan
Married-Couple Family Poverty
Married-Couple Family Poverty Comparison
Cheyenne
Immigrants from Sudan
9.4%
MARRIED-COUPLE FAMILY POVERTY
0.0/ 100
METRIC RATING
338th/ 347
METRIC RANK
5.7%
MARRIED-COUPLE FAMILY POVERTY
3.5/ 100
METRIC RATING
235th/ 347
METRIC RANK
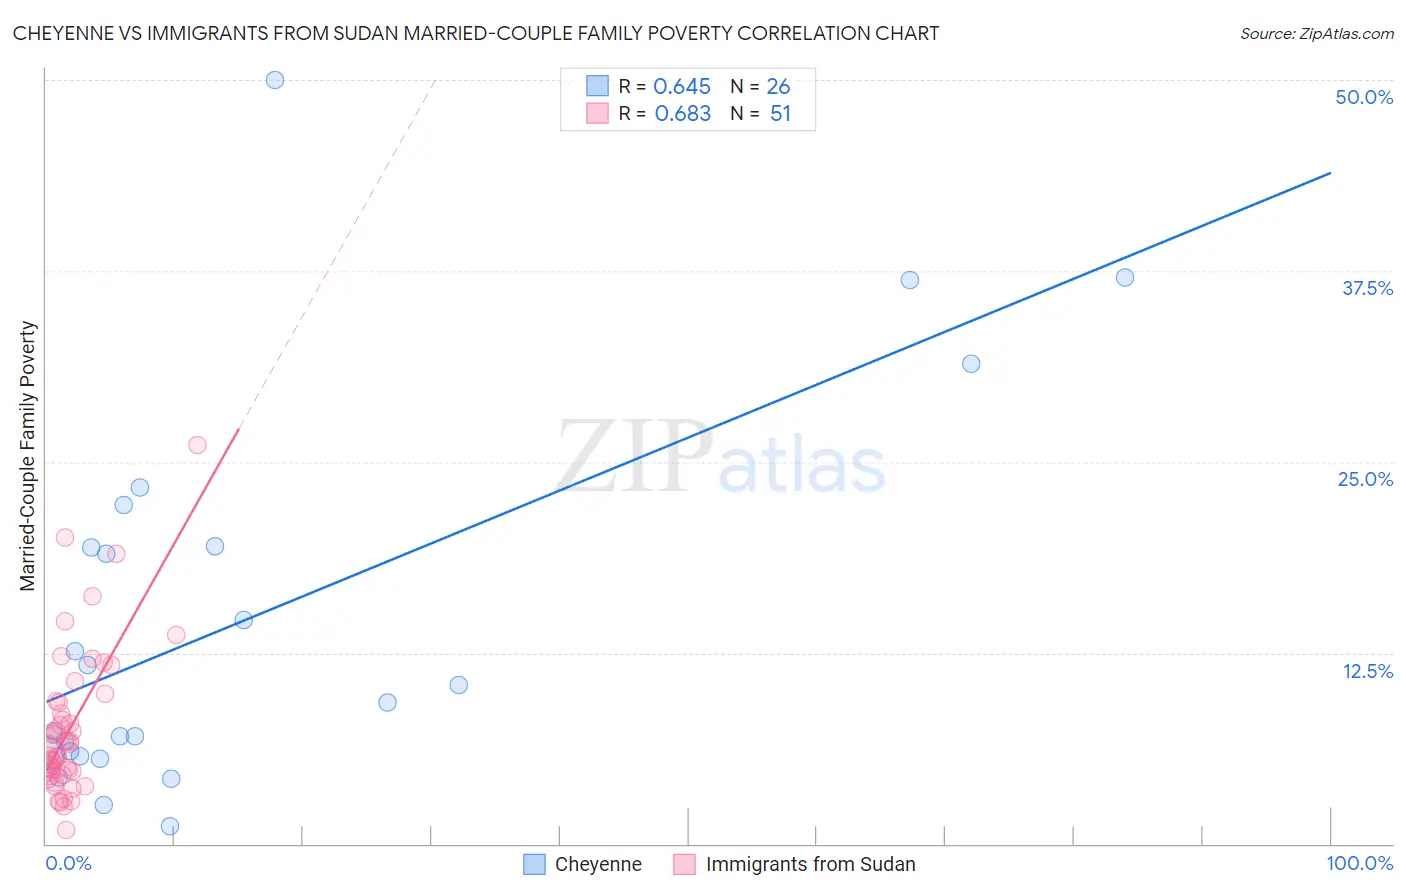
Cheyenne vs Immigrants from Sudan Married-Couple Family Poverty Correlation Chart
The statistical analysis conducted on geographies consisting of 80,557,927 people shows a significant positive correlation between the proportion of Cheyenne and poverty level among married-couple families in the United States with a correlation coefficient (R) of 0.645 and weighted average of 9.4%. Similarly, the statistical analysis conducted on geographies consisting of 118,776,869 people shows a significant positive correlation between the proportion of Immigrants from Sudan and poverty level among married-couple families in the United States with a correlation coefficient (R) of 0.683 and weighted average of 5.7%, a difference of 64.9%.
Married-Couple Family Poverty Correlation Summary
| Measurement | Cheyenne | Immigrants from Sudan |
| Minimum | 1.1% | 0.91% |
| Maximum | 50.0% | 26.1% |
| Range | 48.9% | 25.2% |
| Mean | 14.7% | 7.6% |
| Median | 9.8% | 6.0% |
| Interquartile 25% (IQ1) | 5.8% | 4.5% |
| Interquartile 75% (IQ3) | 19.4% | 9.3% |
| Interquartile Range (IQR) | 13.7% | 4.9% |
| Standard Deviation (Sample) | 12.5% | 4.9% |
| Standard Deviation (Population) | 12.2% | 4.9% |
Similar Demographics by Married-Couple Family Poverty
Demographics Similar to Cheyenne by Married-Couple Family Poverty
In terms of married-couple family poverty, the demographic groups most similar to Cheyenne are Crow (9.6%, a difference of 1.3%), Yuman (9.7%, a difference of 3.2%), Yakama (9.0%, a difference of 5.3%), Apache (9.0%, a difference of 5.4%), and Sioux (8.7%, a difference of 8.5%).
| Demographics | Rating | Rank | Married-Couple Family Poverty |
| Central American Indians | 0.0 /100 | #331 | Tragic 8.3% |
| Dominicans | 0.0 /100 | #332 | Tragic 8.3% |
| Lumbee | 0.0 /100 | #333 | Tragic 8.3% |
| Immigrants | Dominican Republic | 0.0 /100 | #334 | Tragic 8.4% |
| Sioux | 0.0 /100 | #335 | Tragic 8.7% |
| Apache | 0.0 /100 | #336 | Tragic 9.0% |
| Yakama | 0.0 /100 | #337 | Tragic 9.0% |
| Cheyenne | 0.0 /100 | #338 | Tragic 9.4% |
| Crow | 0.0 /100 | #339 | Tragic 9.6% |
| Yuman | 0.0 /100 | #340 | Tragic 9.7% |
| Pueblo | 0.0 /100 | #341 | Tragic 11.1% |
| Tohono O'odham | 0.0 /100 | #342 | Tragic 11.2% |
| Pima | 0.0 /100 | #343 | Tragic 11.4% |
| Navajo | 0.0 /100 | #344 | Tragic 11.9% |
| Puerto Ricans | 0.0 /100 | #345 | Tragic 12.6% |
Demographics Similar to Immigrants from Sudan by Married-Couple Family Poverty
In terms of married-couple family poverty, the demographic groups most similar to Immigrants from Sudan are Ghanaian (5.7%, a difference of 0.16%), Immigrants from Colombia (5.7%, a difference of 0.19%), Immigrants from Uruguay (5.7%, a difference of 0.19%), Immigrants from South America (5.7%, a difference of 0.32%), and Immigrants from Laos (5.7%, a difference of 0.63%).
| Demographics | Rating | Rank | Married-Couple Family Poverty |
| Arabs | 5.4 /100 | #228 | Tragic 5.7% |
| Sub-Saharan Africans | 4.9 /100 | #229 | Tragic 5.7% |
| Moroccans | 4.9 /100 | #230 | Tragic 5.7% |
| Immigrants | Iraq | 4.4 /100 | #231 | Tragic 5.7% |
| Immigrants | Laos | 4.4 /100 | #232 | Tragic 5.7% |
| Immigrants | Colombia | 3.7 /100 | #233 | Tragic 5.7% |
| Immigrants | Uruguay | 3.7 /100 | #234 | Tragic 5.7% |
| Immigrants | Sudan | 3.5 /100 | #235 | Tragic 5.7% |
| Ghanaians | 3.3 /100 | #236 | Tragic 5.7% |
| Immigrants | South America | 3.1 /100 | #237 | Tragic 5.7% |
| Cherokee | 2.7 /100 | #238 | Tragic 5.8% |
| Venezuelans | 2.7 /100 | #239 | Tragic 5.8% |
| Fijians | 2.5 /100 | #240 | Tragic 5.8% |
| Immigrants | Panama | 2.5 /100 | #241 | Tragic 5.8% |
| Immigrants | Western Africa | 2.4 /100 | #242 | Tragic 5.8% |