Immigrants from Burma/Myanmar vs Immigrants from Sudan Married-Couple Family Poverty
COMPARE
Immigrants from Burma/Myanmar
Immigrants from Sudan
Married-Couple Family Poverty
Married-Couple Family Poverty Comparison
Immigrants from Burma/Myanmar
Immigrants from Sudan
6.0%
MARRIED-COUPLE FAMILY POVERTY
0.5/ 100
METRIC RATING
257th/ 347
METRIC RANK
5.7%
MARRIED-COUPLE FAMILY POVERTY
3.5/ 100
METRIC RATING
235th/ 347
METRIC RANK
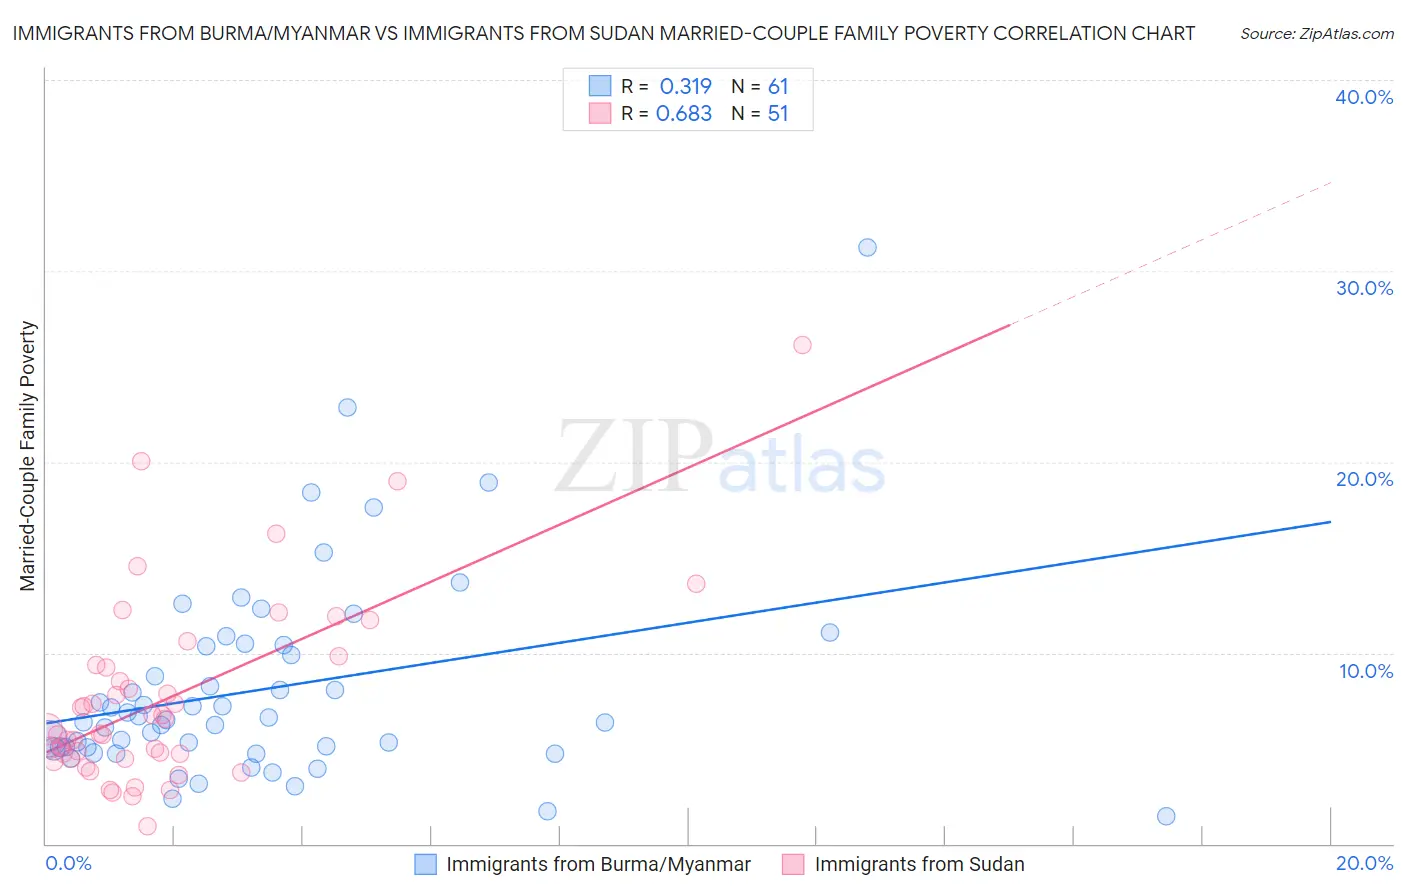
Immigrants from Burma/Myanmar vs Immigrants from Sudan Married-Couple Family Poverty Correlation Chart
The statistical analysis conducted on geographies consisting of 171,978,611 people shows a mild positive correlation between the proportion of Immigrants from Burma/Myanmar and poverty level among married-couple families in the United States with a correlation coefficient (R) of 0.319 and weighted average of 6.0%. Similarly, the statistical analysis conducted on geographies consisting of 118,776,869 people shows a significant positive correlation between the proportion of Immigrants from Sudan and poverty level among married-couple families in the United States with a correlation coefficient (R) of 0.683 and weighted average of 5.7%, a difference of 5.2%.
Married-Couple Family Poverty Correlation Summary
| Measurement | Immigrants from Burma/Myanmar | Immigrants from Sudan |
| Minimum | 1.4% | 0.91% |
| Maximum | 31.2% | 26.1% |
| Range | 29.8% | 25.2% |
| Mean | 8.1% | 7.6% |
| Median | 6.5% | 6.0% |
| Interquartile 25% (IQ1) | 5.0% | 4.5% |
| Interquartile 75% (IQ3) | 10.4% | 9.3% |
| Interquartile Range (IQR) | 5.4% | 4.9% |
| Standard Deviation (Sample) | 5.3% | 4.9% |
| Standard Deviation (Population) | 5.3% | 4.9% |
Similar Demographics by Married-Couple Family Poverty
Demographics Similar to Immigrants from Burma/Myanmar by Married-Couple Family Poverty
In terms of married-couple family poverty, the demographic groups most similar to Immigrants from Burma/Myanmar are Immigrants (6.0%, a difference of 0.13%), Bangladeshi (6.0%, a difference of 0.24%), Alaskan Athabascan (6.1%, a difference of 0.71%), Comanche (6.0%, a difference of 0.74%), and Immigrants from Somalia (6.0%, a difference of 0.89%).
| Demographics | Rating | Rank | Married-Couple Family Poverty |
| Immigrants | Eritrea | 1.1 /100 | #250 | Tragic 5.9% |
| Immigrants | Ghana | 1.0 /100 | #251 | Tragic 5.9% |
| Immigrants | Western Asia | 0.7 /100 | #252 | Tragic 6.0% |
| Africans | 0.7 /100 | #253 | Tragic 6.0% |
| Immigrants | Somalia | 0.7 /100 | #254 | Tragic 6.0% |
| Comanche | 0.7 /100 | #255 | Tragic 6.0% |
| Bangladeshis | 0.5 /100 | #256 | Tragic 6.0% |
| Immigrants | Burma/Myanmar | 0.5 /100 | #257 | Tragic 6.0% |
| Immigrants | Immigrants | 0.5 /100 | #258 | Tragic 6.0% |
| Alaskan Athabascans | 0.4 /100 | #259 | Tragic 6.1% |
| Jamaicans | 0.3 /100 | #260 | Tragic 6.1% |
| Senegalese | 0.3 /100 | #261 | Tragic 6.1% |
| Shoshone | 0.3 /100 | #262 | Tragic 6.1% |
| Immigrants | Senegal | 0.3 /100 | #263 | Tragic 6.1% |
| Immigrants | Congo | 0.2 /100 | #264 | Tragic 6.1% |
Demographics Similar to Immigrants from Sudan by Married-Couple Family Poverty
In terms of married-couple family poverty, the demographic groups most similar to Immigrants from Sudan are Ghanaian (5.7%, a difference of 0.16%), Immigrants from Colombia (5.7%, a difference of 0.19%), Immigrants from Uruguay (5.7%, a difference of 0.19%), Immigrants from South America (5.7%, a difference of 0.32%), and Immigrants from Laos (5.7%, a difference of 0.63%).
| Demographics | Rating | Rank | Married-Couple Family Poverty |
| Arabs | 5.4 /100 | #228 | Tragic 5.7% |
| Sub-Saharan Africans | 4.9 /100 | #229 | Tragic 5.7% |
| Moroccans | 4.9 /100 | #230 | Tragic 5.7% |
| Immigrants | Iraq | 4.4 /100 | #231 | Tragic 5.7% |
| Immigrants | Laos | 4.4 /100 | #232 | Tragic 5.7% |
| Immigrants | Colombia | 3.7 /100 | #233 | Tragic 5.7% |
| Immigrants | Uruguay | 3.7 /100 | #234 | Tragic 5.7% |
| Immigrants | Sudan | 3.5 /100 | #235 | Tragic 5.7% |
| Ghanaians | 3.3 /100 | #236 | Tragic 5.7% |
| Immigrants | South America | 3.1 /100 | #237 | Tragic 5.7% |
| Cherokee | 2.7 /100 | #238 | Tragic 5.8% |
| Venezuelans | 2.7 /100 | #239 | Tragic 5.8% |
| Fijians | 2.5 /100 | #240 | Tragic 5.8% |
| Immigrants | Panama | 2.5 /100 | #241 | Tragic 5.8% |
| Immigrants | Western Africa | 2.4 /100 | #242 | Tragic 5.8% |