Marshallese vs Immigrants from Hong Kong Married-Couple Family Poverty
COMPARE
Marshallese
Immigrants from Hong Kong
Married-Couple Family Poverty
Married-Couple Family Poverty Comparison
Marshallese
Immigrants from Hong Kong
5.2%
MARRIED-COUPLE FAMILY POVERTY
47.9/ 100
METRIC RATING
175th/ 347
METRIC RANK
4.7%
MARRIED-COUPLE FAMILY POVERTY
96.4/ 100
METRIC RATING
109th/ 347
METRIC RANK
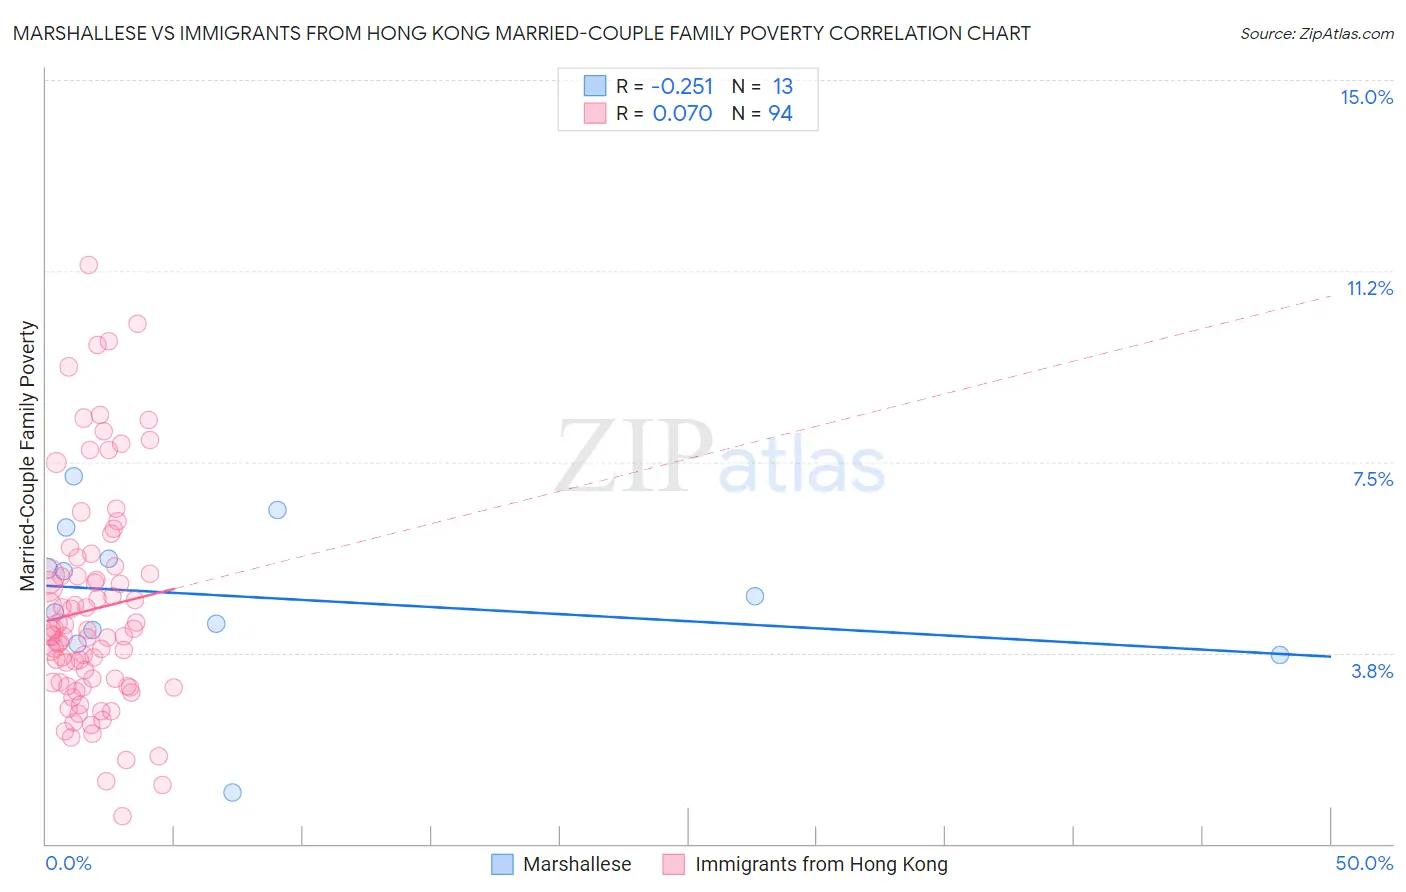
Marshallese vs Immigrants from Hong Kong Married-Couple Family Poverty Correlation Chart
The statistical analysis conducted on geographies consisting of 14,723,885 people shows a weak negative correlation between the proportion of Marshallese and poverty level among married-couple families in the United States with a correlation coefficient (R) of -0.251 and weighted average of 5.2%. Similarly, the statistical analysis conducted on geographies consisting of 252,495,550 people shows a slight positive correlation between the proportion of Immigrants from Hong Kong and poverty level among married-couple families in the United States with a correlation coefficient (R) of 0.070 and weighted average of 4.7%, a difference of 10.8%.
Married-Couple Family Poverty Correlation Summary
| Measurement | Marshallese | Immigrants from Hong Kong |
| Minimum | 1.00% | 0.53% |
| Maximum | 7.2% | 11.4% |
| Range | 6.2% | 10.8% |
| Mean | 4.8% | 4.6% |
| Median | 4.9% | 4.1% |
| Interquartile 25% (IQ1) | 4.1% | 3.1% |
| Interquartile 75% (IQ3) | 5.9% | 5.3% |
| Interquartile Range (IQR) | 1.8% | 2.2% |
| Standard Deviation (Sample) | 1.6% | 2.2% |
| Standard Deviation (Population) | 1.5% | 2.1% |
Similar Demographics by Married-Couple Family Poverty
Demographics Similar to Marshallese by Married-Couple Family Poverty
In terms of married-couple family poverty, the demographic groups most similar to Marshallese are Menominee (5.2%, a difference of 0.010%), Immigrants from Eastern Africa (5.2%, a difference of 0.24%), Immigrants from Kazakhstan (5.2%, a difference of 0.33%), Immigrants from Ukraine (5.2%, a difference of 0.35%), and Alsatian (5.2%, a difference of 0.38%).
| Demographics | Rating | Rank | Married-Couple Family Poverty |
| Immigrants | Uganda | 54.9 /100 | #168 | Average 5.2% |
| Ottawa | 54.5 /100 | #169 | Average 5.2% |
| Immigrants | Argentina | 54.4 /100 | #170 | Average 5.2% |
| Bermudans | 52.9 /100 | #171 | Average 5.2% |
| Immigrants | Northern Africa | 51.3 /100 | #172 | Average 5.2% |
| Alsatians | 51.2 /100 | #173 | Average 5.2% |
| Immigrants | Eastern Africa | 50.0 /100 | #174 | Average 5.2% |
| Marshallese | 47.9 /100 | #175 | Average 5.2% |
| Menominee | 47.8 /100 | #176 | Average 5.2% |
| Immigrants | Kazakhstan | 45.1 /100 | #177 | Average 5.2% |
| Immigrants | Ukraine | 44.9 /100 | #178 | Average 5.2% |
| Spanish | 41.4 /100 | #179 | Average 5.3% |
| Immigrants | Sierra Leone | 39.3 /100 | #180 | Fair 5.3% |
| Immigrants | Chile | 38.8 /100 | #181 | Fair 5.3% |
| Immigrants | Vietnam | 37.7 /100 | #182 | Fair 5.3% |
Demographics Similar to Immigrants from Hong Kong by Married-Couple Family Poverty
In terms of married-couple family poverty, the demographic groups most similar to Immigrants from Hong Kong are Immigrants from Bolivia (4.7%, a difference of 0.16%), Laotian (4.7%, a difference of 0.20%), Pakistani (4.7%, a difference of 0.20%), Tongan (4.7%, a difference of 0.38%), and Immigrants from Nepal (4.7%, a difference of 0.45%).
| Demographics | Rating | Rank | Married-Couple Family Poverty |
| Asians | 97.6 /100 | #102 | Exceptional 4.7% |
| Immigrants | Romania | 97.3 /100 | #103 | Exceptional 4.7% |
| Immigrants | Moldova | 97.1 /100 | #104 | Exceptional 4.7% |
| Aleuts | 97.0 /100 | #105 | Exceptional 4.7% |
| Immigrants | France | 96.9 /100 | #106 | Exceptional 4.7% |
| Immigrants | Germany | 96.8 /100 | #107 | Exceptional 4.7% |
| Laotians | 96.6 /100 | #108 | Exceptional 4.7% |
| Immigrants | Hong Kong | 96.4 /100 | #109 | Exceptional 4.7% |
| Immigrants | Bolivia | 96.2 /100 | #110 | Exceptional 4.7% |
| Pakistanis | 96.2 /100 | #111 | Exceptional 4.7% |
| Tongans | 95.9 /100 | #112 | Exceptional 4.7% |
| Immigrants | Nepal | 95.9 /100 | #113 | Exceptional 4.7% |
| Immigrants | Indonesia | 95.1 /100 | #114 | Exceptional 4.8% |
| Taiwanese | 94.8 /100 | #115 | Exceptional 4.8% |
| Celtics | 94.8 /100 | #116 | Exceptional 4.8% |