Lumbee vs Nepalese 9th Grade
COMPARE
Lumbee
Nepalese
9th Grade
9th Grade Comparison
Lumbee
Nepalese
94.4%
9TH GRADE
4.7/ 100
METRIC RATING
228th/ 347
METRIC RANK
92.0%
9TH GRADE
0.0/ 100
METRIC RATING
318th/ 347
METRIC RANK
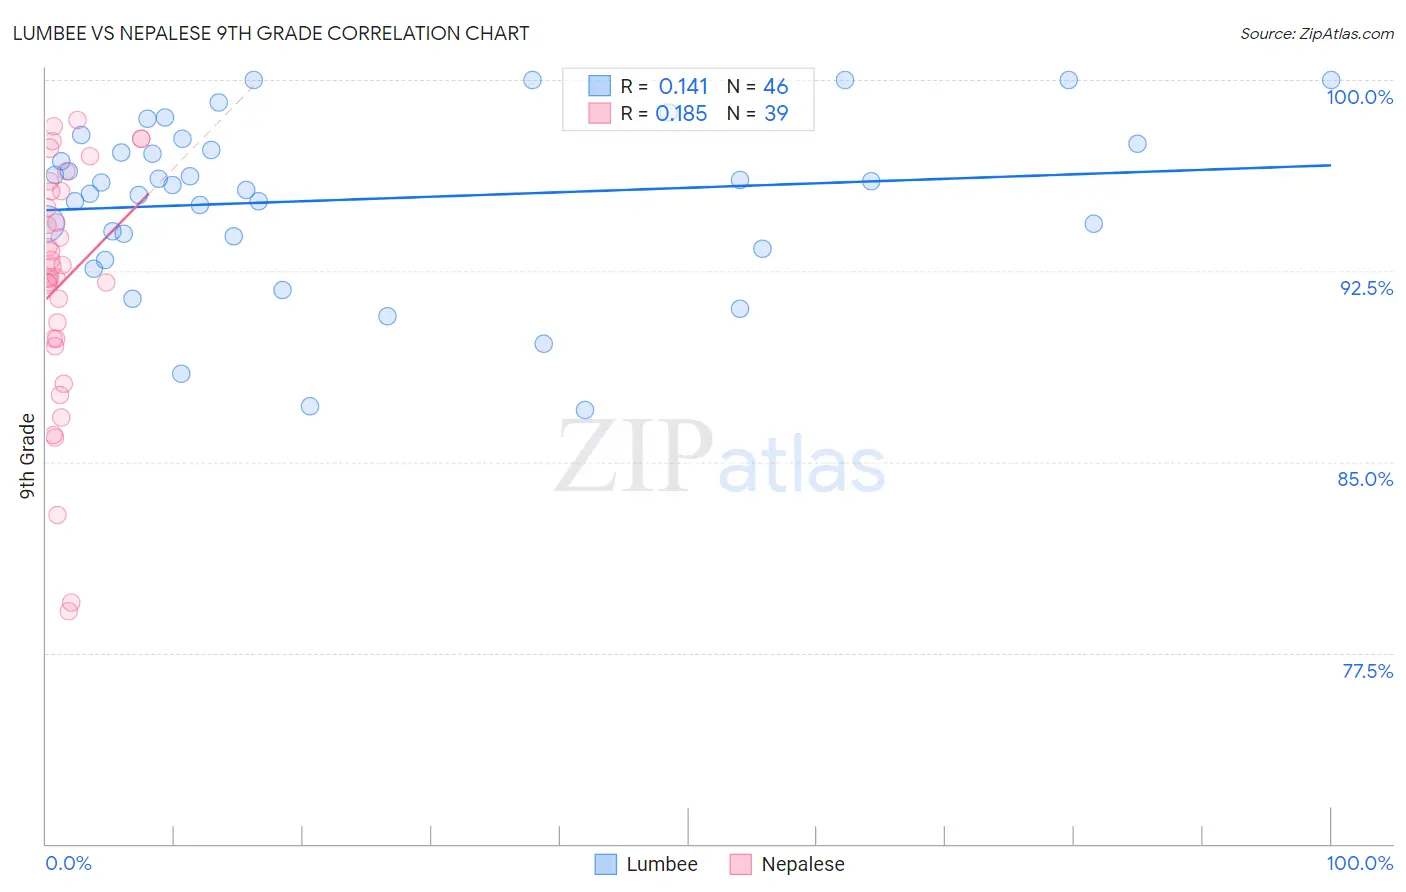
Lumbee vs Nepalese 9th Grade Correlation Chart
The statistical analysis conducted on geographies consisting of 92,298,865 people shows a poor positive correlation between the proportion of Lumbee and percentage of population with at least 9th grade education in the United States with a correlation coefficient (R) of 0.141 and weighted average of 94.4%. Similarly, the statistical analysis conducted on geographies consisting of 24,519,269 people shows a poor positive correlation between the proportion of Nepalese and percentage of population with at least 9th grade education in the United States with a correlation coefficient (R) of 0.185 and weighted average of 92.0%, a difference of 2.6%.
9th Grade Correlation Summary
| Measurement | Lumbee | Nepalese |
| Minimum | 87.0% | 79.1% |
| Maximum | 100.0% | 98.4% |
| Range | 13.0% | 19.3% |
| Mean | 95.3% | 92.1% |
| Median | 95.9% | 92.7% |
| Interquartile 25% (IQ1) | 93.9% | 89.8% |
| Interquartile 75% (IQ3) | 97.5% | 95.6% |
| Interquartile Range (IQR) | 3.6% | 5.8% |
| Standard Deviation (Sample) | 3.3% | 4.8% |
| Standard Deviation (Population) | 3.3% | 4.7% |
Similar Demographics by 9th Grade
Demographics Similar to Lumbee by 9th Grade
In terms of 9th grade, the demographic groups most similar to Lumbee are Immigrants from Sierra Leone (94.4%, a difference of 0.0%), Immigrants from Southern Europe (94.3%, a difference of 0.010%), Apache (94.3%, a difference of 0.020%), Ethiopian (94.4%, a difference of 0.030%), and Subsaharan African (94.4%, a difference of 0.030%).
| Demographics | Rating | Rank | 9th Grade |
| Immigrants | Eastern Africa | 8.2 /100 | #221 | Tragic 94.5% |
| Immigrants | Asia | 7.7 /100 | #222 | Tragic 94.4% |
| Bahamians | 7.0 /100 | #223 | Tragic 94.4% |
| Tongans | 6.0 /100 | #224 | Tragic 94.4% |
| Ethiopians | 5.4 /100 | #225 | Tragic 94.4% |
| Sub-Saharan Africans | 5.4 /100 | #226 | Tragic 94.4% |
| Immigrants | Sierra Leone | 4.8 /100 | #227 | Tragic 94.4% |
| Lumbee | 4.7 /100 | #228 | Tragic 94.4% |
| Immigrants | Southern Europe | 4.5 /100 | #229 | Tragic 94.3% |
| Apache | 4.2 /100 | #230 | Tragic 94.3% |
| Immigrants | Panama | 4.0 /100 | #231 | Tragic 94.3% |
| Immigrants | Africa | 3.9 /100 | #232 | Tragic 94.3% |
| Nigerians | 3.7 /100 | #233 | Tragic 94.3% |
| Costa Ricans | 3.5 /100 | #234 | Tragic 94.3% |
| Bolivians | 3.3 /100 | #235 | Tragic 94.3% |
Demographics Similar to Nepalese by 9th Grade
In terms of 9th grade, the demographic groups most similar to Nepalese are Ecuadorian (91.9%, a difference of 0.050%), Nicaraguan (91.9%, a difference of 0.090%), Immigrants from Ecuador (91.8%, a difference of 0.16%), Belizean (91.8%, a difference of 0.19%), and Puerto Rican (91.8%, a difference of 0.19%).
| Demographics | Rating | Rank | 9th Grade |
| Immigrants | Fiji | 0.0 /100 | #311 | Tragic 92.3% |
| Houma | 0.0 /100 | #312 | Tragic 92.3% |
| Vietnamese | 0.0 /100 | #313 | Tragic 92.3% |
| Immigrants | Portugal | 0.0 /100 | #314 | Tragic 92.2% |
| Immigrants | Caribbean | 0.0 /100 | #315 | Tragic 92.2% |
| Cape Verdeans | 0.0 /100 | #316 | Tragic 92.2% |
| Immigrants | Cuba | 0.0 /100 | #317 | Tragic 92.2% |
| Nepalese | 0.0 /100 | #318 | Tragic 92.0% |
| Ecuadorians | 0.0 /100 | #319 | Tragic 91.9% |
| Nicaraguans | 0.0 /100 | #320 | Tragic 91.9% |
| Immigrants | Ecuador | 0.0 /100 | #321 | Tragic 91.8% |
| Belizeans | 0.0 /100 | #322 | Tragic 91.8% |
| Puerto Ricans | 0.0 /100 | #323 | Tragic 91.8% |
| Immigrants | Belize | 0.0 /100 | #324 | Tragic 91.8% |
| Central American Indians | 0.0 /100 | #325 | Tragic 91.5% |