Lumbee vs Nepalese Female Unemployment
COMPARE
Lumbee
Nepalese
Female Unemployment
Female Unemployment Comparison
Lumbee
Nepalese
5.9%
FEMALE UNEMPLOYMENT
0.0/ 100
METRIC RATING
272nd/ 347
METRIC RANK
5.9%
FEMALE UNEMPLOYMENT
0.0/ 100
METRIC RATING
267th/ 347
METRIC RANK
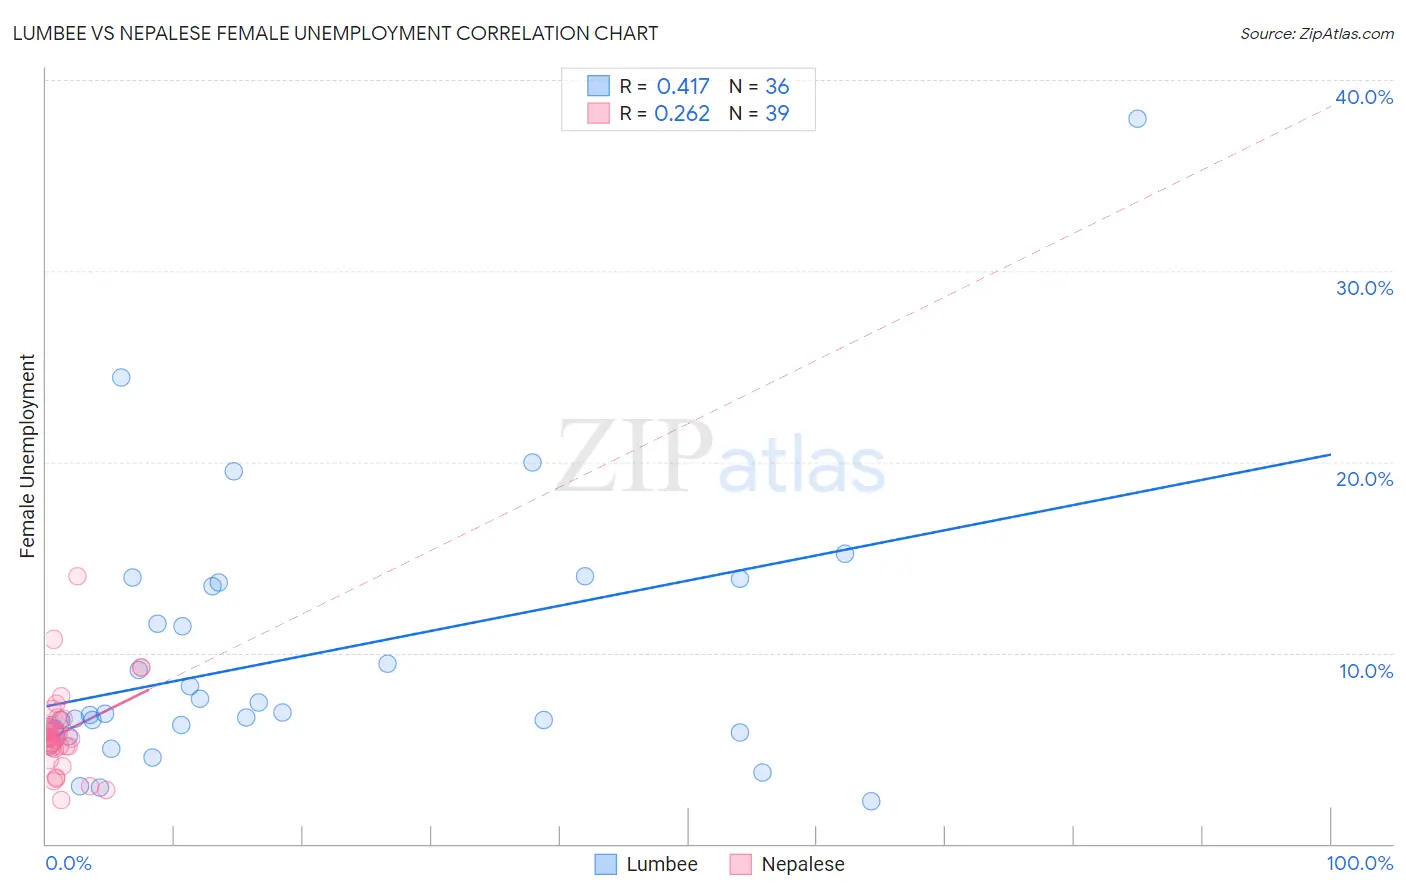
Lumbee vs Nepalese Female Unemployment Correlation Chart
The statistical analysis conducted on geographies consisting of 92,134,947 people shows a moderate positive correlation between the proportion of Lumbee and unemploymnet rate among females in the United States with a correlation coefficient (R) of 0.417 and weighted average of 5.9%. Similarly, the statistical analysis conducted on geographies consisting of 24,519,269 people shows a weak positive correlation between the proportion of Nepalese and unemploymnet rate among females in the United States with a correlation coefficient (R) of 0.262 and weighted average of 5.9%, a difference of 1.0%.
Female Unemployment Correlation Summary
| Measurement | Lumbee | Nepalese |
| Minimum | 2.2% | 2.3% |
| Maximum | 38.0% | 14.0% |
| Range | 35.8% | 11.7% |
| Mean | 9.8% | 5.8% |
| Median | 6.9% | 5.5% |
| Interquartile 25% (IQ1) | 5.9% | 5.0% |
| Interquartile 75% (IQ3) | 13.6% | 6.5% |
| Interquartile Range (IQR) | 7.7% | 1.5% |
| Standard Deviation (Sample) | 7.0% | 2.2% |
| Standard Deviation (Population) | 6.9% | 2.1% |
Demographics Similar to Lumbee and Nepalese by Female Unemployment
In terms of female unemployment, the demographic groups most similar to Lumbee are Ghanaian (5.9%, a difference of 0.010%), African (5.9%, a difference of 0.090%), Central American (5.9%, a difference of 0.19%), Immigrants from Honduras (5.9%, a difference of 0.29%), and Senegalese (6.0%, a difference of 0.58%). Similarly, the demographic groups most similar to Nepalese are Honduran (5.9%, a difference of 0.10%), Cape Verdean (5.9%, a difference of 0.11%), Immigrants from Western Africa (5.9%, a difference of 0.30%), Blackfeet (5.9%, a difference of 0.39%), and Immigrants from Honduras (5.9%, a difference of 0.71%).
| Demographics | Rating | Rank | Female Unemployment |
| Immigrants | Fiji | 0.2 /100 | #259 | Tragic 5.8% |
| Nigerians | 0.2 /100 | #260 | Tragic 5.8% |
| Kiowa | 0.1 /100 | #261 | Tragic 5.8% |
| Immigrants | Nigeria | 0.1 /100 | #262 | Tragic 5.8% |
| Immigrants | Azores | 0.1 /100 | #263 | Tragic 5.8% |
| Immigrants | Bahamas | 0.1 /100 | #264 | Tragic 5.8% |
| Blackfeet | 0.0 /100 | #265 | Tragic 5.9% |
| Cape Verdeans | 0.0 /100 | #266 | Tragic 5.9% |
| Nepalese | 0.0 /100 | #267 | Tragic 5.9% |
| Hondurans | 0.0 /100 | #268 | Tragic 5.9% |
| Immigrants | Western Africa | 0.0 /100 | #269 | Tragic 5.9% |
| Immigrants | Honduras | 0.0 /100 | #270 | Tragic 5.9% |
| Central Americans | 0.0 /100 | #271 | Tragic 5.9% |
| Lumbee | 0.0 /100 | #272 | Tragic 5.9% |
| Ghanaians | 0.0 /100 | #273 | Tragic 5.9% |
| Africans | 0.0 /100 | #274 | Tragic 5.9% |
| Senegalese | 0.0 /100 | #275 | Tragic 6.0% |
| Bahamians | 0.0 /100 | #276 | Tragic 6.0% |
| Immigrants | Ghana | 0.0 /100 | #277 | Tragic 6.0% |
| Yaqui | 0.0 /100 | #278 | Tragic 6.0% |
| Armenians | 0.0 /100 | #279 | Tragic 6.0% |