Lumbee vs Immigrants from Afghanistan 7th Grade
COMPARE
Lumbee
Immigrants from Afghanistan
7th Grade
7th Grade Comparison
Lumbee
Immigrants from Afghanistan
96.6%
7TH GRADE
97.8/ 100
METRIC RATING
107th/ 347
METRIC RANK
95.1%
7TH GRADE
0.2/ 100
METRIC RATING
277th/ 347
METRIC RANK
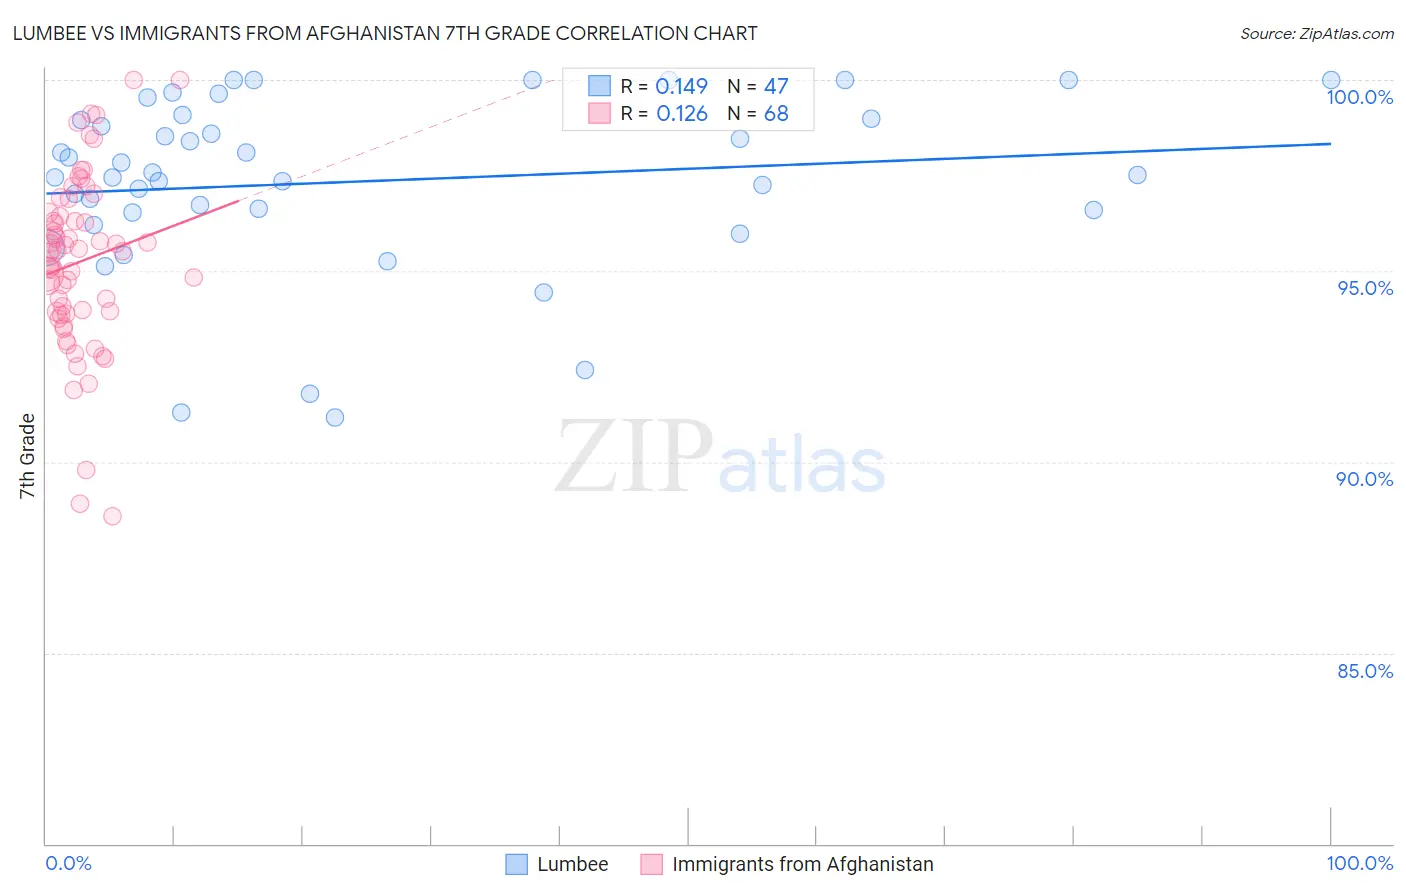
Lumbee vs Immigrants from Afghanistan 7th Grade Correlation Chart
The statistical analysis conducted on geographies consisting of 92,299,110 people shows a poor positive correlation between the proportion of Lumbee and percentage of population with at least 7th grade education in the United States with a correlation coefficient (R) of 0.149 and weighted average of 96.6%. Similarly, the statistical analysis conducted on geographies consisting of 147,629,924 people shows a poor positive correlation between the proportion of Immigrants from Afghanistan and percentage of population with at least 7th grade education in the United States with a correlation coefficient (R) of 0.126 and weighted average of 95.1%, a difference of 1.6%.
7th Grade Correlation Summary
| Measurement | Lumbee | Immigrants from Afghanistan |
| Minimum | 91.1% | 88.6% |
| Maximum | 100.0% | 100.0% |
| Range | 8.9% | 11.4% |
| Mean | 97.3% | 95.2% |
| Median | 97.5% | 95.5% |
| Interquartile 25% (IQ1) | 96.5% | 93.9% |
| Interquartile 75% (IQ3) | 99.0% | 96.5% |
| Interquartile Range (IQR) | 2.5% | 2.6% |
| Standard Deviation (Sample) | 2.3% | 2.3% |
| Standard Deviation (Population) | 2.3% | 2.3% |
Similar Demographics by 7th Grade
Demographics Similar to Lumbee by 7th Grade
In terms of 7th grade, the demographic groups most similar to Lumbee are Immigrants from Saudi Arabia (96.6%, a difference of 0.0%), Iroquois (96.6%, a difference of 0.010%), Bhutanese (96.6%, a difference of 0.010%), Shoshone (96.6%, a difference of 0.020%), and South African (96.6%, a difference of 0.020%).
| Demographics | Rating | Rank | 7th Grade |
| German Russians | 98.6 /100 | #100 | Exceptional 96.7% |
| Thais | 98.6 /100 | #101 | Exceptional 96.7% |
| Immigrants | Czechoslovakia | 98.3 /100 | #102 | Exceptional 96.6% |
| Immigrants | Singapore | 98.3 /100 | #103 | Exceptional 96.6% |
| Shoshone | 98.1 /100 | #104 | Exceptional 96.6% |
| South Africans | 98.0 /100 | #105 | Exceptional 96.6% |
| Iroquois | 97.9 /100 | #106 | Exceptional 96.6% |
| Lumbee | 97.8 /100 | #107 | Exceptional 96.6% |
| Immigrants | Saudi Arabia | 97.8 /100 | #108 | Exceptional 96.6% |
| Bhutanese | 97.7 /100 | #109 | Exceptional 96.6% |
| Okinawans | 97.4 /100 | #110 | Exceptional 96.6% |
| Immigrants | Latvia | 97.4 /100 | #111 | Exceptional 96.6% |
| Immigrants | Nonimmigrants | 97.0 /100 | #112 | Exceptional 96.5% |
| Pueblo | 96.8 /100 | #113 | Exceptional 96.5% |
| Immigrants | Zimbabwe | 96.6 /100 | #114 | Exceptional 96.5% |
Demographics Similar to Immigrants from Afghanistan by 7th Grade
In terms of 7th grade, the demographic groups most similar to Immigrants from Afghanistan are Immigrants from Thailand (95.1%, a difference of 0.020%), Immigrants from Trinidad and Tobago (95.1%, a difference of 0.030%), Immigrants from Colombia (95.1%, a difference of 0.040%), Barbadian (95.1%, a difference of 0.040%), and Immigrants from South America (95.1%, a difference of 0.050%).
| Demographics | Rating | Rank | 7th Grade |
| Houma | 0.2 /100 | #270 | Tragic 95.1% |
| Immigrants | South America | 0.2 /100 | #271 | Tragic 95.1% |
| Peruvians | 0.2 /100 | #272 | Tragic 95.1% |
| Immigrants | Uzbekistan | 0.2 /100 | #273 | Tragic 95.1% |
| Immigrants | Western Africa | 0.2 /100 | #274 | Tragic 95.1% |
| Immigrants | Colombia | 0.2 /100 | #275 | Tragic 95.1% |
| Immigrants | Thailand | 0.2 /100 | #276 | Tragic 95.1% |
| Immigrants | Afghanistan | 0.2 /100 | #277 | Tragic 95.1% |
| Immigrants | Trinidad and Tobago | 0.1 /100 | #278 | Tragic 95.1% |
| Barbadians | 0.1 /100 | #279 | Tragic 95.1% |
| Immigrants | St. Vincent and the Grenadines | 0.1 /100 | #280 | Tragic 95.0% |
| Tohono O'odham | 0.1 /100 | #281 | Tragic 95.0% |
| Immigrants | Bolivia | 0.1 /100 | #282 | Tragic 95.0% |
| Immigrants | Barbados | 0.1 /100 | #283 | Tragic 95.0% |
| Armenians | 0.1 /100 | #284 | Tragic 95.0% |