Lumbee vs Immigrants from Afghanistan Poverty
COMPARE
Lumbee
Immigrants from Afghanistan
Poverty
Poverty Comparison
Lumbee
Immigrants from Afghanistan
21.9%
POVERTY
0.0/ 100
METRIC RATING
344th/ 347
METRIC RANK
12.4%
POVERTY
42.1/ 100
METRIC RATING
181st/ 347
METRIC RANK
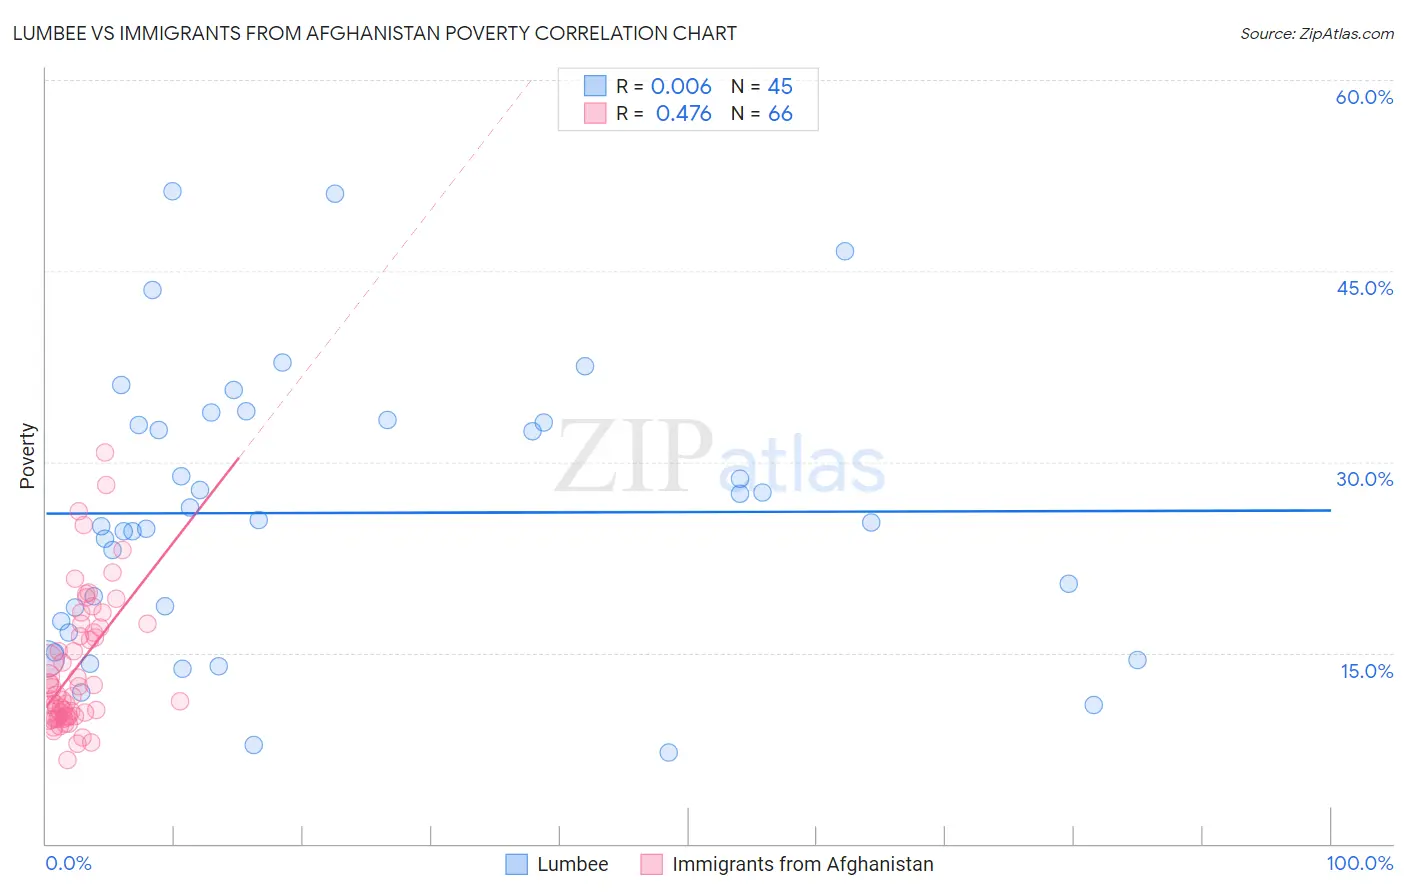
Lumbee vs Immigrants from Afghanistan Poverty Correlation Chart
The statistical analysis conducted on geographies consisting of 92,257,257 people shows no correlation between the proportion of Lumbee and poverty level in the United States with a correlation coefficient (R) of 0.006 and weighted average of 21.9%. Similarly, the statistical analysis conducted on geographies consisting of 147,635,762 people shows a moderate positive correlation between the proportion of Immigrants from Afghanistan and poverty level in the United States with a correlation coefficient (R) of 0.476 and weighted average of 12.4%, a difference of 76.5%.
Poverty Correlation Summary
| Measurement | Lumbee | Immigrants from Afghanistan |
| Minimum | 7.2% | 6.6% |
| Maximum | 51.2% | 30.8% |
| Range | 44.0% | 24.2% |
| Mean | 26.0% | 13.8% |
| Median | 25.2% | 11.6% |
| Interquartile 25% (IQ1) | 17.0% | 10.0% |
| Interquartile 75% (IQ3) | 33.2% | 17.0% |
| Interquartile Range (IQR) | 16.2% | 7.0% |
| Standard Deviation (Sample) | 10.8% | 5.2% |
| Standard Deviation (Population) | 10.7% | 5.2% |
Similar Demographics by Poverty
Demographics Similar to Lumbee by Poverty
In terms of poverty, the demographic groups most similar to Lumbee are Pima (21.9%, a difference of 0.26%), Immigrants from Yemen (21.5%, a difference of 1.9%), Hopi (20.8%, a difference of 5.1%), Yup'ik (20.8%, a difference of 5.3%), and Navajo (23.1%, a difference of 5.4%).
| Demographics | Rating | Rank | Poverty |
| Houma | 0.0 /100 | #333 | Tragic 18.4% |
| Apache | 0.0 /100 | #334 | Tragic 18.4% |
| Cheyenne | 0.0 /100 | #335 | Tragic 18.9% |
| Pueblo | 0.0 /100 | #336 | Tragic 19.4% |
| Sioux | 0.0 /100 | #337 | Tragic 19.8% |
| Yuman | 0.0 /100 | #338 | Tragic 20.2% |
| Crow | 0.0 /100 | #339 | Tragic 20.7% |
| Yup'ik | 0.0 /100 | #340 | Tragic 20.8% |
| Hopi | 0.0 /100 | #341 | Tragic 20.8% |
| Immigrants | Yemen | 0.0 /100 | #342 | Tragic 21.5% |
| Pima | 0.0 /100 | #343 | Tragic 21.9% |
| Lumbee | 0.0 /100 | #344 | Tragic 21.9% |
| Navajo | 0.0 /100 | #345 | Tragic 23.1% |
| Puerto Ricans | 0.0 /100 | #346 | Tragic 23.7% |
| Tohono O'odham | 0.0 /100 | #347 | Tragic 24.4% |
Demographics Similar to Immigrants from Afghanistan by Poverty
In terms of poverty, the demographic groups most similar to Immigrants from Afghanistan are Immigrants from Cameroon (12.4%, a difference of 0.040%), Mongolian (12.4%, a difference of 0.15%), Immigrants from Morocco (12.4%, a difference of 0.19%), Immigrants from Iraq (12.4%, a difference of 0.19%), and Uruguayan (12.4%, a difference of 0.25%).
| Demographics | Rating | Rank | Poverty |
| Lebanese | 50.0 /100 | #174 | Average 12.3% |
| South Americans | 48.7 /100 | #175 | Average 12.3% |
| Immigrants | Colombia | 47.7 /100 | #176 | Average 12.3% |
| Immigrants | Syria | 47.5 /100 | #177 | Average 12.3% |
| Uruguayans | 44.7 /100 | #178 | Average 12.4% |
| Immigrants | Morocco | 44.0 /100 | #179 | Average 12.4% |
| Mongolians | 43.6 /100 | #180 | Average 12.4% |
| Immigrants | Afghanistan | 42.1 /100 | #181 | Average 12.4% |
| Immigrants | Cameroon | 41.7 /100 | #182 | Average 12.4% |
| Immigrants | Iraq | 40.2 /100 | #183 | Average 12.4% |
| Kenyans | 38.8 /100 | #184 | Fair 12.5% |
| Israelis | 36.4 /100 | #185 | Fair 12.5% |
| Immigrants | Sierra Leone | 36.3 /100 | #186 | Fair 12.5% |
| Hawaiians | 34.1 /100 | #187 | Fair 12.5% |
| Immigrants | Costa Rica | 33.3 /100 | #188 | Fair 12.5% |