Immigrants from Latvia vs Immigrants from Afghanistan Married-Couple Family Poverty
COMPARE
Immigrants from Latvia
Immigrants from Afghanistan
Married-Couple Family Poverty
Married-Couple Family Poverty Comparison
Immigrants from Latvia
Immigrants from Afghanistan
4.5%
MARRIED-COUPLE FAMILY POVERTY
99.1/ 100
METRIC RATING
77th/ 347
METRIC RANK
5.8%
MARRIED-COUPLE FAMILY POVERTY
2.1/ 100
METRIC RATING
245th/ 347
METRIC RANK
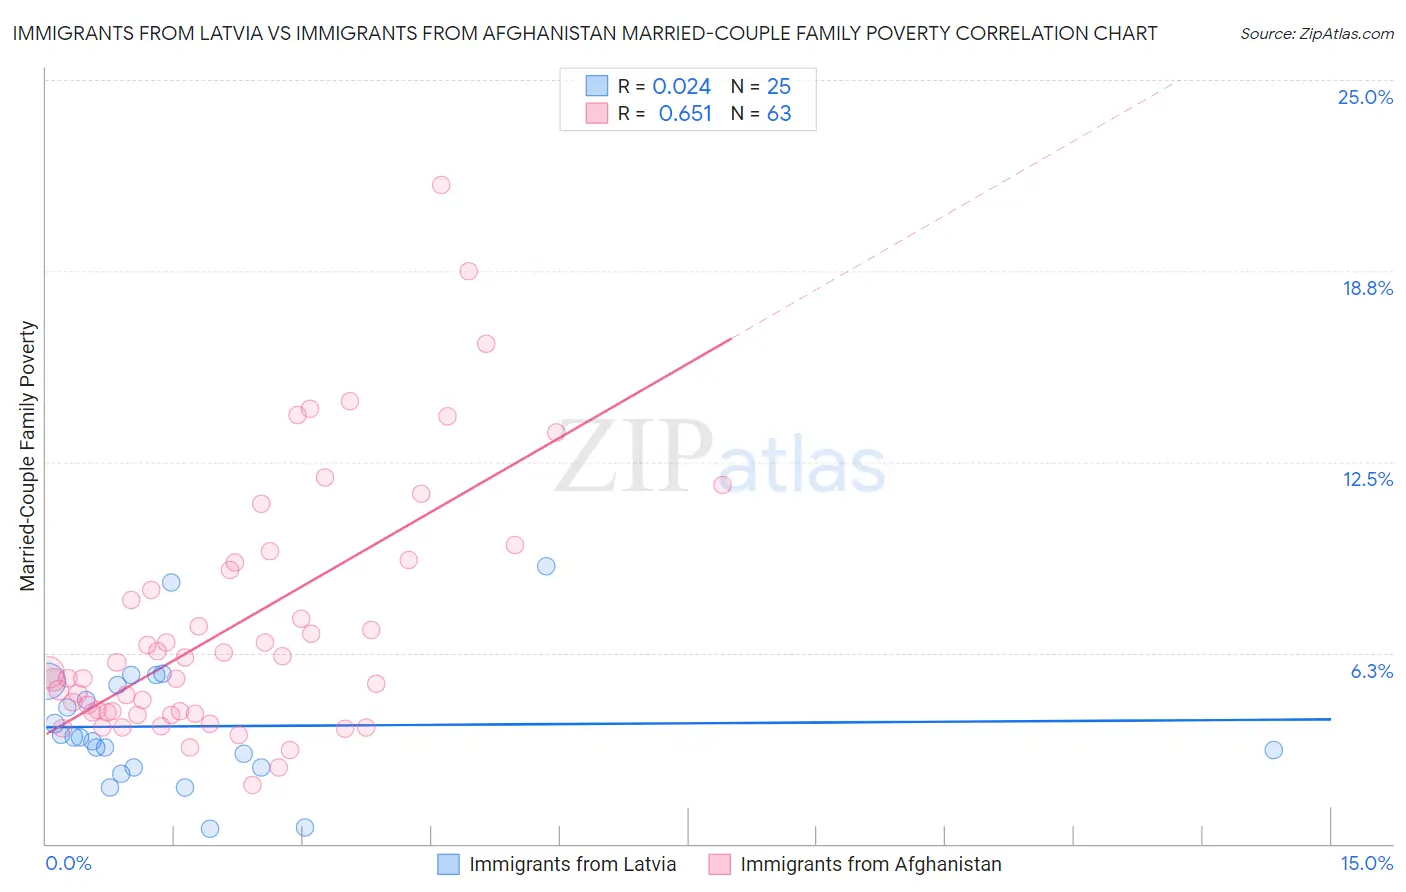
Immigrants from Latvia vs Immigrants from Afghanistan Married-Couple Family Poverty Correlation Chart
The statistical analysis conducted on geographies consisting of 113,402,178 people shows no correlation between the proportion of Immigrants from Latvia and poverty level among married-couple families in the United States with a correlation coefficient (R) of 0.024 and weighted average of 4.5%. Similarly, the statistical analysis conducted on geographies consisting of 147,133,206 people shows a significant positive correlation between the proportion of Immigrants from Afghanistan and poverty level among married-couple families in the United States with a correlation coefficient (R) of 0.651 and weighted average of 5.8%, a difference of 28.6%.
Married-Couple Family Poverty Correlation Summary
| Measurement | Immigrants from Latvia | Immigrants from Afghanistan |
| Minimum | 0.50% | 1.9% |
| Maximum | 9.1% | 21.6% |
| Range | 8.6% | 19.6% |
| Mean | 3.8% | 7.2% |
| Median | 3.5% | 5.6% |
| Interquartile 25% (IQ1) | 2.5% | 4.3% |
| Interquartile 75% (IQ3) | 5.3% | 9.2% |
| Interquartile Range (IQR) | 2.8% | 4.9% |
| Standard Deviation (Sample) | 2.1% | 4.1% |
| Standard Deviation (Population) | 2.0% | 4.1% |
Similar Demographics by Married-Couple Family Poverty
Demographics Similar to Immigrants from Latvia by Married-Couple Family Poverty
In terms of married-couple family poverty, the demographic groups most similar to Immigrants from Latvia are Scotch-Irish (4.5%, a difference of 0.080%), Immigrants from South Africa (4.5%, a difference of 0.17%), Cambodian (4.5%, a difference of 0.28%), Immigrants from Iran (4.5%, a difference of 0.31%), and Icelander (4.5%, a difference of 0.38%).
| Demographics | Rating | Rank | Married-Couple Family Poverty |
| Immigrants | Korea | 99.4 /100 | #70 | Exceptional 4.5% |
| Immigrants | North America | 99.3 /100 | #71 | Exceptional 4.5% |
| Immigrants | England | 99.3 /100 | #72 | Exceptional 4.5% |
| Ukrainians | 99.2 /100 | #73 | Exceptional 4.5% |
| Immigrants | Austria | 99.2 /100 | #74 | Exceptional 4.5% |
| Cambodians | 99.2 /100 | #75 | Exceptional 4.5% |
| Immigrants | South Africa | 99.1 /100 | #76 | Exceptional 4.5% |
| Immigrants | Latvia | 99.1 /100 | #77 | Exceptional 4.5% |
| Scotch-Irish | 99.1 /100 | #78 | Exceptional 4.5% |
| Immigrants | Iran | 99.0 /100 | #79 | Exceptional 4.5% |
| Icelanders | 99.0 /100 | #80 | Exceptional 4.5% |
| Immigrants | Greece | 98.9 /100 | #81 | Exceptional 4.5% |
| Canadians | 98.8 /100 | #82 | Exceptional 4.5% |
| Immigrants | Denmark | 98.8 /100 | #83 | Exceptional 4.6% |
| Immigrants | Croatia | 98.7 /100 | #84 | Exceptional 4.6% |
Demographics Similar to Immigrants from Afghanistan by Married-Couple Family Poverty
In terms of married-couple family poverty, the demographic groups most similar to Immigrants from Afghanistan are Chickasaw (5.8%, a difference of 0.15%), Somali (5.8%, a difference of 0.16%), Immigrants from Western Africa (5.8%, a difference of 0.31%), Immigrants from Panama (5.8%, a difference of 0.40%), and Fijian (5.8%, a difference of 0.43%).
| Demographics | Rating | Rank | Married-Couple Family Poverty |
| Cherokee | 2.7 /100 | #238 | Tragic 5.8% |
| Venezuelans | 2.7 /100 | #239 | Tragic 5.8% |
| Fijians | 2.5 /100 | #240 | Tragic 5.8% |
| Immigrants | Panama | 2.5 /100 | #241 | Tragic 5.8% |
| Immigrants | Western Africa | 2.4 /100 | #242 | Tragic 5.8% |
| Somalis | 2.3 /100 | #243 | Tragic 5.8% |
| Chickasaw | 2.3 /100 | #244 | Tragic 5.8% |
| Immigrants | Afghanistan | 2.1 /100 | #245 | Tragic 5.8% |
| Immigrants | Venezuela | 1.8 /100 | #246 | Tragic 5.8% |
| Iraqis | 1.4 /100 | #247 | Tragic 5.9% |
| Cree | 1.2 /100 | #248 | Tragic 5.9% |
| Tsimshian | 1.1 /100 | #249 | Tragic 5.9% |
| Immigrants | Eritrea | 1.1 /100 | #250 | Tragic 5.9% |
| Immigrants | Ghana | 1.0 /100 | #251 | Tragic 5.9% |
| Immigrants | Western Asia | 0.7 /100 | #252 | Tragic 6.0% |