Chippewa vs Lumbee Single Female Poverty
COMPARE
Chippewa
Lumbee
Single Female Poverty
Single Female Poverty Comparison
Chippewa
Lumbee
26.8%
SINGLE FEMALE POVERTY
0.0/ 100
METRIC RATING
323rd/ 347
METRIC RANK
33.0%
SINGLE FEMALE POVERTY
0.0/ 100
METRIC RATING
344th/ 347
METRIC RANK
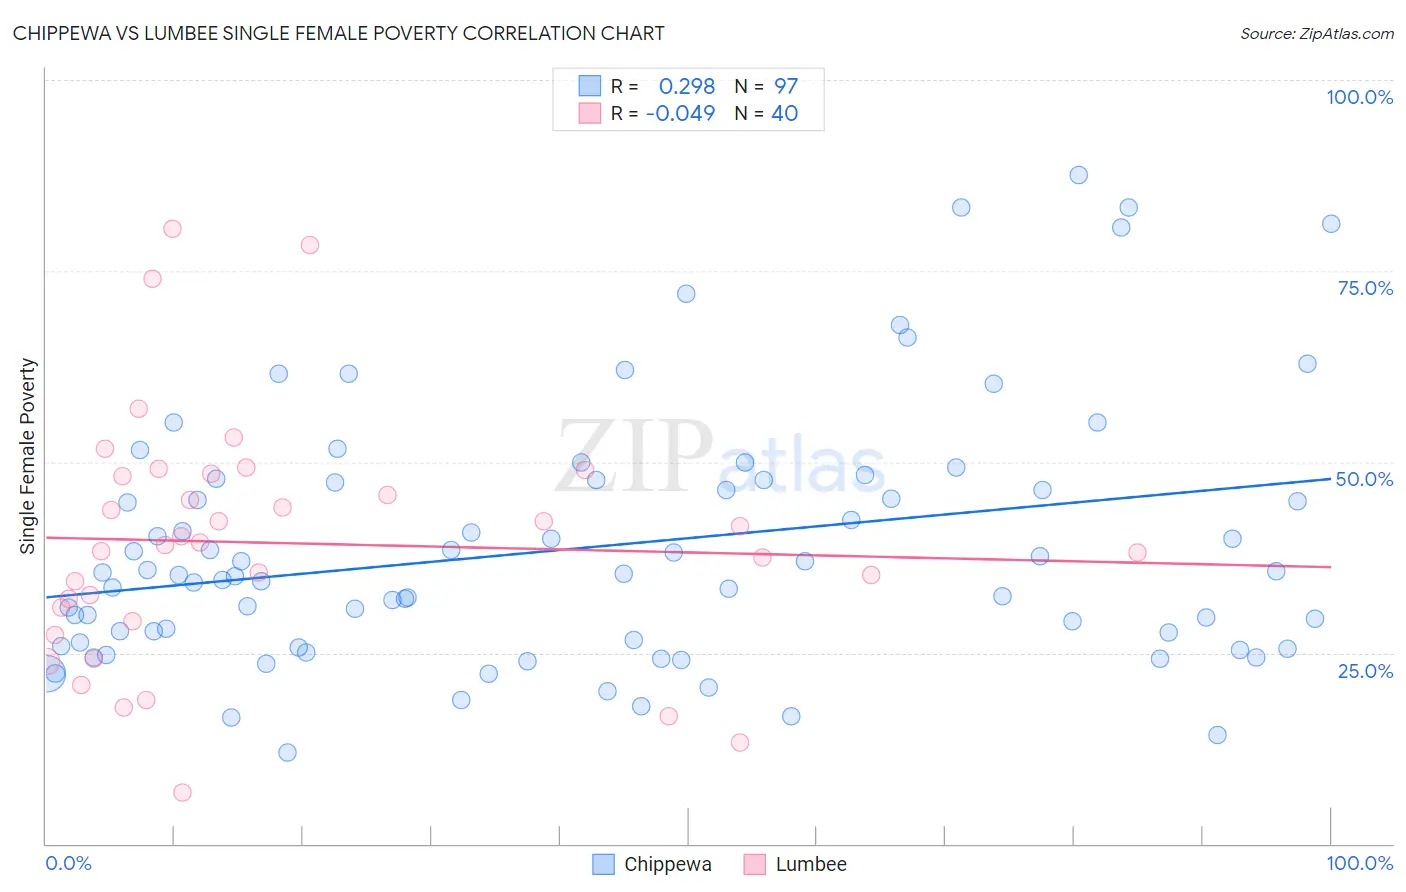
Chippewa vs Lumbee Single Female Poverty Correlation Chart
The statistical analysis conducted on geographies consisting of 213,087,028 people shows a weak positive correlation between the proportion of Chippewa and poverty level among single females in the United States with a correlation coefficient (R) of 0.298 and weighted average of 26.8%. Similarly, the statistical analysis conducted on geographies consisting of 91,816,335 people shows no correlation between the proportion of Lumbee and poverty level among single females in the United States with a correlation coefficient (R) of -0.049 and weighted average of 33.0%, a difference of 23.0%.
Single Female Poverty Correlation Summary
| Measurement | Chippewa | Lumbee |
| Minimum | 11.9% | 6.8% |
| Maximum | 87.6% | 80.6% |
| Range | 75.7% | 73.8% |
| Mean | 38.7% | 39.4% |
| Median | 35.2% | 39.3% |
| Interquartile 25% (IQ1) | 26.1% | 30.1% |
| Interquartile 75% (IQ3) | 47.5% | 48.3% |
| Interquartile Range (IQR) | 21.4% | 18.2% |
| Standard Deviation (Sample) | 16.5% | 16.1% |
| Standard Deviation (Population) | 16.4% | 15.9% |
Similar Demographics by Single Female Poverty
Demographics Similar to Chippewa by Single Female Poverty
In terms of single female poverty, the demographic groups most similar to Chippewa are Seminole (26.8%, a difference of 0.10%), Kiowa (26.9%, a difference of 0.41%), Yup'ik (26.6%, a difference of 0.84%), Choctaw (27.2%, a difference of 1.4%), and Arapaho (26.4%, a difference of 1.5%).
| Demographics | Rating | Rank | Single Female Poverty |
| Immigrants | Somalia | 0.0 /100 | #316 | Tragic 25.8% |
| Ottawa | 0.0 /100 | #317 | Tragic 26.0% |
| Chickasaw | 0.0 /100 | #318 | Tragic 26.3% |
| Blacks/African Americans | 0.0 /100 | #319 | Tragic 26.4% |
| Arapaho | 0.0 /100 | #320 | Tragic 26.4% |
| Yup'ik | 0.0 /100 | #321 | Tragic 26.6% |
| Seminole | 0.0 /100 | #322 | Tragic 26.8% |
| Chippewa | 0.0 /100 | #323 | Tragic 26.8% |
| Kiowa | 0.0 /100 | #324 | Tragic 26.9% |
| Choctaw | 0.0 /100 | #325 | Tragic 27.2% |
| Creek | 0.0 /100 | #326 | Tragic 27.4% |
| Dutch West Indians | 0.0 /100 | #327 | Tragic 27.5% |
| Apache | 0.0 /100 | #328 | Tragic 27.7% |
| Menominee | 0.0 /100 | #329 | Tragic 27.8% |
| Hopi | 0.0 /100 | #330 | Tragic 28.0% |
Demographics Similar to Lumbee by Single Female Poverty
In terms of single female poverty, the demographic groups most similar to Lumbee are Crow (32.4%, a difference of 1.8%), Houma (33.8%, a difference of 2.4%), Puerto Rican (34.1%, a difference of 3.3%), Tohono O'odham (34.2%, a difference of 3.6%), and Navajo (31.7%, a difference of 4.3%).
| Demographics | Rating | Rank | Single Female Poverty |
| Ute | 0.0 /100 | #333 | Tragic 28.4% |
| Pueblo | 0.0 /100 | #334 | Tragic 28.6% |
| Immigrants | Yemen | 0.0 /100 | #335 | Tragic 28.9% |
| Colville | 0.0 /100 | #336 | Tragic 29.1% |
| Yuman | 0.0 /100 | #337 | Tragic 29.4% |
| Pima | 0.0 /100 | #338 | Tragic 30.3% |
| Cheyenne | 0.0 /100 | #339 | Tragic 30.4% |
| Cajuns | 0.0 /100 | #340 | Tragic 30.6% |
| Sioux | 0.0 /100 | #341 | Tragic 31.3% |
| Navajo | 0.0 /100 | #342 | Tragic 31.7% |
| Crow | 0.0 /100 | #343 | Tragic 32.4% |
| Lumbee | 0.0 /100 | #344 | Tragic 33.0% |
| Houma | 0.0 /100 | #345 | Tragic 33.8% |
| Puerto Ricans | 0.0 /100 | #346 | Tragic 34.1% |
| Tohono O'odham | 0.0 /100 | #347 | Tragic 34.2% |