Maltese vs Lumbee Single Female Poverty
COMPARE
Maltese
Lumbee
Single Female Poverty
Single Female Poverty Comparison
Maltese
Lumbee
18.3%
SINGLE FEMALE POVERTY
100.0/ 100
METRIC RATING
21st/ 347
METRIC RANK
33.0%
SINGLE FEMALE POVERTY
0.0/ 100
METRIC RATING
344th/ 347
METRIC RANK
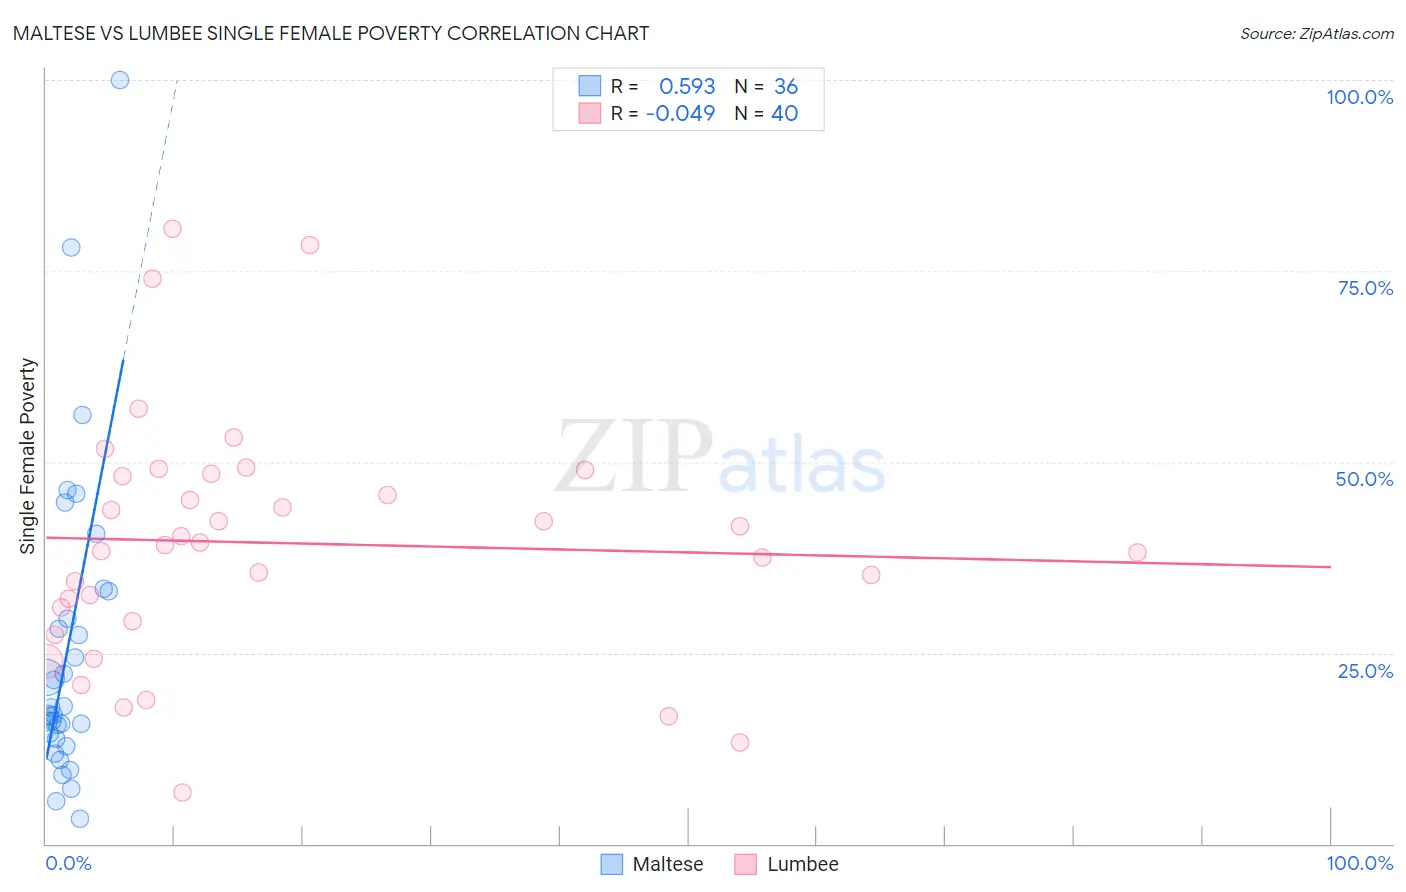
Maltese vs Lumbee Single Female Poverty Correlation Chart
The statistical analysis conducted on geographies consisting of 125,419,200 people shows a substantial positive correlation between the proportion of Maltese and poverty level among single females in the United States with a correlation coefficient (R) of 0.593 and weighted average of 18.3%. Similarly, the statistical analysis conducted on geographies consisting of 91,816,335 people shows no correlation between the proportion of Lumbee and poverty level among single females in the United States with a correlation coefficient (R) of -0.049 and weighted average of 33.0%, a difference of 80.6%.
Single Female Poverty Correlation Summary
| Measurement | Maltese | Lumbee |
| Minimum | 3.3% | 6.8% |
| Maximum | 100.0% | 80.6% |
| Range | 96.7% | 73.8% |
| Mean | 25.4% | 39.4% |
| Median | 17.4% | 39.3% |
| Interquartile 25% (IQ1) | 14.1% | 30.1% |
| Interquartile 75% (IQ3) | 31.2% | 48.3% |
| Interquartile Range (IQR) | 17.1% | 18.2% |
| Standard Deviation (Sample) | 20.2% | 16.1% |
| Standard Deviation (Population) | 19.9% | 15.9% |
Similar Demographics by Single Female Poverty
Demographics Similar to Maltese by Single Female Poverty
In terms of single female poverty, the demographic groups most similar to Maltese are Burmese (18.3%, a difference of 0.010%), Asian (18.3%, a difference of 0.020%), Immigrants from Greece (18.3%, a difference of 0.060%), Armenian (18.3%, a difference of 0.24%), and Immigrants from Singapore (18.3%, a difference of 0.34%).
| Demographics | Rating | Rank | Single Female Poverty |
| Bolivians | 100.0 /100 | #14 | Exceptional 17.9% |
| Indians (Asian) | 100.0 /100 | #15 | Exceptional 17.9% |
| Iranians | 100.0 /100 | #16 | Exceptional 18.0% |
| Immigrants | Korea | 100.0 /100 | #17 | Exceptional 18.1% |
| Immigrants | Eastern Asia | 100.0 /100 | #18 | Exceptional 18.1% |
| Immigrants | China | 100.0 /100 | #19 | Exceptional 18.1% |
| Immigrants | Greece | 100.0 /100 | #20 | Exceptional 18.3% |
| Maltese | 100.0 /100 | #21 | Exceptional 18.3% |
| Burmese | 100.0 /100 | #22 | Exceptional 18.3% |
| Asians | 100.0 /100 | #23 | Exceptional 18.3% |
| Armenians | 100.0 /100 | #24 | Exceptional 18.3% |
| Immigrants | Singapore | 100.0 /100 | #25 | Exceptional 18.3% |
| Immigrants | Israel | 100.0 /100 | #26 | Exceptional 18.3% |
| Immigrants | Pakistan | 100.0 /100 | #27 | Exceptional 18.4% |
| Immigrants | Moldova | 100.0 /100 | #28 | Exceptional 18.5% |
Demographics Similar to Lumbee by Single Female Poverty
In terms of single female poverty, the demographic groups most similar to Lumbee are Crow (32.4%, a difference of 1.8%), Houma (33.8%, a difference of 2.4%), Puerto Rican (34.1%, a difference of 3.3%), Tohono O'odham (34.2%, a difference of 3.6%), and Navajo (31.7%, a difference of 4.3%).
| Demographics | Rating | Rank | Single Female Poverty |
| Ute | 0.0 /100 | #333 | Tragic 28.4% |
| Pueblo | 0.0 /100 | #334 | Tragic 28.6% |
| Immigrants | Yemen | 0.0 /100 | #335 | Tragic 28.9% |
| Colville | 0.0 /100 | #336 | Tragic 29.1% |
| Yuman | 0.0 /100 | #337 | Tragic 29.4% |
| Pima | 0.0 /100 | #338 | Tragic 30.3% |
| Cheyenne | 0.0 /100 | #339 | Tragic 30.4% |
| Cajuns | 0.0 /100 | #340 | Tragic 30.6% |
| Sioux | 0.0 /100 | #341 | Tragic 31.3% |
| Navajo | 0.0 /100 | #342 | Tragic 31.7% |
| Crow | 0.0 /100 | #343 | Tragic 32.4% |
| Lumbee | 0.0 /100 | #344 | Tragic 33.0% |
| Houma | 0.0 /100 | #345 | Tragic 33.8% |
| Puerto Ricans | 0.0 /100 | #346 | Tragic 34.1% |
| Tohono O'odham | 0.0 /100 | #347 | Tragic 34.2% |