Shoshone vs Lumbee Single Female Poverty
COMPARE
Shoshone
Lumbee
Single Female Poverty
Single Female Poverty Comparison
Shoshone
Lumbee
25.1%
SINGLE FEMALE POVERTY
0.0/ 100
METRIC RATING
302nd/ 347
METRIC RANK
33.0%
SINGLE FEMALE POVERTY
0.0/ 100
METRIC RATING
344th/ 347
METRIC RANK
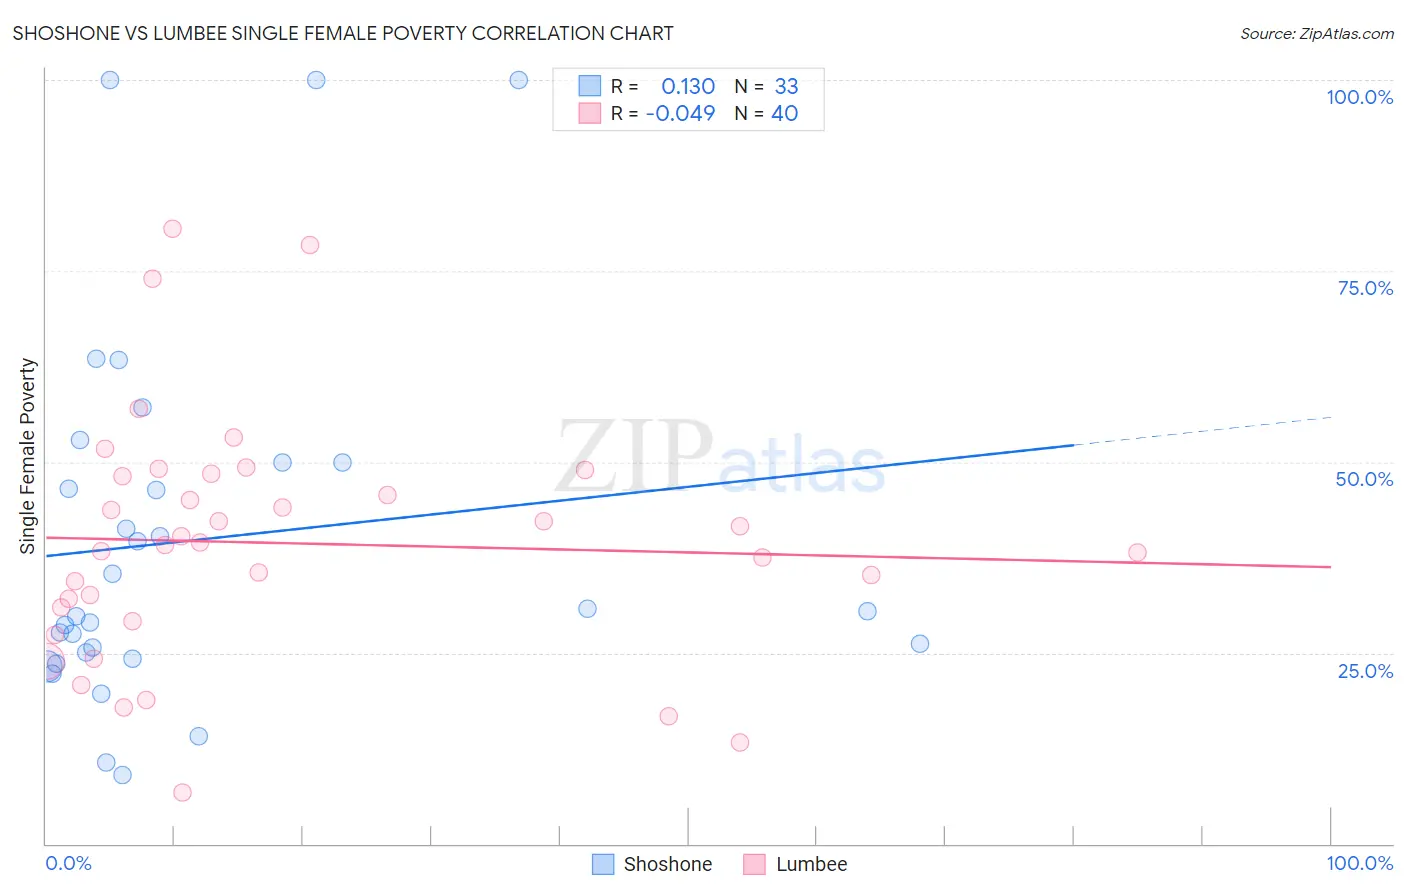
Shoshone vs Lumbee Single Female Poverty Correlation Chart
The statistical analysis conducted on geographies consisting of 66,449,019 people shows a poor positive correlation between the proportion of Shoshone and poverty level among single females in the United States with a correlation coefficient (R) of 0.130 and weighted average of 25.1%. Similarly, the statistical analysis conducted on geographies consisting of 91,816,335 people shows no correlation between the proportion of Lumbee and poverty level among single females in the United States with a correlation coefficient (R) of -0.049 and weighted average of 33.0%, a difference of 31.4%.
Single Female Poverty Correlation Summary
| Measurement | Shoshone | Lumbee |
| Minimum | 9.1% | 6.8% |
| Maximum | 100.0% | 80.6% |
| Range | 90.9% | 73.8% |
| Mean | 39.8% | 39.4% |
| Median | 30.4% | 39.3% |
| Interquartile 25% (IQ1) | 24.6% | 30.1% |
| Interquartile 75% (IQ3) | 50.0% | 48.3% |
| Interquartile Range (IQR) | 25.4% | 18.2% |
| Standard Deviation (Sample) | 23.8% | 16.1% |
| Standard Deviation (Population) | 23.4% | 15.9% |
Similar Demographics by Single Female Poverty
Demographics Similar to Shoshone by Single Female Poverty
In terms of single female poverty, the demographic groups most similar to Shoshone are Honduran (25.1%, a difference of 0.090%), Blackfeet (25.1%, a difference of 0.26%), Mexican (25.0%, a difference of 0.34%), Somali (25.2%, a difference of 0.40%), and Immigrants from Congo (25.3%, a difference of 0.66%).
| Demographics | Rating | Rank | Single Female Poverty |
| Hispanics or Latinos | 0.0 /100 | #295 | Tragic 24.6% |
| Africans | 0.0 /100 | #296 | Tragic 24.8% |
| Immigrants | Central America | 0.0 /100 | #297 | Tragic 24.8% |
| Yaqui | 0.0 /100 | #298 | Tragic 24.9% |
| Mexicans | 0.0 /100 | #299 | Tragic 25.0% |
| Blackfeet | 0.0 /100 | #300 | Tragic 25.1% |
| Hondurans | 0.0 /100 | #301 | Tragic 25.1% |
| Shoshone | 0.0 /100 | #302 | Tragic 25.1% |
| Somalis | 0.0 /100 | #303 | Tragic 25.2% |
| Immigrants | Congo | 0.0 /100 | #304 | Tragic 25.3% |
| Immigrants | Dominican Republic | 0.0 /100 | #305 | Tragic 25.3% |
| Immigrants | Mexico | 0.0 /100 | #306 | Tragic 25.3% |
| Potawatomi | 0.0 /100 | #307 | Tragic 25.4% |
| Aleuts | 0.0 /100 | #308 | Tragic 25.4% |
| Dominicans | 0.0 /100 | #309 | Tragic 25.4% |
Demographics Similar to Lumbee by Single Female Poverty
In terms of single female poverty, the demographic groups most similar to Lumbee are Crow (32.4%, a difference of 1.8%), Houma (33.8%, a difference of 2.4%), Puerto Rican (34.1%, a difference of 3.3%), Tohono O'odham (34.2%, a difference of 3.6%), and Navajo (31.7%, a difference of 4.3%).
| Demographics | Rating | Rank | Single Female Poverty |
| Ute | 0.0 /100 | #333 | Tragic 28.4% |
| Pueblo | 0.0 /100 | #334 | Tragic 28.6% |
| Immigrants | Yemen | 0.0 /100 | #335 | Tragic 28.9% |
| Colville | 0.0 /100 | #336 | Tragic 29.1% |
| Yuman | 0.0 /100 | #337 | Tragic 29.4% |
| Pima | 0.0 /100 | #338 | Tragic 30.3% |
| Cheyenne | 0.0 /100 | #339 | Tragic 30.4% |
| Cajuns | 0.0 /100 | #340 | Tragic 30.6% |
| Sioux | 0.0 /100 | #341 | Tragic 31.3% |
| Navajo | 0.0 /100 | #342 | Tragic 31.7% |
| Crow | 0.0 /100 | #343 | Tragic 32.4% |
| Lumbee | 0.0 /100 | #344 | Tragic 33.0% |
| Houma | 0.0 /100 | #345 | Tragic 33.8% |
| Puerto Ricans | 0.0 /100 | #346 | Tragic 34.1% |
| Tohono O'odham | 0.0 /100 | #347 | Tragic 34.2% |