Immigrants vs Lumbee Single Female Poverty
COMPARE
Immigrants
Lumbee
Single Female Poverty
Single Female Poverty Comparison
Immigrants
Lumbee
21.4%
SINGLE FEMALE POVERTY
22.0/ 100
METRIC RATING
199th/ 347
METRIC RANK
33.0%
SINGLE FEMALE POVERTY
0.0/ 100
METRIC RATING
344th/ 347
METRIC RANK
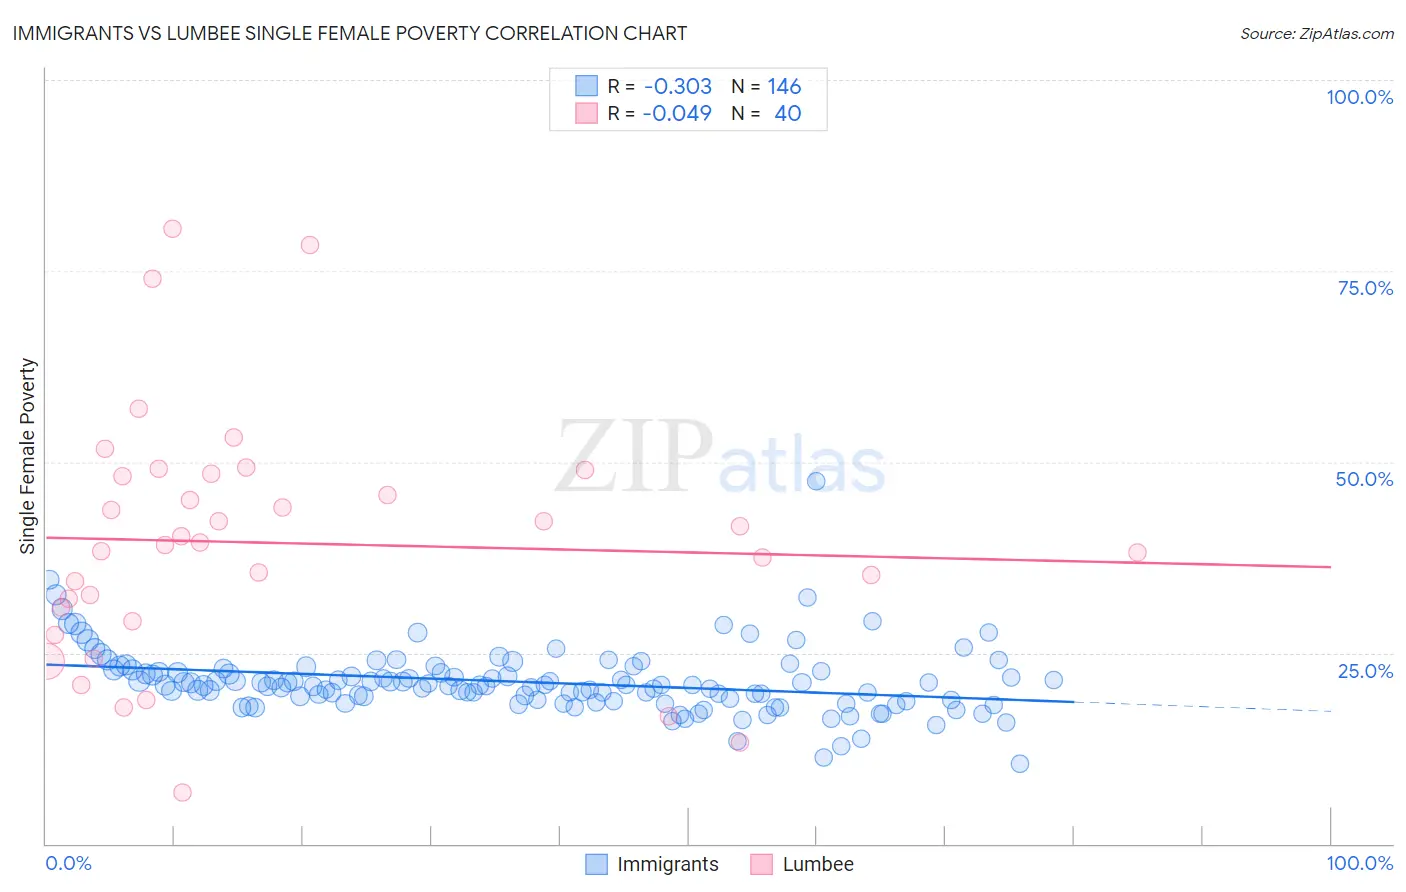
Immigrants vs Lumbee Single Female Poverty Correlation Chart
The statistical analysis conducted on geographies consisting of 556,808,964 people shows a mild negative correlation between the proportion of Immigrants and poverty level among single females in the United States with a correlation coefficient (R) of -0.303 and weighted average of 21.4%. Similarly, the statistical analysis conducted on geographies consisting of 91,816,335 people shows no correlation between the proportion of Lumbee and poverty level among single females in the United States with a correlation coefficient (R) of -0.049 and weighted average of 33.0%, a difference of 54.1%.
Single Female Poverty Correlation Summary
| Measurement | Immigrants | Lumbee |
| Minimum | 10.5% | 6.8% |
| Maximum | 47.5% | 80.6% |
| Range | 36.9% | 73.8% |
| Mean | 21.2% | 39.4% |
| Median | 20.7% | 39.3% |
| Interquartile 25% (IQ1) | 18.9% | 30.1% |
| Interquartile 75% (IQ3) | 22.6% | 48.3% |
| Interquartile Range (IQR) | 3.8% | 18.2% |
| Standard Deviation (Sample) | 4.4% | 16.1% |
| Standard Deviation (Population) | 4.4% | 15.9% |
Similar Demographics by Single Female Poverty
Demographics Similar to Immigrants by Single Female Poverty
In terms of single female poverty, the demographic groups most similar to Immigrants are Irish (21.4%, a difference of 0.050%), Nigerian (21.4%, a difference of 0.10%), Immigrants from Kenya (21.4%, a difference of 0.12%), Swiss (21.4%, a difference of 0.19%), and Immigrants from Haiti (21.5%, a difference of 0.30%).
| Demographics | Rating | Rank | Single Female Poverty |
| Immigrants | Jamaica | 30.5 /100 | #192 | Fair 21.3% |
| Basques | 28.1 /100 | #193 | Fair 21.3% |
| Czechoslovakians | 27.7 /100 | #194 | Fair 21.3% |
| Nicaraguans | 27.6 /100 | #195 | Fair 21.3% |
| Immigrants | Saudi Arabia | 27.1 /100 | #196 | Fair 21.3% |
| Japanese | 26.4 /100 | #197 | Fair 21.3% |
| Swiss | 24.2 /100 | #198 | Fair 21.4% |
| Immigrants | Immigrants | 22.0 /100 | #199 | Fair 21.4% |
| Irish | 21.4 /100 | #200 | Fair 21.4% |
| Nigerians | 20.9 /100 | #201 | Fair 21.4% |
| Immigrants | Kenya | 20.7 /100 | #202 | Fair 21.4% |
| Immigrants | Haiti | 18.8 /100 | #203 | Poor 21.5% |
| Immigrants | Africa | 16.7 /100 | #204 | Poor 21.5% |
| Finns | 16.2 /100 | #205 | Poor 21.5% |
| Belgians | 16.1 /100 | #206 | Poor 21.5% |
Demographics Similar to Lumbee by Single Female Poverty
In terms of single female poverty, the demographic groups most similar to Lumbee are Crow (32.4%, a difference of 1.8%), Houma (33.8%, a difference of 2.4%), Puerto Rican (34.1%, a difference of 3.3%), Tohono O'odham (34.2%, a difference of 3.6%), and Navajo (31.7%, a difference of 4.3%).
| Demographics | Rating | Rank | Single Female Poverty |
| Ute | 0.0 /100 | #333 | Tragic 28.4% |
| Pueblo | 0.0 /100 | #334 | Tragic 28.6% |
| Immigrants | Yemen | 0.0 /100 | #335 | Tragic 28.9% |
| Colville | 0.0 /100 | #336 | Tragic 29.1% |
| Yuman | 0.0 /100 | #337 | Tragic 29.4% |
| Pima | 0.0 /100 | #338 | Tragic 30.3% |
| Cheyenne | 0.0 /100 | #339 | Tragic 30.4% |
| Cajuns | 0.0 /100 | #340 | Tragic 30.6% |
| Sioux | 0.0 /100 | #341 | Tragic 31.3% |
| Navajo | 0.0 /100 | #342 | Tragic 31.7% |
| Crow | 0.0 /100 | #343 | Tragic 32.4% |
| Lumbee | 0.0 /100 | #344 | Tragic 33.0% |
| Houma | 0.0 /100 | #345 | Tragic 33.8% |
| Puerto Ricans | 0.0 /100 | #346 | Tragic 34.1% |
| Tohono O'odham | 0.0 /100 | #347 | Tragic 34.2% |