Chippewa vs Mexican Single Female Poverty
COMPARE
Chippewa
Mexican
Single Female Poverty
Single Female Poverty Comparison
Chippewa
Mexicans
26.8%
SINGLE FEMALE POVERTY
0.0/ 100
METRIC RATING
323rd/ 347
METRIC RANK
25.0%
SINGLE FEMALE POVERTY
0.0/ 100
METRIC RATING
299th/ 347
METRIC RANK
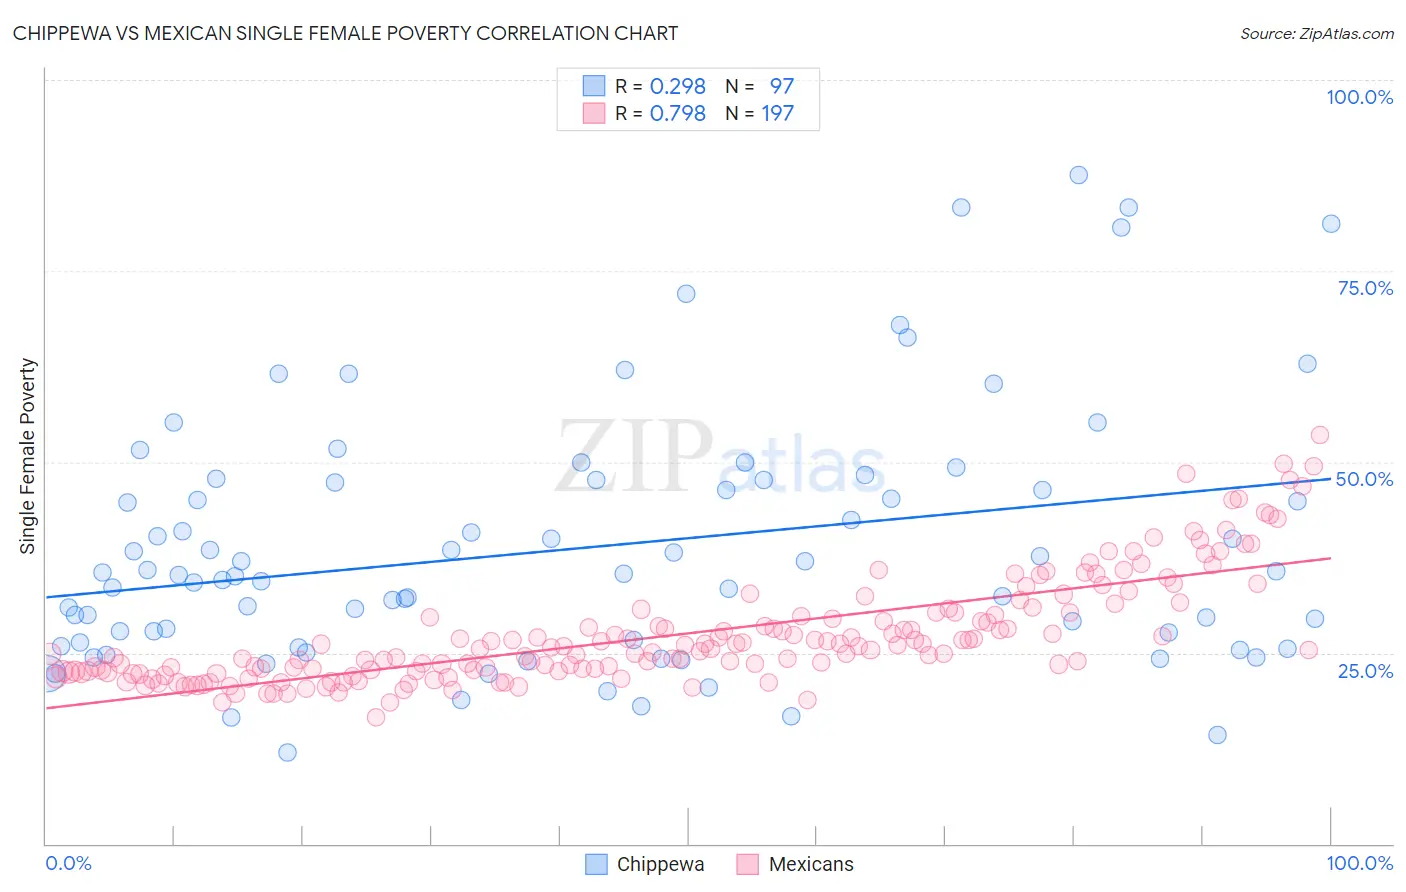
Chippewa vs Mexican Single Female Poverty Correlation Chart
The statistical analysis conducted on geographies consisting of 213,087,028 people shows a weak positive correlation between the proportion of Chippewa and poverty level among single females in the United States with a correlation coefficient (R) of 0.298 and weighted average of 26.8%. Similarly, the statistical analysis conducted on geographies consisting of 547,731,472 people shows a strong positive correlation between the proportion of Mexicans and poverty level among single females in the United States with a correlation coefficient (R) of 0.798 and weighted average of 25.0%, a difference of 7.1%.
Single Female Poverty Correlation Summary
| Measurement | Chippewa | Mexican |
| Minimum | 11.9% | 16.6% |
| Maximum | 87.6% | 53.5% |
| Range | 75.7% | 36.9% |
| Mean | 38.7% | 27.4% |
| Median | 35.2% | 25.5% |
| Interquartile 25% (IQ1) | 26.1% | 22.6% |
| Interquartile 75% (IQ3) | 47.5% | 30.1% |
| Interquartile Range (IQR) | 21.4% | 7.5% |
| Standard Deviation (Sample) | 16.5% | 7.0% |
| Standard Deviation (Population) | 16.4% | 7.0% |
Similar Demographics by Single Female Poverty
Demographics Similar to Chippewa by Single Female Poverty
In terms of single female poverty, the demographic groups most similar to Chippewa are Seminole (26.8%, a difference of 0.10%), Kiowa (26.9%, a difference of 0.41%), Yup'ik (26.6%, a difference of 0.84%), Choctaw (27.2%, a difference of 1.4%), and Arapaho (26.4%, a difference of 1.5%).
| Demographics | Rating | Rank | Single Female Poverty |
| Immigrants | Somalia | 0.0 /100 | #316 | Tragic 25.8% |
| Ottawa | 0.0 /100 | #317 | Tragic 26.0% |
| Chickasaw | 0.0 /100 | #318 | Tragic 26.3% |
| Blacks/African Americans | 0.0 /100 | #319 | Tragic 26.4% |
| Arapaho | 0.0 /100 | #320 | Tragic 26.4% |
| Yup'ik | 0.0 /100 | #321 | Tragic 26.6% |
| Seminole | 0.0 /100 | #322 | Tragic 26.8% |
| Chippewa | 0.0 /100 | #323 | Tragic 26.8% |
| Kiowa | 0.0 /100 | #324 | Tragic 26.9% |
| Choctaw | 0.0 /100 | #325 | Tragic 27.2% |
| Creek | 0.0 /100 | #326 | Tragic 27.4% |
| Dutch West Indians | 0.0 /100 | #327 | Tragic 27.5% |
| Apache | 0.0 /100 | #328 | Tragic 27.7% |
| Menominee | 0.0 /100 | #329 | Tragic 27.8% |
| Hopi | 0.0 /100 | #330 | Tragic 28.0% |
Demographics Similar to Mexicans by Single Female Poverty
In terms of single female poverty, the demographic groups most similar to Mexicans are Blackfeet (25.1%, a difference of 0.080%), Honduran (25.1%, a difference of 0.25%), Shoshone (25.1%, a difference of 0.34%), Yaqui (24.9%, a difference of 0.67%), and Somali (25.2%, a difference of 0.74%).
| Demographics | Rating | Rank | Single Female Poverty |
| Alsatians | 0.0 /100 | #292 | Tragic 24.5% |
| Americans | 0.0 /100 | #293 | Tragic 24.5% |
| French American Indians | 0.0 /100 | #294 | Tragic 24.6% |
| Hispanics or Latinos | 0.0 /100 | #295 | Tragic 24.6% |
| Africans | 0.0 /100 | #296 | Tragic 24.8% |
| Immigrants | Central America | 0.0 /100 | #297 | Tragic 24.8% |
| Yaqui | 0.0 /100 | #298 | Tragic 24.9% |
| Mexicans | 0.0 /100 | #299 | Tragic 25.0% |
| Blackfeet | 0.0 /100 | #300 | Tragic 25.1% |
| Hondurans | 0.0 /100 | #301 | Tragic 25.1% |
| Shoshone | 0.0 /100 | #302 | Tragic 25.1% |
| Somalis | 0.0 /100 | #303 | Tragic 25.2% |
| Immigrants | Congo | 0.0 /100 | #304 | Tragic 25.3% |
| Immigrants | Dominican Republic | 0.0 /100 | #305 | Tragic 25.3% |
| Immigrants | Mexico | 0.0 /100 | #306 | Tragic 25.3% |