Chippewa vs German Russian Single Female Poverty
COMPARE
Chippewa
German Russian
Single Female Poverty
Single Female Poverty Comparison
Chippewa
German Russians
26.8%
SINGLE FEMALE POVERTY
0.0/ 100
METRIC RATING
323rd/ 347
METRIC RANK
23.9%
SINGLE FEMALE POVERTY
0.0/ 100
METRIC RATING
283rd/ 347
METRIC RANK
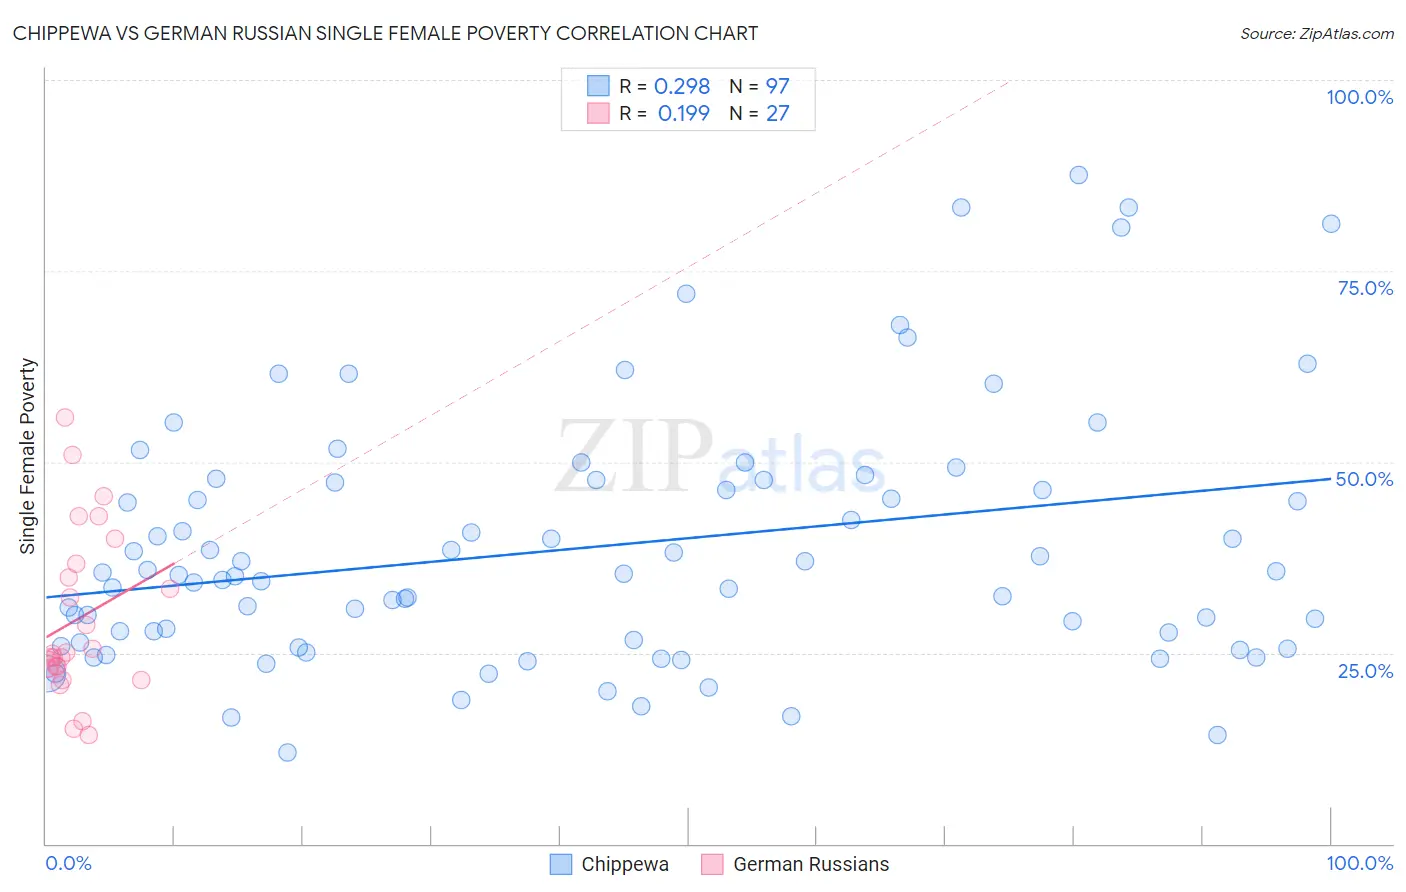
Chippewa vs German Russian Single Female Poverty Correlation Chart
The statistical analysis conducted on geographies consisting of 213,087,028 people shows a weak positive correlation between the proportion of Chippewa and poverty level among single females in the United States with a correlation coefficient (R) of 0.298 and weighted average of 26.8%. Similarly, the statistical analysis conducted on geographies consisting of 96,093,035 people shows a poor positive correlation between the proportion of German Russians and poverty level among single females in the United States with a correlation coefficient (R) of 0.199 and weighted average of 23.9%, a difference of 12.3%.
Single Female Poverty Correlation Summary
| Measurement | Chippewa | German Russian |
| Minimum | 11.9% | 14.3% |
| Maximum | 87.6% | 55.7% |
| Range | 75.7% | 41.4% |
| Mean | 38.7% | 29.4% |
| Median | 35.2% | 25.0% |
| Interquartile 25% (IQ1) | 26.1% | 22.9% |
| Interquartile 75% (IQ3) | 47.5% | 36.6% |
| Interquartile Range (IQR) | 21.4% | 13.7% |
| Standard Deviation (Sample) | 16.5% | 10.9% |
| Standard Deviation (Population) | 16.4% | 10.7% |
Similar Demographics by Single Female Poverty
Demographics Similar to Chippewa by Single Female Poverty
In terms of single female poverty, the demographic groups most similar to Chippewa are Seminole (26.8%, a difference of 0.10%), Kiowa (26.9%, a difference of 0.41%), Yup'ik (26.6%, a difference of 0.84%), Choctaw (27.2%, a difference of 1.4%), and Arapaho (26.4%, a difference of 1.5%).
| Demographics | Rating | Rank | Single Female Poverty |
| Immigrants | Somalia | 0.0 /100 | #316 | Tragic 25.8% |
| Ottawa | 0.0 /100 | #317 | Tragic 26.0% |
| Chickasaw | 0.0 /100 | #318 | Tragic 26.3% |
| Blacks/African Americans | 0.0 /100 | #319 | Tragic 26.4% |
| Arapaho | 0.0 /100 | #320 | Tragic 26.4% |
| Yup'ik | 0.0 /100 | #321 | Tragic 26.6% |
| Seminole | 0.0 /100 | #322 | Tragic 26.8% |
| Chippewa | 0.0 /100 | #323 | Tragic 26.8% |
| Kiowa | 0.0 /100 | #324 | Tragic 26.9% |
| Choctaw | 0.0 /100 | #325 | Tragic 27.2% |
| Creek | 0.0 /100 | #326 | Tragic 27.4% |
| Dutch West Indians | 0.0 /100 | #327 | Tragic 27.5% |
| Apache | 0.0 /100 | #328 | Tragic 27.7% |
| Menominee | 0.0 /100 | #329 | Tragic 27.8% |
| Hopi | 0.0 /100 | #330 | Tragic 28.0% |
Demographics Similar to German Russians by Single Female Poverty
In terms of single female poverty, the demographic groups most similar to German Russians are Immigrants from Dominica (23.9%, a difference of 0.11%), Guatemalan (23.8%, a difference of 0.14%), Immigrants from Zaire (23.8%, a difference of 0.20%), Immigrants from Latin America (23.7%, a difference of 0.71%), and Immigrants from Guatemala (24.1%, a difference of 0.97%).
| Demographics | Rating | Rank | Single Female Poverty |
| Immigrants | Azores | 0.0 /100 | #276 | Tragic 23.5% |
| Pennsylvania Germans | 0.0 /100 | #277 | Tragic 23.6% |
| Immigrants | Nonimmigrants | 0.0 /100 | #278 | Tragic 23.6% |
| Alaskan Athabascans | 0.0 /100 | #279 | Tragic 23.6% |
| Immigrants | Latin America | 0.0 /100 | #280 | Tragic 23.7% |
| Immigrants | Zaire | 0.0 /100 | #281 | Tragic 23.8% |
| Guatemalans | 0.0 /100 | #282 | Tragic 23.8% |
| German Russians | 0.0 /100 | #283 | Tragic 23.9% |
| Immigrants | Dominica | 0.0 /100 | #284 | Tragic 23.9% |
| Immigrants | Guatemala | 0.0 /100 | #285 | Tragic 24.1% |
| Cree | 0.0 /100 | #286 | Tragic 24.1% |
| Bangladeshis | 0.0 /100 | #287 | Tragic 24.2% |
| Spanish Americans | 0.0 /100 | #288 | Tragic 24.2% |
| U.S. Virgin Islanders | 0.0 /100 | #289 | Tragic 24.2% |
| Indonesians | 0.0 /100 | #290 | Tragic 24.3% |