Immigrants from Eastern Europe vs Lumbee Single Female Poverty
COMPARE
Immigrants from Eastern Europe
Lumbee
Single Female Poverty
Single Female Poverty Comparison
Immigrants from Eastern Europe
Lumbee
19.0%
SINGLE FEMALE POVERTY
99.8/ 100
METRIC RATING
50th/ 347
METRIC RANK
33.0%
SINGLE FEMALE POVERTY
0.0/ 100
METRIC RATING
344th/ 347
METRIC RANK
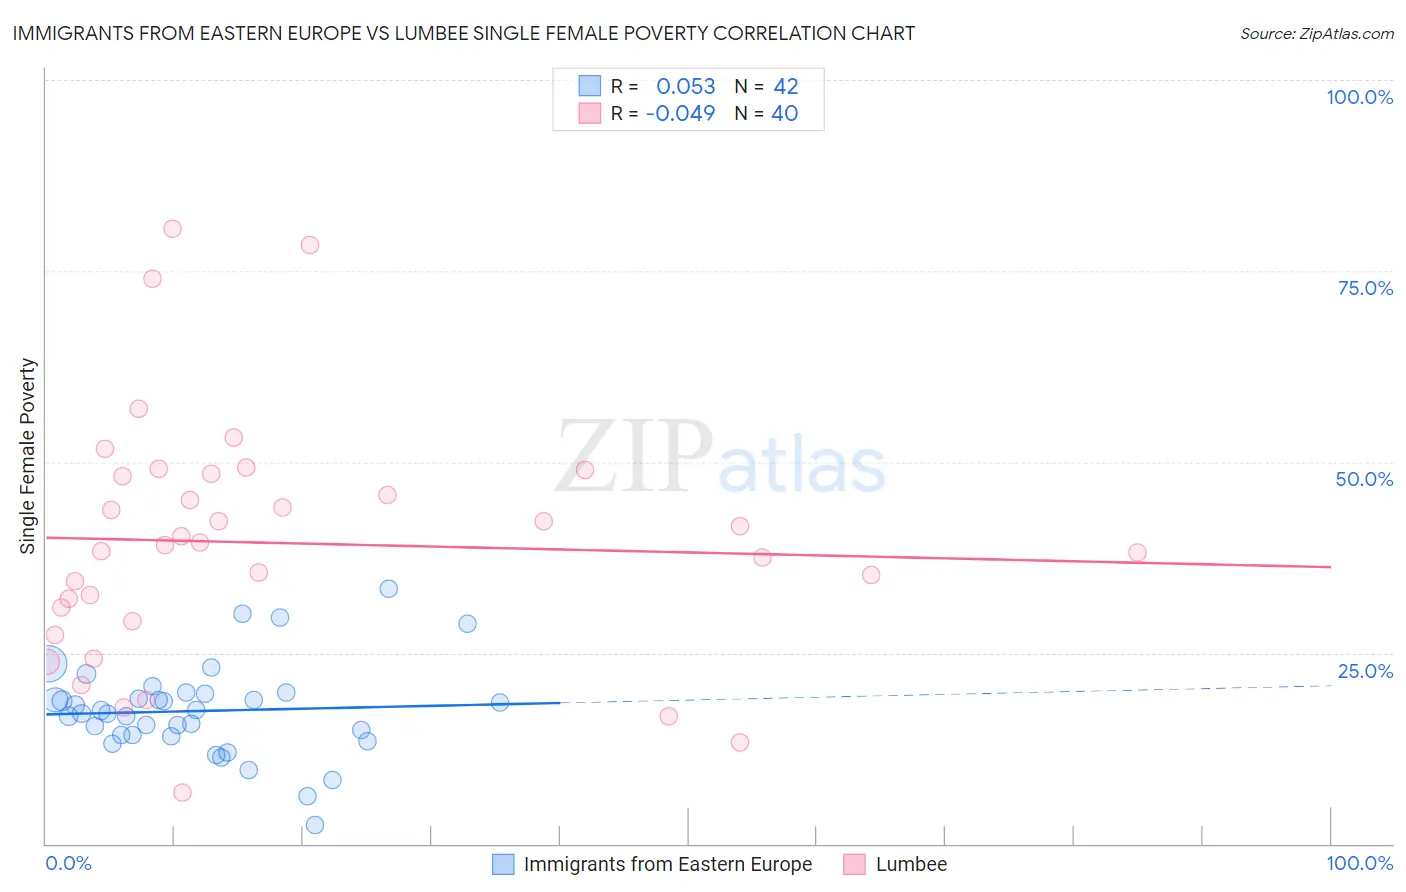
Immigrants from Eastern Europe vs Lumbee Single Female Poverty Correlation Chart
The statistical analysis conducted on geographies consisting of 464,074,222 people shows a slight positive correlation between the proportion of Immigrants from Eastern Europe and poverty level among single females in the United States with a correlation coefficient (R) of 0.053 and weighted average of 19.0%. Similarly, the statistical analysis conducted on geographies consisting of 91,816,335 people shows no correlation between the proportion of Lumbee and poverty level among single females in the United States with a correlation coefficient (R) of -0.049 and weighted average of 33.0%, a difference of 73.3%.
Single Female Poverty Correlation Summary
| Measurement | Immigrants from Eastern Europe | Lumbee |
| Minimum | 2.5% | 6.8% |
| Maximum | 33.4% | 80.6% |
| Range | 30.9% | 73.8% |
| Mean | 17.4% | 39.4% |
| Median | 17.3% | 39.3% |
| Interquartile 25% (IQ1) | 14.2% | 30.1% |
| Interquartile 75% (IQ3) | 19.7% | 48.3% |
| Interquartile Range (IQR) | 5.5% | 18.2% |
| Standard Deviation (Sample) | 6.1% | 16.1% |
| Standard Deviation (Population) | 6.0% | 15.9% |
Similar Demographics by Single Female Poverty
Demographics Similar to Immigrants from Eastern Europe by Single Female Poverty
In terms of single female poverty, the demographic groups most similar to Immigrants from Eastern Europe are Immigrants from Czechoslovakia (19.0%, a difference of 0.040%), Immigrants from Italy (19.0%, a difference of 0.040%), Immigrants from Argentina (19.0%, a difference of 0.050%), Egyptian (19.1%, a difference of 0.080%), and Tsimshian (19.1%, a difference of 0.29%).
| Demographics | Rating | Rank | Single Female Poverty |
| Immigrants | Romania | 99.9 /100 | #43 | Exceptional 18.8% |
| Immigrants | Croatia | 99.9 /100 | #44 | Exceptional 18.9% |
| Immigrants | Indonesia | 99.8 /100 | #45 | Exceptional 18.9% |
| Macedonians | 99.8 /100 | #46 | Exceptional 18.9% |
| Latvians | 99.8 /100 | #47 | Exceptional 19.0% |
| Immigrants | Argentina | 99.8 /100 | #48 | Exceptional 19.0% |
| Immigrants | Czechoslovakia | 99.8 /100 | #49 | Exceptional 19.0% |
| Immigrants | Eastern Europe | 99.8 /100 | #50 | Exceptional 19.0% |
| Immigrants | Italy | 99.8 /100 | #51 | Exceptional 19.0% |
| Egyptians | 99.7 /100 | #52 | Exceptional 19.1% |
| Tsimshian | 99.7 /100 | #53 | Exceptional 19.1% |
| Argentineans | 99.7 /100 | #54 | Exceptional 19.1% |
| Immigrants | Vietnam | 99.7 /100 | #55 | Exceptional 19.1% |
| Immigrants | Fiji | 99.7 /100 | #56 | Exceptional 19.1% |
| Eastern Europeans | 99.7 /100 | #57 | Exceptional 19.1% |
Demographics Similar to Lumbee by Single Female Poverty
In terms of single female poverty, the demographic groups most similar to Lumbee are Crow (32.4%, a difference of 1.8%), Houma (33.8%, a difference of 2.4%), Puerto Rican (34.1%, a difference of 3.3%), Tohono O'odham (34.2%, a difference of 3.6%), and Navajo (31.7%, a difference of 4.3%).
| Demographics | Rating | Rank | Single Female Poverty |
| Ute | 0.0 /100 | #333 | Tragic 28.4% |
| Pueblo | 0.0 /100 | #334 | Tragic 28.6% |
| Immigrants | Yemen | 0.0 /100 | #335 | Tragic 28.9% |
| Colville | 0.0 /100 | #336 | Tragic 29.1% |
| Yuman | 0.0 /100 | #337 | Tragic 29.4% |
| Pima | 0.0 /100 | #338 | Tragic 30.3% |
| Cheyenne | 0.0 /100 | #339 | Tragic 30.4% |
| Cajuns | 0.0 /100 | #340 | Tragic 30.6% |
| Sioux | 0.0 /100 | #341 | Tragic 31.3% |
| Navajo | 0.0 /100 | #342 | Tragic 31.7% |
| Crow | 0.0 /100 | #343 | Tragic 32.4% |
| Lumbee | 0.0 /100 | #344 | Tragic 33.0% |
| Houma | 0.0 /100 | #345 | Tragic 33.8% |
| Puerto Ricans | 0.0 /100 | #346 | Tragic 34.1% |
| Tohono O'odham | 0.0 /100 | #347 | Tragic 34.2% |