Chippewa vs Immigrants from Moldova Single Female Poverty
COMPARE
Chippewa
Immigrants from Moldova
Single Female Poverty
Single Female Poverty Comparison
Chippewa
Immigrants from Moldova
26.8%
SINGLE FEMALE POVERTY
0.0/ 100
METRIC RATING
323rd/ 347
METRIC RANK
18.5%
SINGLE FEMALE POVERTY
100.0/ 100
METRIC RATING
28th/ 347
METRIC RANK
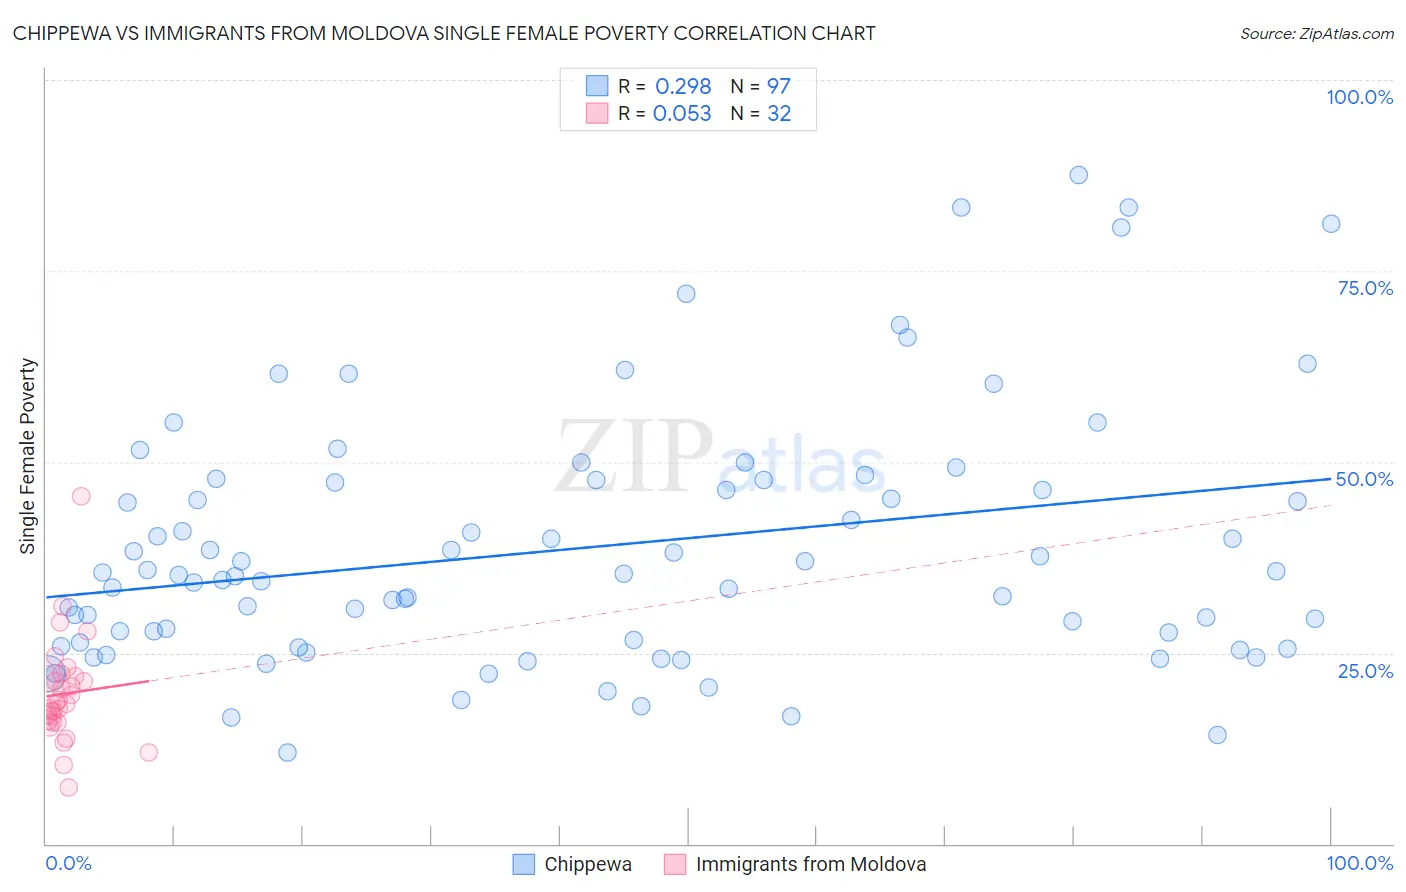
Chippewa vs Immigrants from Moldova Single Female Poverty Correlation Chart
The statistical analysis conducted on geographies consisting of 213,087,028 people shows a weak positive correlation between the proportion of Chippewa and poverty level among single females in the United States with a correlation coefficient (R) of 0.298 and weighted average of 26.8%. Similarly, the statistical analysis conducted on geographies consisting of 123,598,382 people shows a slight positive correlation between the proportion of Immigrants from Moldova and poverty level among single females in the United States with a correlation coefficient (R) of 0.053 and weighted average of 18.5%, a difference of 45.0%.
Single Female Poverty Correlation Summary
| Measurement | Chippewa | Immigrants from Moldova |
| Minimum | 11.9% | 7.4% |
| Maximum | 87.6% | 45.5% |
| Range | 75.7% | 38.2% |
| Mean | 38.7% | 19.6% |
| Median | 35.2% | 18.4% |
| Interquartile 25% (IQ1) | 26.1% | 16.0% |
| Interquartile 75% (IQ3) | 47.5% | 21.8% |
| Interquartile Range (IQR) | 21.4% | 5.7% |
| Standard Deviation (Sample) | 16.5% | 6.9% |
| Standard Deviation (Population) | 16.4% | 6.8% |
Similar Demographics by Single Female Poverty
Demographics Similar to Chippewa by Single Female Poverty
In terms of single female poverty, the demographic groups most similar to Chippewa are Seminole (26.8%, a difference of 0.10%), Kiowa (26.9%, a difference of 0.41%), Yup'ik (26.6%, a difference of 0.84%), Choctaw (27.2%, a difference of 1.4%), and Arapaho (26.4%, a difference of 1.5%).
| Demographics | Rating | Rank | Single Female Poverty |
| Immigrants | Somalia | 0.0 /100 | #316 | Tragic 25.8% |
| Ottawa | 0.0 /100 | #317 | Tragic 26.0% |
| Chickasaw | 0.0 /100 | #318 | Tragic 26.3% |
| Blacks/African Americans | 0.0 /100 | #319 | Tragic 26.4% |
| Arapaho | 0.0 /100 | #320 | Tragic 26.4% |
| Yup'ik | 0.0 /100 | #321 | Tragic 26.6% |
| Seminole | 0.0 /100 | #322 | Tragic 26.8% |
| Chippewa | 0.0 /100 | #323 | Tragic 26.8% |
| Kiowa | 0.0 /100 | #324 | Tragic 26.9% |
| Choctaw | 0.0 /100 | #325 | Tragic 27.2% |
| Creek | 0.0 /100 | #326 | Tragic 27.4% |
| Dutch West Indians | 0.0 /100 | #327 | Tragic 27.5% |
| Apache | 0.0 /100 | #328 | Tragic 27.7% |
| Menominee | 0.0 /100 | #329 | Tragic 27.8% |
| Hopi | 0.0 /100 | #330 | Tragic 28.0% |
Demographics Similar to Immigrants from Moldova by Single Female Poverty
In terms of single female poverty, the demographic groups most similar to Immigrants from Moldova are Immigrants from Poland (18.5%, a difference of 0.10%), Immigrants from North Macedonia (18.5%, a difference of 0.26%), Immigrants from Asia (18.6%, a difference of 0.31%), Immigrants from Sri Lanka (18.6%, a difference of 0.39%), and Immigrants from Philippines (18.6%, a difference of 0.46%).
| Demographics | Rating | Rank | Single Female Poverty |
| Maltese | 100.0 /100 | #21 | Exceptional 18.3% |
| Burmese | 100.0 /100 | #22 | Exceptional 18.3% |
| Asians | 100.0 /100 | #23 | Exceptional 18.3% |
| Armenians | 100.0 /100 | #24 | Exceptional 18.3% |
| Immigrants | Singapore | 100.0 /100 | #25 | Exceptional 18.3% |
| Immigrants | Israel | 100.0 /100 | #26 | Exceptional 18.3% |
| Immigrants | Pakistan | 100.0 /100 | #27 | Exceptional 18.4% |
| Immigrants | Moldova | 100.0 /100 | #28 | Exceptional 18.5% |
| Immigrants | Poland | 100.0 /100 | #29 | Exceptional 18.5% |
| Immigrants | North Macedonia | 99.9 /100 | #30 | Exceptional 18.5% |
| Immigrants | Asia | 99.9 /100 | #31 | Exceptional 18.6% |
| Immigrants | Sri Lanka | 99.9 /100 | #32 | Exceptional 18.6% |
| Immigrants | Philippines | 99.9 /100 | #33 | Exceptional 18.6% |
| Koreans | 99.9 /100 | #34 | Exceptional 18.6% |
| Immigrants | Japan | 99.9 /100 | #35 | Exceptional 18.6% |