Immigrants from Cameroon vs Immigrants from Ireland Single Female Poverty
COMPARE
Immigrants from Cameroon
Immigrants from Ireland
Single Female Poverty
Single Female Poverty Comparison
Immigrants from Cameroon
Immigrants from Ireland
19.8%
SINGLE FEMALE POVERTY
97.3/ 100
METRIC RATING
102nd/ 347
METRIC RANK
17.8%
SINGLE FEMALE POVERTY
100.0/ 100
METRIC RATING
10th/ 347
METRIC RANK
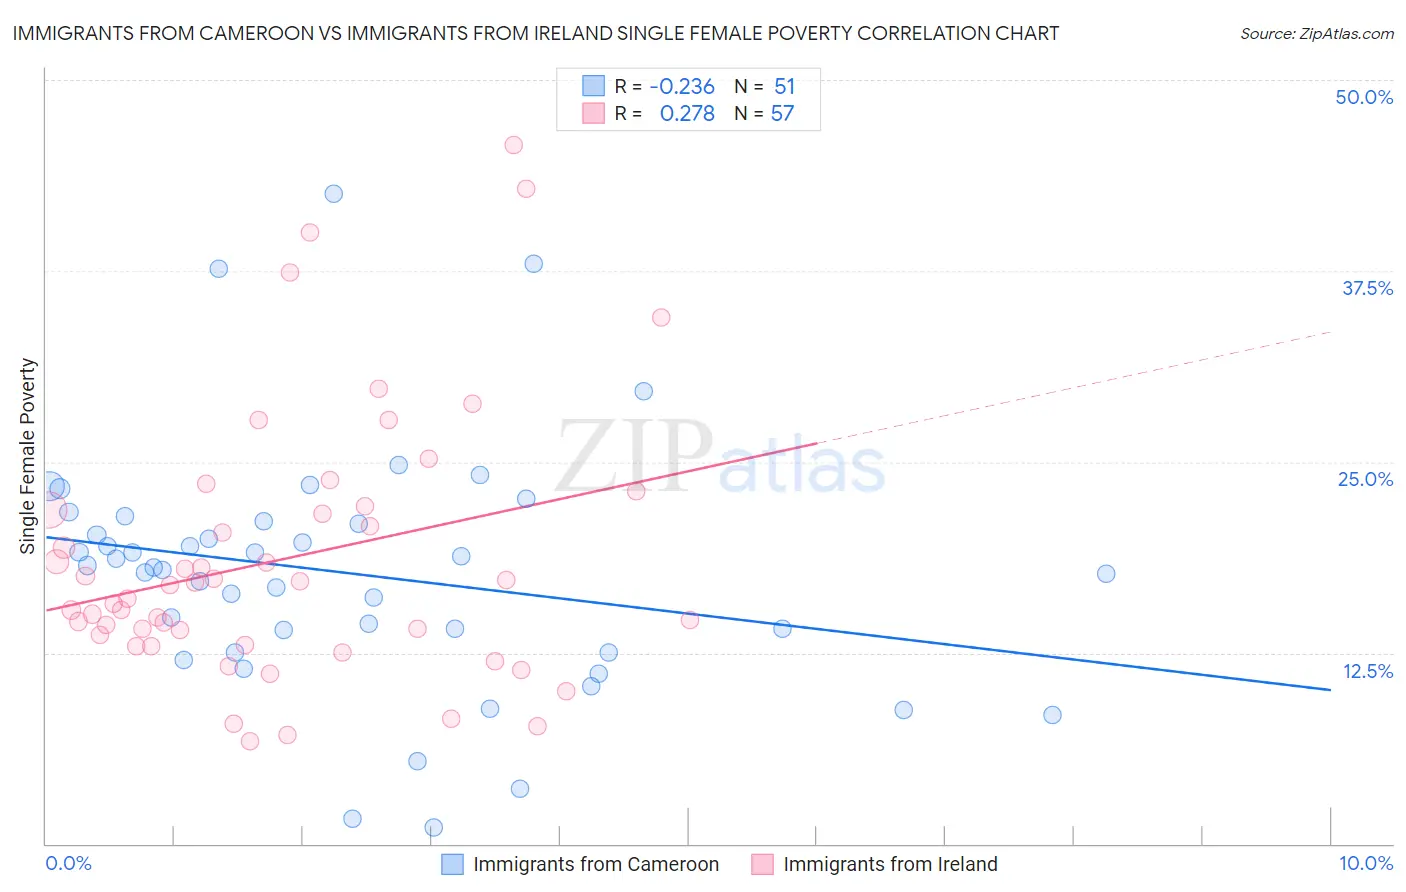
Immigrants from Cameroon vs Immigrants from Ireland Single Female Poverty Correlation Chart
The statistical analysis conducted on geographies consisting of 130,300,683 people shows a weak negative correlation between the proportion of Immigrants from Cameroon and poverty level among single females in the United States with a correlation coefficient (R) of -0.236 and weighted average of 19.8%. Similarly, the statistical analysis conducted on geographies consisting of 237,318,290 people shows a weak positive correlation between the proportion of Immigrants from Ireland and poverty level among single females in the United States with a correlation coefficient (R) of 0.278 and weighted average of 17.8%, a difference of 11.6%.
Single Female Poverty Correlation Summary
| Measurement | Immigrants from Cameroon | Immigrants from Ireland |
| Minimum | 1.1% | 6.7% |
| Maximum | 42.6% | 45.8% |
| Range | 41.5% | 39.1% |
| Mean | 17.7% | 18.7% |
| Median | 18.1% | 17.0% |
| Interquartile 25% (IQ1) | 12.5% | 13.4% |
| Interquartile 75% (IQ3) | 21.1% | 22.0% |
| Interquartile Range (IQR) | 8.5% | 8.6% |
| Standard Deviation (Sample) | 8.1% | 8.7% |
| Standard Deviation (Population) | 8.0% | 8.6% |
Similar Demographics by Single Female Poverty
Demographics Similar to Immigrants from Cameroon by Single Female Poverty
In terms of single female poverty, the demographic groups most similar to Immigrants from Cameroon are Immigrants from Belgium (19.8%, a difference of 0.010%), Immigrants from Southern Europe (19.9%, a difference of 0.12%), Ukrainian (19.8%, a difference of 0.19%), Chilean (19.9%, a difference of 0.24%), and Israeli (19.9%, a difference of 0.25%).
| Demographics | Rating | Rank | Single Female Poverty |
| Estonians | 98.2 /100 | #95 | Exceptional 19.7% |
| Immigrants | Brazil | 98.2 /100 | #96 | Exceptional 19.7% |
| Croatians | 98.1 /100 | #97 | Exceptional 19.7% |
| Immigrants | France | 97.9 /100 | #98 | Exceptional 19.7% |
| Sierra Leoneans | 97.9 /100 | #99 | Exceptional 19.7% |
| Ukrainians | 97.6 /100 | #100 | Exceptional 19.8% |
| Immigrants | Belgium | 97.3 /100 | #101 | Exceptional 19.8% |
| Immigrants | Cameroon | 97.3 /100 | #102 | Exceptional 19.8% |
| Immigrants | Southern Europe | 97.1 /100 | #103 | Exceptional 19.9% |
| Chileans | 96.9 /100 | #104 | Exceptional 19.9% |
| Israelis | 96.9 /100 | #105 | Exceptional 19.9% |
| Ethiopians | 96.7 /100 | #106 | Exceptional 19.9% |
| Immigrants | Syria | 96.7 /100 | #107 | Exceptional 19.9% |
| Native Hawaiians | 96.6 /100 | #108 | Exceptional 19.9% |
| Colombians | 96.6 /100 | #109 | Exceptional 19.9% |
Demographics Similar to Immigrants from Ireland by Single Female Poverty
In terms of single female poverty, the demographic groups most similar to Immigrants from Ireland are Immigrants from Lithuania (17.8%, a difference of 0.090%), Immigrants from South Central Asia (17.8%, a difference of 0.15%), Bhutanese (17.7%, a difference of 0.41%), Immigrants from Bolivia (17.8%, a difference of 0.41%), and Bolivian (17.9%, a difference of 0.85%).
| Demographics | Rating | Rank | Single Female Poverty |
| Immigrants | Hong Kong | 100.0 /100 | #3 | Exceptional 16.5% |
| Immigrants | India | 100.0 /100 | #4 | Exceptional 16.8% |
| Assyrians/Chaldeans/Syriacs | 100.0 /100 | #5 | Exceptional 17.0% |
| Filipinos | 100.0 /100 | #6 | Exceptional 17.0% |
| Thais | 100.0 /100 | #7 | Exceptional 17.3% |
| Immigrants | Iran | 100.0 /100 | #8 | Exceptional 17.5% |
| Bhutanese | 100.0 /100 | #9 | Exceptional 17.7% |
| Immigrants | Ireland | 100.0 /100 | #10 | Exceptional 17.8% |
| Immigrants | Lithuania | 100.0 /100 | #11 | Exceptional 17.8% |
| Immigrants | South Central Asia | 100.0 /100 | #12 | Exceptional 17.8% |
| Immigrants | Bolivia | 100.0 /100 | #13 | Exceptional 17.8% |
| Bolivians | 100.0 /100 | #14 | Exceptional 17.9% |
| Indians (Asian) | 100.0 /100 | #15 | Exceptional 17.9% |
| Iranians | 100.0 /100 | #16 | Exceptional 18.0% |
| Immigrants | Korea | 100.0 /100 | #17 | Exceptional 18.1% |