Chickasaw vs Immigrants from Dominican Republic Median Male Earnings
COMPARE
Chickasaw
Immigrants from Dominican Republic
Median Male Earnings
Median Male Earnings Comparison
Chickasaw
Immigrants from Dominican Republic
$47,832
MEDIAN MALE EARNINGS
0.1/ 100
METRIC RATING
289th/ 347
METRIC RANK
$46,655
MEDIAN MALE EARNINGS
0.0/ 100
METRIC RATING
307th/ 347
METRIC RANK
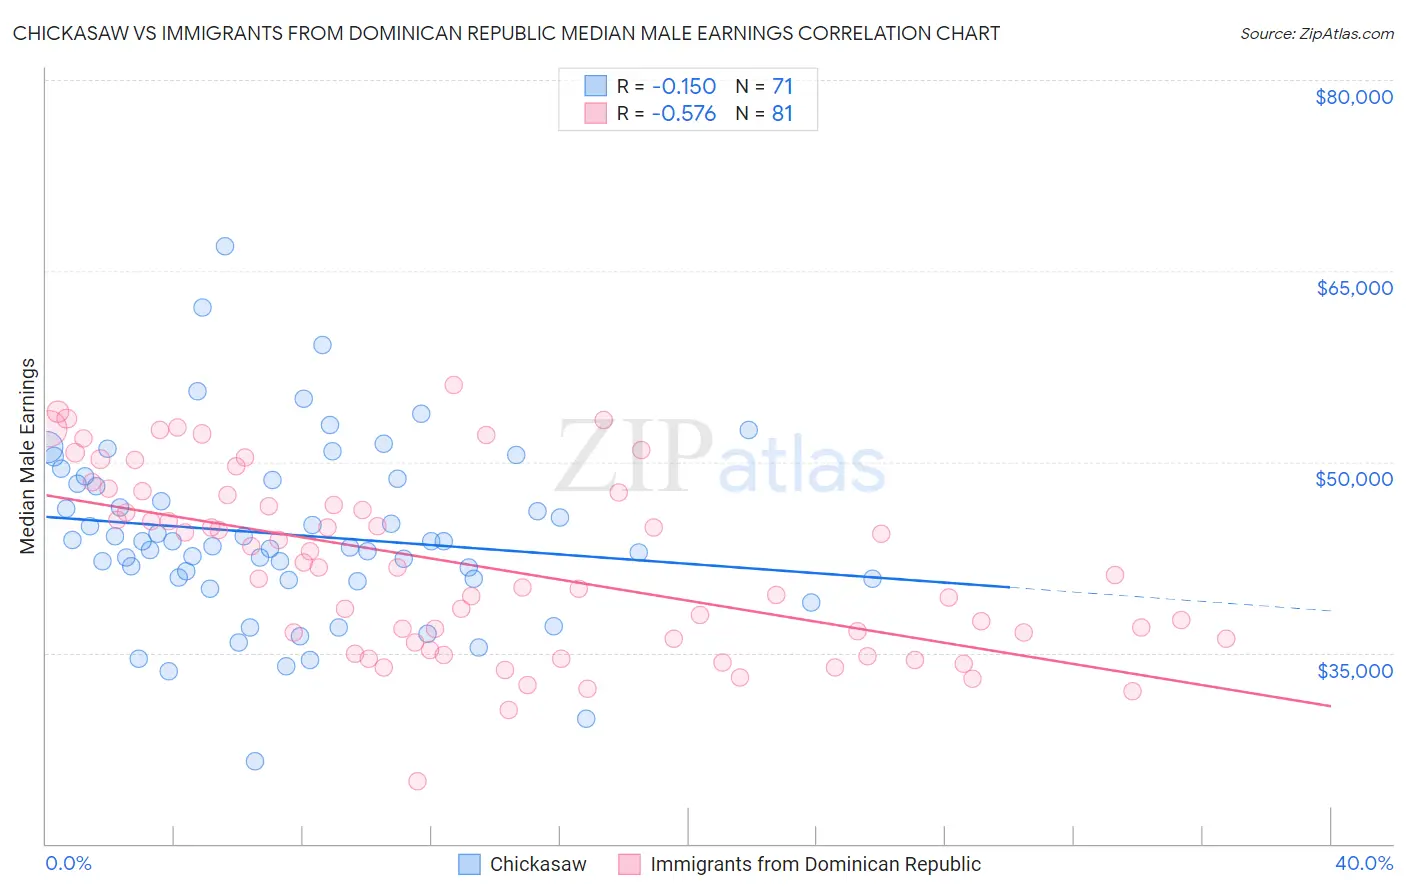
Chickasaw vs Immigrants from Dominican Republic Median Male Earnings Correlation Chart
The statistical analysis conducted on geographies consisting of 147,698,566 people shows a poor negative correlation between the proportion of Chickasaw and median male earnings in the United States with a correlation coefficient (R) of -0.150 and weighted average of $47,832. Similarly, the statistical analysis conducted on geographies consisting of 274,998,271 people shows a substantial negative correlation between the proportion of Immigrants from Dominican Republic and median male earnings in the United States with a correlation coefficient (R) of -0.576 and weighted average of $46,655, a difference of 2.5%.
Median Male Earnings Correlation Summary
| Measurement | Chickasaw | Immigrants from Dominican Republic |
| Minimum | $26,528 | $24,931 |
| Maximum | $66,918 | $56,014 |
| Range | $40,390 | $31,083 |
| Mean | $44,260 | $41,875 |
| Median | $43,730 | $41,710 |
| Interquartile 25% (IQ1) | $40,813 | $35,983 |
| Interquartile 75% (IQ3) | $48,579 | $47,499 |
| Interquartile Range (IQR) | $7,766 | $11,516 |
| Standard Deviation (Sample) | $7,030 | $7,016 |
| Standard Deviation (Population) | $6,980 | $6,972 |
Demographics Similar to Chickasaw and Immigrants from Dominican Republic by Median Male Earnings
In terms of median male earnings, the demographic groups most similar to Chickasaw are Immigrants from Belize ($47,809, a difference of 0.050%), Shoshone ($47,930, a difference of 0.21%), Choctaw ($47,729, a difference of 0.22%), Immigrants from Dominica ($47,651, a difference of 0.38%), and Indonesian ($47,503, a difference of 0.69%). Similarly, the demographic groups most similar to Immigrants from Dominican Republic are Dutch West Indian ($46,656, a difference of 0.0%), Ottawa ($46,611, a difference of 0.090%), Guatemalan ($46,736, a difference of 0.17%), Bangladeshi ($46,744, a difference of 0.19%), and Yaqui ($46,777, a difference of 0.26%).
| Demographics | Rating | Rank | Median Male Earnings |
| Shoshone | 0.2 /100 | #288 | Tragic $47,930 |
| Chickasaw | 0.1 /100 | #289 | Tragic $47,832 |
| Immigrants | Belize | 0.1 /100 | #290 | Tragic $47,809 |
| Choctaw | 0.1 /100 | #291 | Tragic $47,729 |
| Immigrants | Dominica | 0.1 /100 | #292 | Tragic $47,651 |
| Indonesians | 0.1 /100 | #293 | Tragic $47,503 |
| Immigrants | Nicaragua | 0.1 /100 | #294 | Tragic $47,482 |
| Central American Indians | 0.1 /100 | #295 | Tragic $47,433 |
| Inupiat | 0.1 /100 | #296 | Tragic $47,281 |
| Dominicans | 0.1 /100 | #297 | Tragic $47,204 |
| Immigrants | Micronesia | 0.1 /100 | #298 | Tragic $47,177 |
| Immigrants | Zaire | 0.1 /100 | #299 | Tragic $47,070 |
| U.S. Virgin Islanders | 0.1 /100 | #300 | Tragic $47,066 |
| Immigrants | Latin America | 0.1 /100 | #301 | Tragic $46,941 |
| Seminole | 0.1 /100 | #302 | Tragic $46,783 |
| Yaqui | 0.1 /100 | #303 | Tragic $46,777 |
| Bangladeshis | 0.1 /100 | #304 | Tragic $46,744 |
| Guatemalans | 0.0 /100 | #305 | Tragic $46,736 |
| Dutch West Indians | 0.0 /100 | #306 | Tragic $46,656 |
| Immigrants | Dominican Republic | 0.0 /100 | #307 | Tragic $46,655 |
| Ottawa | 0.0 /100 | #308 | Tragic $46,611 |