Immigrants from Canada vs Immigrants from Dominican Republic Single Female Poverty
COMPARE
Immigrants from Canada
Immigrants from Dominican Republic
Single Female Poverty
Single Female Poverty Comparison
Immigrants from Canada
Immigrants from Dominican Republic
20.2%
SINGLE FEMALE POVERTY
91.2/ 100
METRIC RATING
136th/ 347
METRIC RANK
25.3%
SINGLE FEMALE POVERTY
0.0/ 100
METRIC RATING
305th/ 347
METRIC RANK
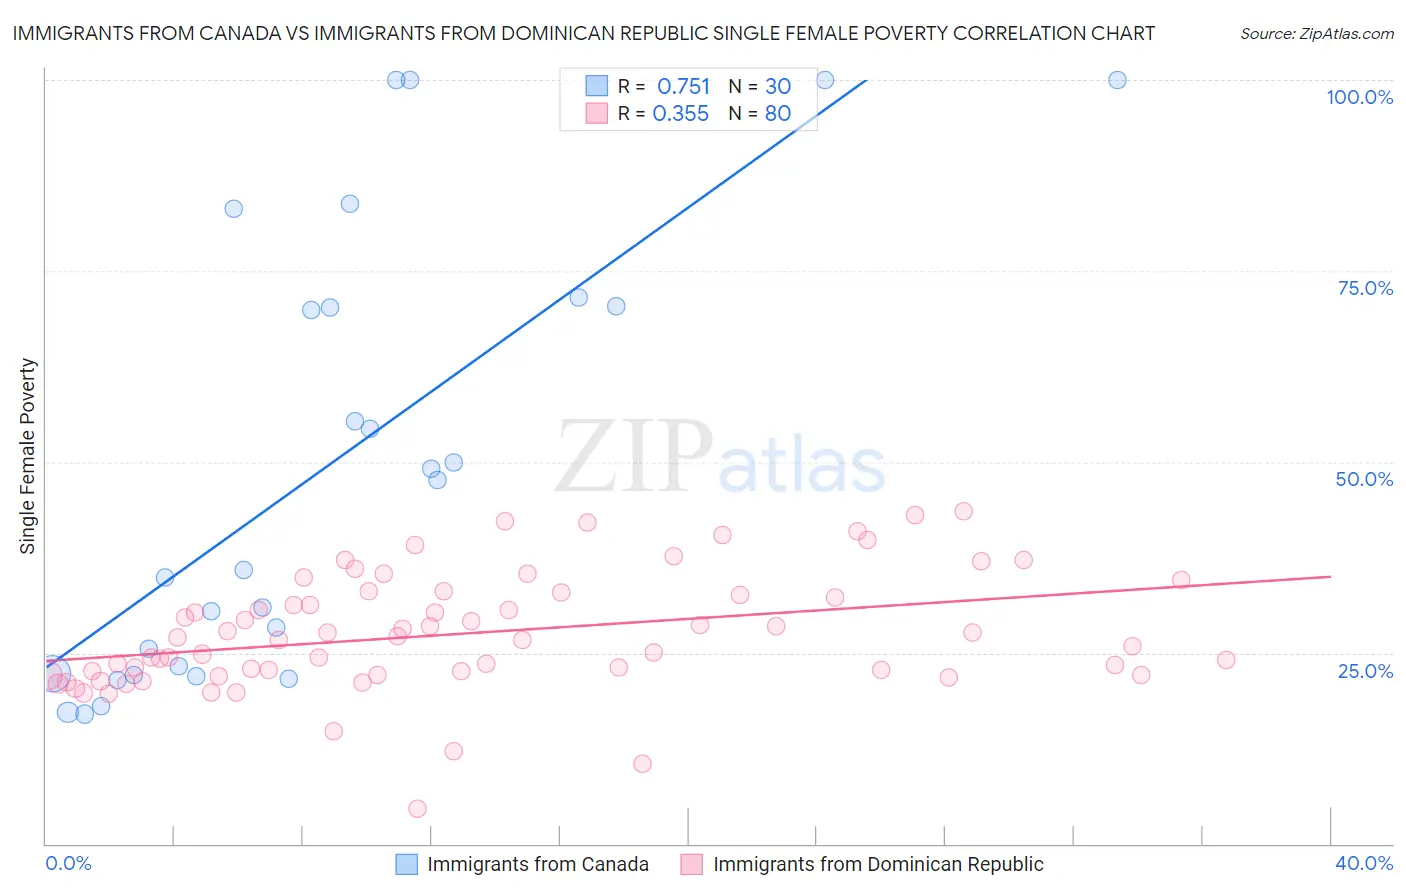
Immigrants from Canada vs Immigrants from Dominican Republic Single Female Poverty Correlation Chart
The statistical analysis conducted on geographies consisting of 448,621,148 people shows a strong positive correlation between the proportion of Immigrants from Canada and poverty level among single females in the United States with a correlation coefficient (R) of 0.751 and weighted average of 20.2%. Similarly, the statistical analysis conducted on geographies consisting of 271,687,011 people shows a mild positive correlation between the proportion of Immigrants from Dominican Republic and poverty level among single females in the United States with a correlation coefficient (R) of 0.355 and weighted average of 25.3%, a difference of 24.9%.
Single Female Poverty Correlation Summary
| Measurement | Immigrants from Canada | Immigrants from Dominican Republic |
| Minimum | 17.0% | 4.6% |
| Maximum | 100.0% | 43.6% |
| Range | 83.0% | 39.0% |
| Mean | 49.2% | 27.5% |
| Median | 41.8% | 26.9% |
| Interquartile 25% (IQ1) | 22.2% | 22.4% |
| Interquartile 75% (IQ3) | 70.4% | 32.7% |
| Interquartile Range (IQR) | 48.2% | 10.3% |
| Standard Deviation (Sample) | 28.8% | 7.7% |
| Standard Deviation (Population) | 28.3% | 7.6% |
Similar Demographics by Single Female Poverty
Demographics Similar to Immigrants from Canada by Single Female Poverty
In terms of single female poverty, the demographic groups most similar to Immigrants from Canada are Immigrants from Iraq (20.2%, a difference of 0.010%), Immigrants from Venezuela (20.2%, a difference of 0.060%), Immigrants from Nepal (20.3%, a difference of 0.11%), Slovene (20.3%, a difference of 0.14%), and Immigrants from England (20.2%, a difference of 0.15%).
| Demographics | Rating | Rank | Single Female Poverty |
| Immigrants | Morocco | 92.4 /100 | #129 | Exceptional 20.2% |
| Immigrants | Hungary | 92.3 /100 | #130 | Exceptional 20.2% |
| Pakistanis | 92.1 /100 | #131 | Exceptional 20.2% |
| Uruguayans | 92.1 /100 | #132 | Exceptional 20.2% |
| Immigrants | England | 91.9 /100 | #133 | Exceptional 20.2% |
| Immigrants | Venezuela | 91.5 /100 | #134 | Exceptional 20.2% |
| Immigrants | Iraq | 91.2 /100 | #135 | Exceptional 20.2% |
| Immigrants | Canada | 91.2 /100 | #136 | Exceptional 20.2% |
| Immigrants | Nepal | 90.6 /100 | #137 | Exceptional 20.3% |
| Slovenes | 90.5 /100 | #138 | Exceptional 20.3% |
| Immigrants | Kuwait | 90.4 /100 | #139 | Exceptional 20.3% |
| Syrians | 90.4 /100 | #140 | Exceptional 20.3% |
| Immigrants | North America | 89.5 /100 | #141 | Excellent 20.3% |
| Immigrants | Uganda | 89.1 /100 | #142 | Excellent 20.3% |
| Australians | 88.4 /100 | #143 | Excellent 20.3% |
Demographics Similar to Immigrants from Dominican Republic by Single Female Poverty
In terms of single female poverty, the demographic groups most similar to Immigrants from Dominican Republic are Immigrants from Congo (25.3%, a difference of 0.010%), Immigrants from Mexico (25.3%, a difference of 0.10%), Somali (25.2%, a difference of 0.28%), Potawatomi (25.4%, a difference of 0.32%), and Aleut (25.4%, a difference of 0.49%).
| Demographics | Rating | Rank | Single Female Poverty |
| Yaqui | 0.0 /100 | #298 | Tragic 24.9% |
| Mexicans | 0.0 /100 | #299 | Tragic 25.0% |
| Blackfeet | 0.0 /100 | #300 | Tragic 25.1% |
| Hondurans | 0.0 /100 | #301 | Tragic 25.1% |
| Shoshone | 0.0 /100 | #302 | Tragic 25.1% |
| Somalis | 0.0 /100 | #303 | Tragic 25.2% |
| Immigrants | Congo | 0.0 /100 | #304 | Tragic 25.3% |
| Immigrants | Dominican Republic | 0.0 /100 | #305 | Tragic 25.3% |
| Immigrants | Mexico | 0.0 /100 | #306 | Tragic 25.3% |
| Potawatomi | 0.0 /100 | #307 | Tragic 25.4% |
| Aleuts | 0.0 /100 | #308 | Tragic 25.4% |
| Dominicans | 0.0 /100 | #309 | Tragic 25.4% |
| Central American Indians | 0.0 /100 | #310 | Tragic 25.5% |
| Immigrants | Honduras | 0.0 /100 | #311 | Tragic 25.5% |
| Paiute | 0.0 /100 | #312 | Tragic 25.5% |