Kenyan vs Immigrants from Dominican Republic Single Female Poverty
COMPARE
Kenyan
Immigrants from Dominican Republic
Single Female Poverty
Single Female Poverty Comparison
Kenyans
Immigrants from Dominican Republic
20.8%
SINGLE FEMALE POVERTY
68.5/ 100
METRIC RATING
161st/ 347
METRIC RANK
25.3%
SINGLE FEMALE POVERTY
0.0/ 100
METRIC RATING
305th/ 347
METRIC RANK
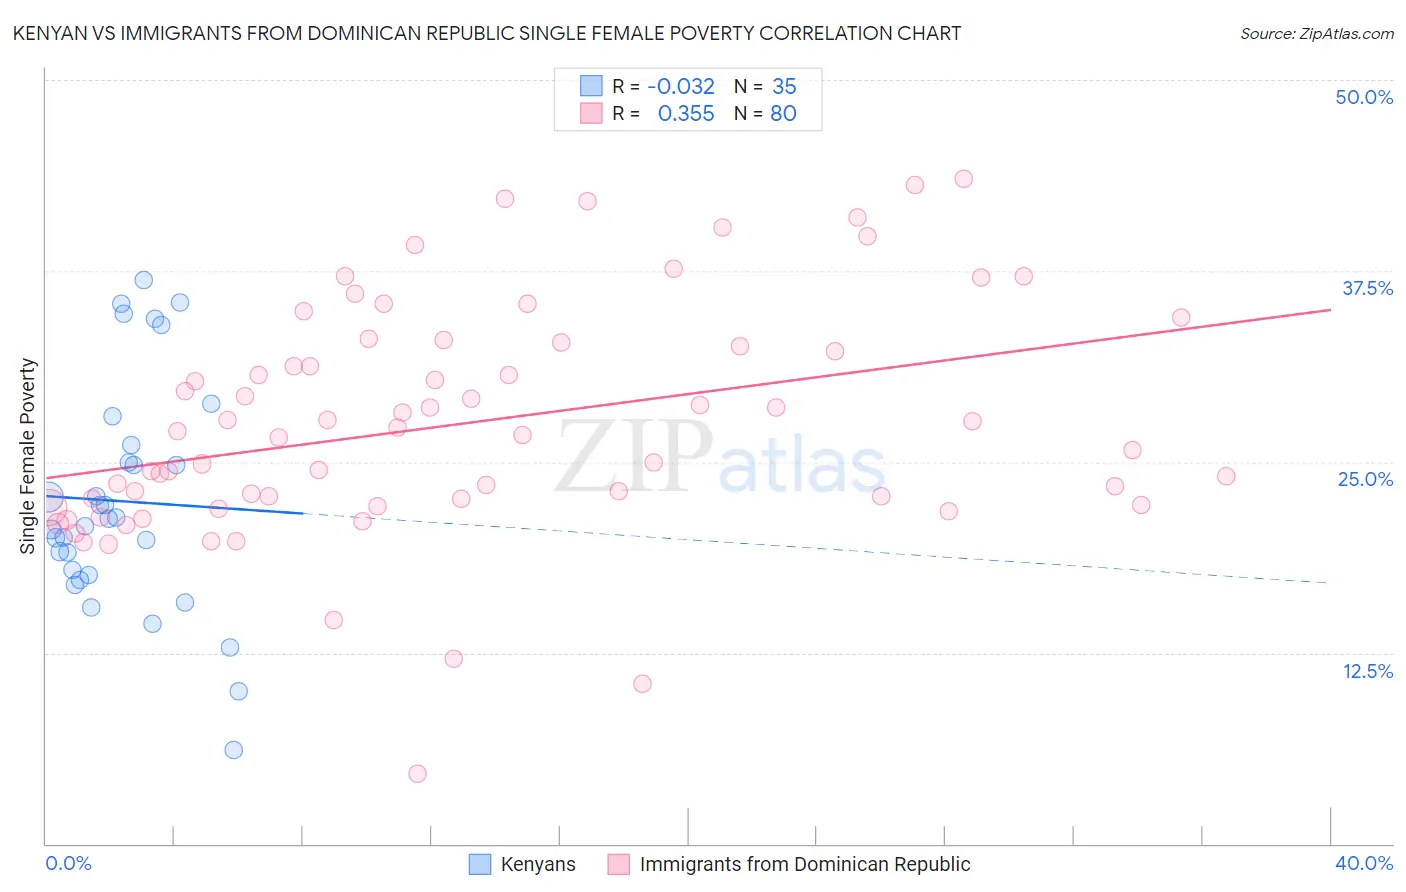
Kenyan vs Immigrants from Dominican Republic Single Female Poverty Correlation Chart
The statistical analysis conducted on geographies consisting of 167,254,696 people shows no correlation between the proportion of Kenyans and poverty level among single females in the United States with a correlation coefficient (R) of -0.032 and weighted average of 20.8%. Similarly, the statistical analysis conducted on geographies consisting of 271,687,011 people shows a mild positive correlation between the proportion of Immigrants from Dominican Republic and poverty level among single females in the United States with a correlation coefficient (R) of 0.355 and weighted average of 25.3%, a difference of 21.9%.
Single Female Poverty Correlation Summary
| Measurement | Kenyan | Immigrants from Dominican Republic |
| Minimum | 6.1% | 4.6% |
| Maximum | 36.9% | 43.6% |
| Range | 30.8% | 39.0% |
| Mean | 22.4% | 27.5% |
| Median | 21.2% | 26.9% |
| Interquartile 25% (IQ1) | 17.6% | 22.4% |
| Interquartile 75% (IQ3) | 26.1% | 32.7% |
| Interquartile Range (IQR) | 8.6% | 10.3% |
| Standard Deviation (Sample) | 7.5% | 7.7% |
| Standard Deviation (Population) | 7.4% | 7.6% |
Similar Demographics by Single Female Poverty
Demographics Similar to Kenyans by Single Female Poverty
In terms of single female poverty, the demographic groups most similar to Kenyans are Northern European (20.8%, a difference of 0.010%), Lebanese (20.8%, a difference of 0.060%), Arab (20.7%, a difference of 0.18%), Costa Rican (20.7%, a difference of 0.25%), and Iraqi (20.8%, a difference of 0.28%).
| Demographics | Rating | Rank | Single Female Poverty |
| Immigrants | Western Europe | 76.7 /100 | #154 | Good 20.6% |
| Samoans | 76.0 /100 | #155 | Good 20.6% |
| South American Indians | 75.7 /100 | #156 | Good 20.6% |
| Immigrants | Oceania | 74.3 /100 | #157 | Good 20.7% |
| Danes | 73.0 /100 | #158 | Good 20.7% |
| Costa Ricans | 71.8 /100 | #159 | Good 20.7% |
| Arabs | 70.8 /100 | #160 | Good 20.7% |
| Kenyans | 68.5 /100 | #161 | Good 20.8% |
| Northern Europeans | 68.4 /100 | #162 | Good 20.8% |
| Lebanese | 67.6 /100 | #163 | Good 20.8% |
| Iraqis | 64.5 /100 | #164 | Good 20.8% |
| Ugandans | 64.0 /100 | #165 | Good 20.8% |
| Norwegians | 63.0 /100 | #166 | Good 20.8% |
| Immigrants | Norway | 63.0 /100 | #167 | Good 20.8% |
| Immigrants | Costa Rica | 61.5 /100 | #168 | Good 20.9% |
Demographics Similar to Immigrants from Dominican Republic by Single Female Poverty
In terms of single female poverty, the demographic groups most similar to Immigrants from Dominican Republic are Immigrants from Congo (25.3%, a difference of 0.010%), Immigrants from Mexico (25.3%, a difference of 0.10%), Somali (25.2%, a difference of 0.28%), Potawatomi (25.4%, a difference of 0.32%), and Aleut (25.4%, a difference of 0.49%).
| Demographics | Rating | Rank | Single Female Poverty |
| Yaqui | 0.0 /100 | #298 | Tragic 24.9% |
| Mexicans | 0.0 /100 | #299 | Tragic 25.0% |
| Blackfeet | 0.0 /100 | #300 | Tragic 25.1% |
| Hondurans | 0.0 /100 | #301 | Tragic 25.1% |
| Shoshone | 0.0 /100 | #302 | Tragic 25.1% |
| Somalis | 0.0 /100 | #303 | Tragic 25.2% |
| Immigrants | Congo | 0.0 /100 | #304 | Tragic 25.3% |
| Immigrants | Dominican Republic | 0.0 /100 | #305 | Tragic 25.3% |
| Immigrants | Mexico | 0.0 /100 | #306 | Tragic 25.3% |
| Potawatomi | 0.0 /100 | #307 | Tragic 25.4% |
| Aleuts | 0.0 /100 | #308 | Tragic 25.4% |
| Dominicans | 0.0 /100 | #309 | Tragic 25.4% |
| Central American Indians | 0.0 /100 | #310 | Tragic 25.5% |
| Immigrants | Honduras | 0.0 /100 | #311 | Tragic 25.5% |
| Paiute | 0.0 /100 | #312 | Tragic 25.5% |