Canadian vs Paraguayan Single Female Poverty
COMPARE
Canadian
Paraguayan
Single Female Poverty
Single Female Poverty Comparison
Canadians
Paraguayans
21.1%
SINGLE FEMALE POVERTY
45.4/ 100
METRIC RATING
176th/ 347
METRIC RANK
19.3%
SINGLE FEMALE POVERTY
99.5/ 100
METRIC RATING
69th/ 347
METRIC RANK
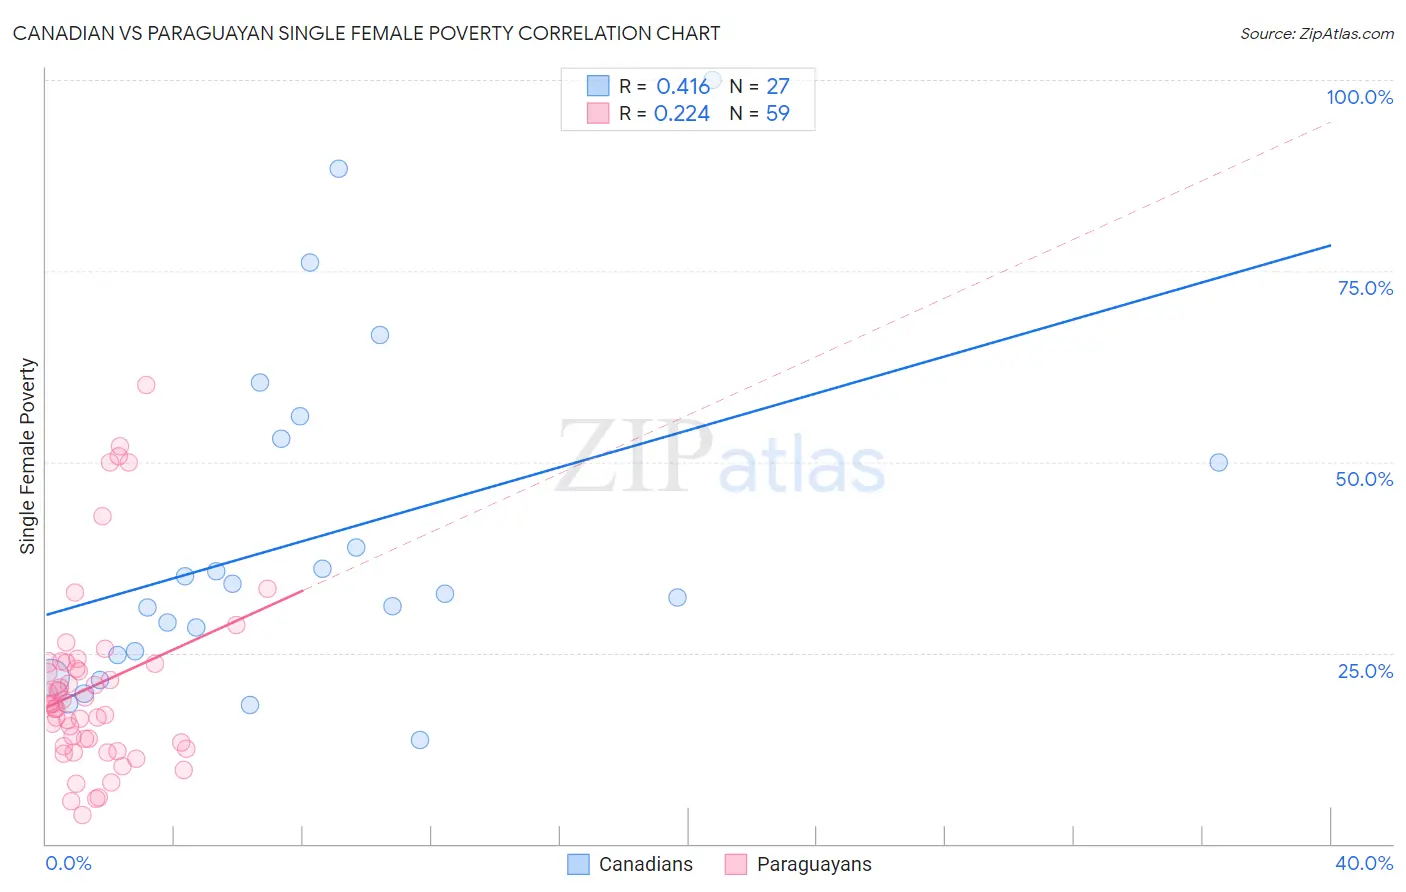
Canadian vs Paraguayan Single Female Poverty Correlation Chart
The statistical analysis conducted on geographies consisting of 428,352,495 people shows a moderate positive correlation between the proportion of Canadians and poverty level among single females in the United States with a correlation coefficient (R) of 0.416 and weighted average of 21.1%. Similarly, the statistical analysis conducted on geographies consisting of 94,675,073 people shows a weak positive correlation between the proportion of Paraguayans and poverty level among single females in the United States with a correlation coefficient (R) of 0.224 and weighted average of 19.3%, a difference of 9.2%.
Single Female Poverty Correlation Summary
| Measurement | Canadian | Paraguayan |
| Minimum | 13.6% | 3.7% |
| Maximum | 100.0% | 60.0% |
| Range | 86.4% | 56.3% |
| Mean | 39.9% | 20.7% |
| Median | 32.8% | 18.3% |
| Interquartile 25% (IQ1) | 24.7% | 12.7% |
| Interquartile 75% (IQ3) | 53.0% | 23.7% |
| Interquartile Range (IQR) | 28.3% | 11.0% |
| Standard Deviation (Sample) | 22.1% | 12.1% |
| Standard Deviation (Population) | 21.7% | 12.0% |
Similar Demographics by Single Female Poverty
Demographics Similar to Canadians by Single Female Poverty
In terms of single female poverty, the demographic groups most similar to Canadians are Scandinavian (21.1%, a difference of 0.010%), Immigrants from Bosnia and Herzegovina (21.1%, a difference of 0.040%), Czech (21.0%, a difference of 0.080%), British (21.1%, a difference of 0.16%), and Spanish American Indian (21.1%, a difference of 0.19%).
| Demographics | Rating | Rank | Single Female Poverty |
| Immigrants | Trinidad and Tobago | 56.3 /100 | #169 | Average 20.9% |
| New Zealanders | 53.2 /100 | #170 | Average 21.0% |
| Moroccans | 52.8 /100 | #171 | Average 21.0% |
| Guyanese | 52.0 /100 | #172 | Average 21.0% |
| Immigrants | Guyana | 50.6 /100 | #173 | Average 21.0% |
| Cubans | 50.0 /100 | #174 | Average 21.0% |
| Czechs | 46.8 /100 | #175 | Average 21.0% |
| Canadians | 45.4 /100 | #176 | Average 21.1% |
| Scandinavians | 45.2 /100 | #177 | Average 21.1% |
| Immigrants | Bosnia and Herzegovina | 44.9 /100 | #178 | Average 21.1% |
| British | 42.9 /100 | #179 | Average 21.1% |
| Spanish American Indians | 42.5 /100 | #180 | Average 21.1% |
| Europeans | 42.3 /100 | #181 | Average 21.1% |
| Slavs | 40.5 /100 | #182 | Average 21.1% |
| Slovaks | 39.7 /100 | #183 | Fair 21.1% |
Demographics Similar to Paraguayans by Single Female Poverty
In terms of single female poverty, the demographic groups most similar to Paraguayans are Immigrants from Jordan (19.3%, a difference of 0.060%), Immigrants from South Eastern Asia (19.3%, a difference of 0.13%), Immigrants from Latvia (19.3%, a difference of 0.14%), Immigrants from Peru (19.3%, a difference of 0.23%), and Laotian (19.3%, a difference of 0.25%).
| Demographics | Rating | Rank | Single Female Poverty |
| Lithuanians | 99.6 /100 | #62 | Exceptional 19.2% |
| Immigrants | Northern Europe | 99.6 /100 | #63 | Exceptional 19.2% |
| Immigrants | Europe | 99.6 /100 | #64 | Exceptional 19.2% |
| Cypriots | 99.6 /100 | #65 | Exceptional 19.2% |
| Palestinians | 99.6 /100 | #66 | Exceptional 19.2% |
| Immigrants | Egypt | 99.6 /100 | #67 | Exceptional 19.2% |
| Laotians | 99.5 /100 | #68 | Exceptional 19.3% |
| Paraguayans | 99.5 /100 | #69 | Exceptional 19.3% |
| Immigrants | Jordan | 99.4 /100 | #70 | Exceptional 19.3% |
| Immigrants | South Eastern Asia | 99.4 /100 | #71 | Exceptional 19.3% |
| Immigrants | Latvia | 99.4 /100 | #72 | Exceptional 19.3% |
| Immigrants | Peru | 99.4 /100 | #73 | Exceptional 19.3% |
| Immigrants | Belarus | 99.4 /100 | #74 | Exceptional 19.3% |
| Immigrants | Turkey | 99.4 /100 | #75 | Exceptional 19.4% |
| Peruvians | 99.4 /100 | #76 | Exceptional 19.4% |