Canadian vs Spanish Single Female Poverty
COMPARE
Canadian
Spanish
Single Female Poverty
Single Female Poverty Comparison
Canadians
Spanish
21.1%
SINGLE FEMALE POVERTY
45.4/ 100
METRIC RATING
176th/ 347
METRIC RANK
22.0%
SINGLE FEMALE POVERTY
4.7/ 100
METRIC RATING
234th/ 347
METRIC RANK
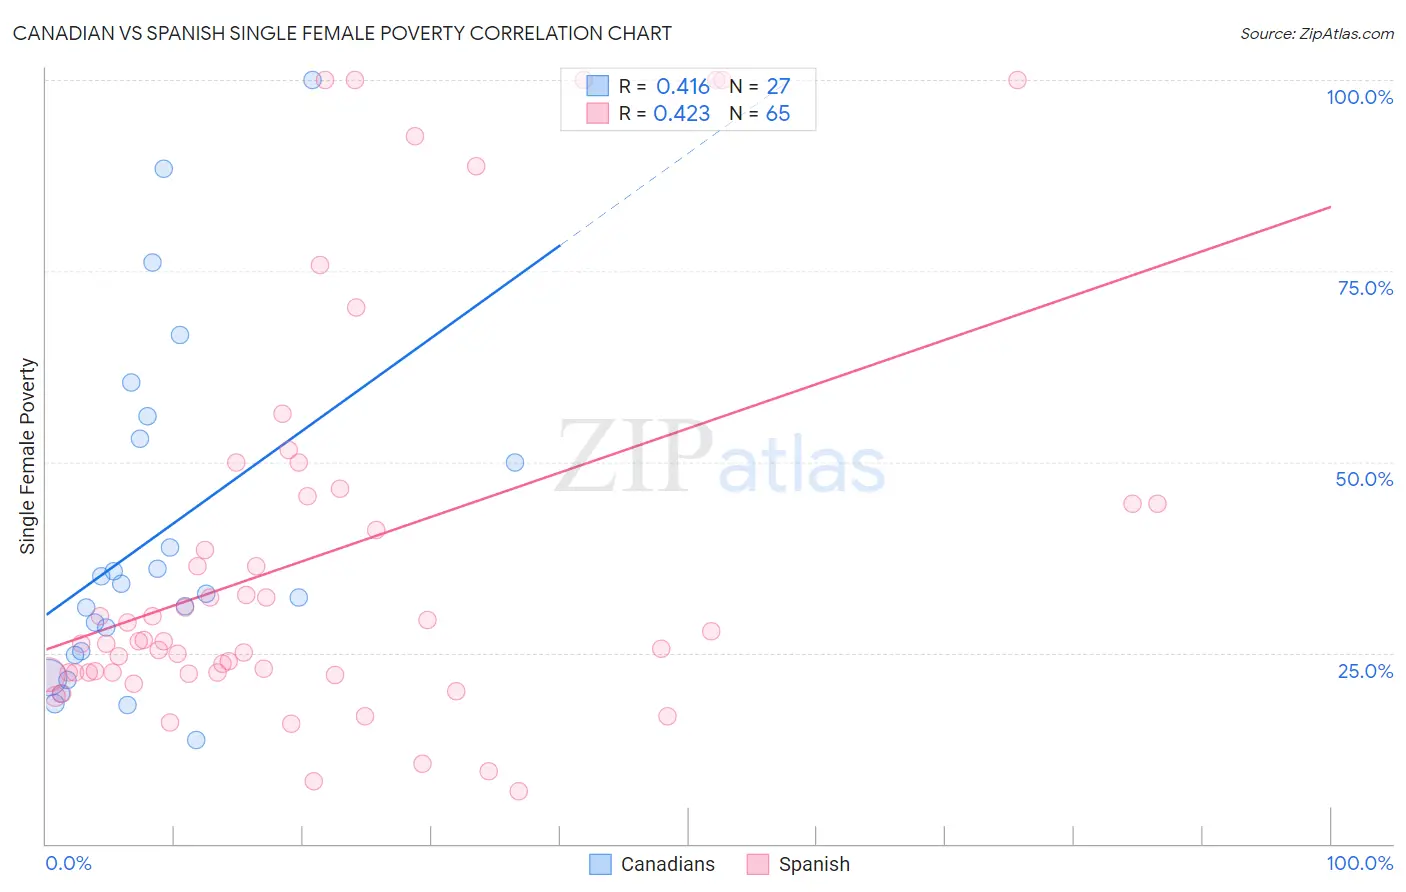
Canadian vs Spanish Single Female Poverty Correlation Chart
The statistical analysis conducted on geographies consisting of 428,352,495 people shows a moderate positive correlation between the proportion of Canadians and poverty level among single females in the United States with a correlation coefficient (R) of 0.416 and weighted average of 21.1%. Similarly, the statistical analysis conducted on geographies consisting of 415,535,670 people shows a moderate positive correlation between the proportion of Spanish and poverty level among single females in the United States with a correlation coefficient (R) of 0.423 and weighted average of 22.0%, a difference of 4.4%.
Single Female Poverty Correlation Summary
| Measurement | Canadian | Spanish |
| Minimum | 13.6% | 6.8% |
| Maximum | 100.0% | 100.0% |
| Range | 86.4% | 93.2% |
| Mean | 39.9% | 37.7% |
| Median | 32.8% | 26.5% |
| Interquartile 25% (IQ1) | 24.7% | 22.4% |
| Interquartile 75% (IQ3) | 53.0% | 45.0% |
| Interquartile Range (IQR) | 28.3% | 22.6% |
| Standard Deviation (Sample) | 22.1% | 26.1% |
| Standard Deviation (Population) | 21.7% | 25.9% |
Similar Demographics by Single Female Poverty
Demographics Similar to Canadians by Single Female Poverty
In terms of single female poverty, the demographic groups most similar to Canadians are Scandinavian (21.1%, a difference of 0.010%), Immigrants from Bosnia and Herzegovina (21.1%, a difference of 0.040%), Czech (21.0%, a difference of 0.080%), British (21.1%, a difference of 0.16%), and Spanish American Indian (21.1%, a difference of 0.19%).
| Demographics | Rating | Rank | Single Female Poverty |
| Immigrants | Trinidad and Tobago | 56.3 /100 | #169 | Average 20.9% |
| New Zealanders | 53.2 /100 | #170 | Average 21.0% |
| Moroccans | 52.8 /100 | #171 | Average 21.0% |
| Guyanese | 52.0 /100 | #172 | Average 21.0% |
| Immigrants | Guyana | 50.6 /100 | #173 | Average 21.0% |
| Cubans | 50.0 /100 | #174 | Average 21.0% |
| Czechs | 46.8 /100 | #175 | Average 21.0% |
| Canadians | 45.4 /100 | #176 | Average 21.1% |
| Scandinavians | 45.2 /100 | #177 | Average 21.1% |
| Immigrants | Bosnia and Herzegovina | 44.9 /100 | #178 | Average 21.1% |
| British | 42.9 /100 | #179 | Average 21.1% |
| Spanish American Indians | 42.5 /100 | #180 | Average 21.1% |
| Europeans | 42.3 /100 | #181 | Average 21.1% |
| Slavs | 40.5 /100 | #182 | Average 21.1% |
| Slovaks | 39.7 /100 | #183 | Fair 21.1% |
Demographics Similar to Spanish by Single Female Poverty
In terms of single female poverty, the demographic groups most similar to Spanish are Spaniard (22.0%, a difference of 0.0%), Dutch (22.0%, a difference of 0.020%), Immigrants from Thailand (22.0%, a difference of 0.10%), Welsh (22.0%, a difference of 0.11%), and Immigrants from Ecuador (22.0%, a difference of 0.18%).
| Demographics | Rating | Rank | Single Female Poverty |
| Immigrants | Ghana | 5.8 /100 | #227 | Tragic 21.9% |
| Salvadorans | 5.5 /100 | #228 | Tragic 21.9% |
| Tlingit-Haida | 5.4 /100 | #229 | Tragic 21.9% |
| Immigrants | Western Africa | 5.3 /100 | #230 | Tragic 22.0% |
| Welsh | 5.0 /100 | #231 | Tragic 22.0% |
| Immigrants | Thailand | 5.0 /100 | #232 | Tragic 22.0% |
| Spaniards | 4.7 /100 | #233 | Tragic 22.0% |
| Spanish | 4.7 /100 | #234 | Tragic 22.0% |
| Dutch | 4.6 /100 | #235 | Tragic 22.0% |
| Immigrants | Ecuador | 4.2 /100 | #236 | Tragic 22.0% |
| Vietnamese | 4.0 /100 | #237 | Tragic 22.0% |
| French Canadians | 2.8 /100 | #238 | Tragic 22.2% |
| Malaysians | 2.8 /100 | #239 | Tragic 22.2% |
| French | 2.3 /100 | #240 | Tragic 22.2% |
| Cape Verdeans | 2.1 /100 | #241 | Tragic 22.3% |