Canadian vs Bangladeshi Single Female Poverty
COMPARE
Canadian
Bangladeshi
Single Female Poverty
Single Female Poverty Comparison
Canadians
Bangladeshis
21.1%
SINGLE FEMALE POVERTY
45.4/ 100
METRIC RATING
176th/ 347
METRIC RANK
24.2%
SINGLE FEMALE POVERTY
0.0/ 100
METRIC RATING
287th/ 347
METRIC RANK
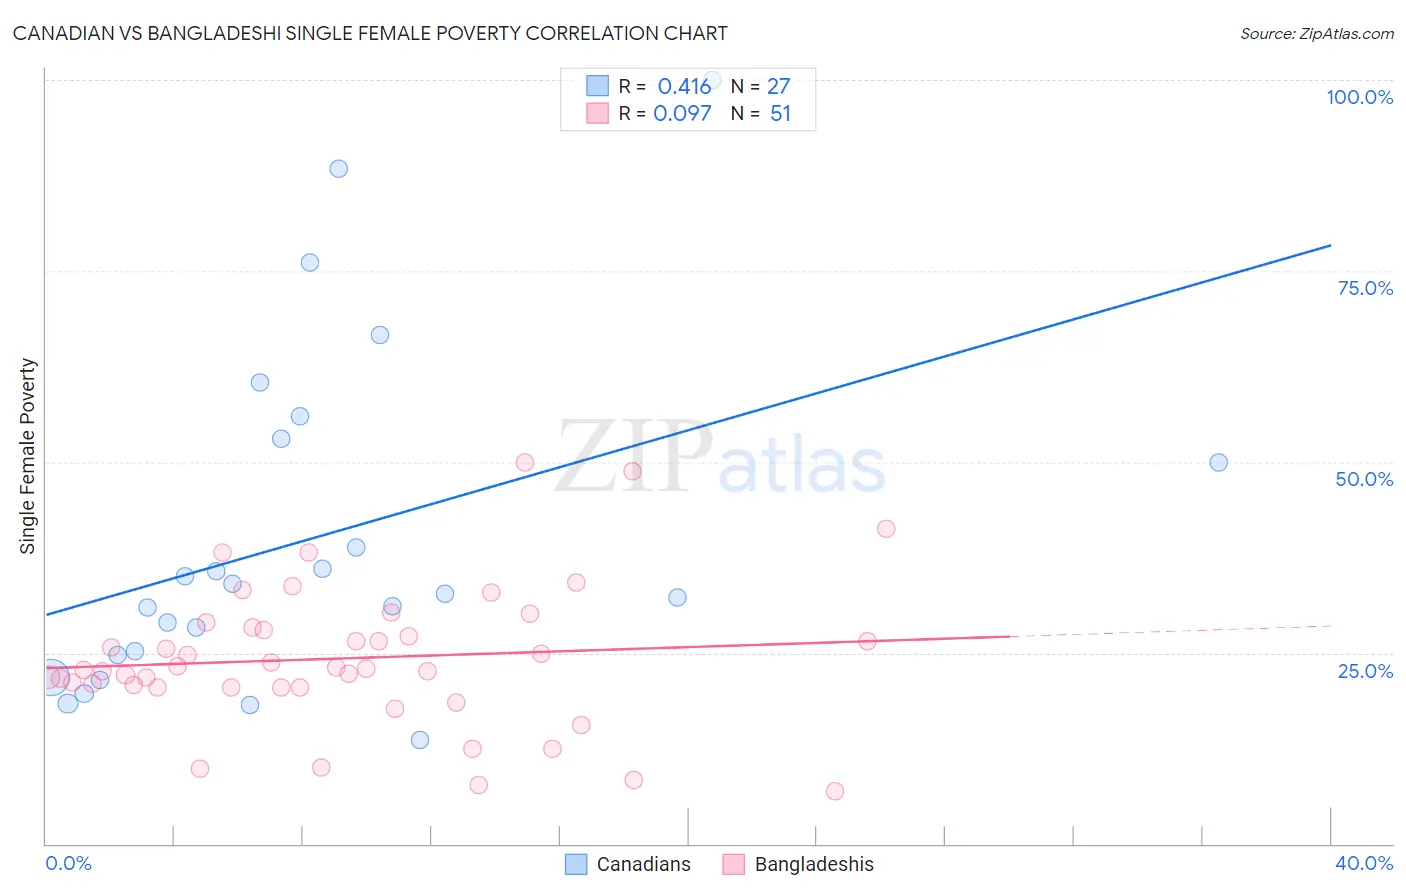
Canadian vs Bangladeshi Single Female Poverty Correlation Chart
The statistical analysis conducted on geographies consisting of 428,352,495 people shows a moderate positive correlation between the proportion of Canadians and poverty level among single females in the United States with a correlation coefficient (R) of 0.416 and weighted average of 21.1%. Similarly, the statistical analysis conducted on geographies consisting of 140,594,140 people shows a slight positive correlation between the proportion of Bangladeshis and poverty level among single females in the United States with a correlation coefficient (R) of 0.097 and weighted average of 24.2%, a difference of 14.7%.
Single Female Poverty Correlation Summary
| Measurement | Canadian | Bangladeshi |
| Minimum | 13.6% | 6.9% |
| Maximum | 100.0% | 50.0% |
| Range | 86.4% | 43.1% |
| Mean | 39.9% | 24.3% |
| Median | 32.8% | 22.9% |
| Interquartile 25% (IQ1) | 24.7% | 20.5% |
| Interquartile 75% (IQ3) | 53.0% | 28.3% |
| Interquartile Range (IQR) | 28.3% | 7.8% |
| Standard Deviation (Sample) | 22.1% | 9.2% |
| Standard Deviation (Population) | 21.7% | 9.1% |
Similar Demographics by Single Female Poverty
Demographics Similar to Canadians by Single Female Poverty
In terms of single female poverty, the demographic groups most similar to Canadians are Scandinavian (21.1%, a difference of 0.010%), Immigrants from Bosnia and Herzegovina (21.1%, a difference of 0.040%), Czech (21.0%, a difference of 0.080%), British (21.1%, a difference of 0.16%), and Spanish American Indian (21.1%, a difference of 0.19%).
| Demographics | Rating | Rank | Single Female Poverty |
| Immigrants | Trinidad and Tobago | 56.3 /100 | #169 | Average 20.9% |
| New Zealanders | 53.2 /100 | #170 | Average 21.0% |
| Moroccans | 52.8 /100 | #171 | Average 21.0% |
| Guyanese | 52.0 /100 | #172 | Average 21.0% |
| Immigrants | Guyana | 50.6 /100 | #173 | Average 21.0% |
| Cubans | 50.0 /100 | #174 | Average 21.0% |
| Czechs | 46.8 /100 | #175 | Average 21.0% |
| Canadians | 45.4 /100 | #176 | Average 21.1% |
| Scandinavians | 45.2 /100 | #177 | Average 21.1% |
| Immigrants | Bosnia and Herzegovina | 44.9 /100 | #178 | Average 21.1% |
| British | 42.9 /100 | #179 | Average 21.1% |
| Spanish American Indians | 42.5 /100 | #180 | Average 21.1% |
| Europeans | 42.3 /100 | #181 | Average 21.1% |
| Slavs | 40.5 /100 | #182 | Average 21.1% |
| Slovaks | 39.7 /100 | #183 | Fair 21.1% |
Demographics Similar to Bangladeshis by Single Female Poverty
In terms of single female poverty, the demographic groups most similar to Bangladeshis are Spanish American (24.2%, a difference of 0.020%), U.S. Virgin Islander (24.2%, a difference of 0.070%), Cree (24.1%, a difference of 0.15%), Immigrants from Guatemala (24.1%, a difference of 0.19%), and Indonesian (24.3%, a difference of 0.41%).
| Demographics | Rating | Rank | Single Female Poverty |
| Immigrants | Latin America | 0.0 /100 | #280 | Tragic 23.7% |
| Immigrants | Zaire | 0.0 /100 | #281 | Tragic 23.8% |
| Guatemalans | 0.0 /100 | #282 | Tragic 23.8% |
| German Russians | 0.0 /100 | #283 | Tragic 23.9% |
| Immigrants | Dominica | 0.0 /100 | #284 | Tragic 23.9% |
| Immigrants | Guatemala | 0.0 /100 | #285 | Tragic 24.1% |
| Cree | 0.0 /100 | #286 | Tragic 24.1% |
| Bangladeshis | 0.0 /100 | #287 | Tragic 24.2% |
| Spanish Americans | 0.0 /100 | #288 | Tragic 24.2% |
| U.S. Virgin Islanders | 0.0 /100 | #289 | Tragic 24.2% |
| Indonesians | 0.0 /100 | #290 | Tragic 24.3% |
| Osage | 0.0 /100 | #291 | Tragic 24.4% |
| Alsatians | 0.0 /100 | #292 | Tragic 24.5% |
| Americans | 0.0 /100 | #293 | Tragic 24.5% |
| French American Indians | 0.0 /100 | #294 | Tragic 24.6% |