Zip Codes with the Highest Percentage of Population with a Degree in Arts and Humanities in Toledo, OH

RELATED REPORTS & OPTIONS

Arts and Humanities
Population
Families and Households
Female Fertility
Female Fertility (Unmarried)
Race (Community Size)
Race (Percentage)
Ancestry (Community Size)
AfghanAfricanAlsatianAmericanApacheArabArmenianAustrianBelgianBhutaneseBlackfeetBrazilianBritishBulgarianBurmeseCanadianCelticCentral AmericanCentral American IndianCherokeeChippewaChoctawColombianComancheCosta RicanCreekCroatianCubanCypriotCzechCzechoslovakianDanishDominicanDutchEastern EuropeanEcuadorianEgyptianEnglishEuropeanFinnishFrenchFrench American IndianFrench CanadianGermanGerman RussianGhanaianGreekGuamanian / ChamorroGuatemalanGuyaneseHaitianHonduranHungarianIndian (Asian)IranianIraqiIrishIroquoisIsraeliItalianJamaicanJapaneseJordanianKenyanKoreanLaotianLebaneseLiberianLithuanianMacedonianMalaysianMalteseMexicanMexican American IndianNative HawaiianNavajoNicaraguanNigerianNorthern EuropeanNorwegianPakistaniPalestinianPanamanianParaguayanPennsylvania GermanPeruvianPolishPortuguesePuerto RicanRomanianRussianSalvadoranSamoanScandinavianScotch-IrishScottishSeminoleSerbianShoshoneSiouxSlavicSlovakSloveneSouth AfricanSouth AmericanSpaniardSpanishSri LankanSubsaharan AfricanSudaneseSwedishSwissSyrianThaiTrinidadian and TobagonianTurkishUkrainianVenezuelanWelshWest IndianYugoslavian
Ancestry (Percentage)
AfghanAfricanAlsatianAmericanApacheArabArmenianAustrianBelgianBhutaneseBlackfeetBrazilianBritishBulgarianBurmeseCanadianCelticCentral AmericanCentral American IndianCherokeeChippewaChoctawColombianComancheCosta RicanCreekCroatianCubanCypriotCzechCzechoslovakianDanishDominicanDutchEastern EuropeanEcuadorianEgyptianEnglishEuropeanFinnishFrenchFrench American IndianFrench CanadianGermanGerman RussianGhanaianGreekGuamanian / ChamorroGuatemalanGuyaneseHaitianHonduranHungarianIndian (Asian)IranianIraqiIrishIroquoisIsraeliItalianJamaicanJapaneseJordanianKenyanKoreanLaotianLebaneseLiberianLithuanianMacedonianMalaysianMalteseMexicanMexican American IndianNative HawaiianNavajoNicaraguanNigerianNorthern EuropeanNorwegianPakistaniPalestinianPanamanianParaguayanPennsylvania GermanPeruvianPolishPortuguesePuerto RicanRomanianRussianSalvadoranSamoanScandinavianScotch-IrishScottishSeminoleSerbianShoshoneSiouxSlavicSlovakSloveneSouth AfricanSouth AmericanSpaniardSpanishSri LankanSubsaharan AfricanSudaneseSwedishSwissSyrianThaiTrinidadian and TobagonianTurkishUkrainianVenezuelanWelshWest IndianYugoslavian
Immigrant Origin (Total)
Immigrant Origin (Percentage)
Income
Income (Families)
Income (Households)
Poverty
Poverty (Families)
Unemployment
Employment Occupations
Employment Industries
Employer Class
Commute Time
Commute Means
School Enrollment
Education by Degree Field
Occupancy
Finances
Physical Characteristics
Toledo
Compare Zip Codes
Comparison Subject

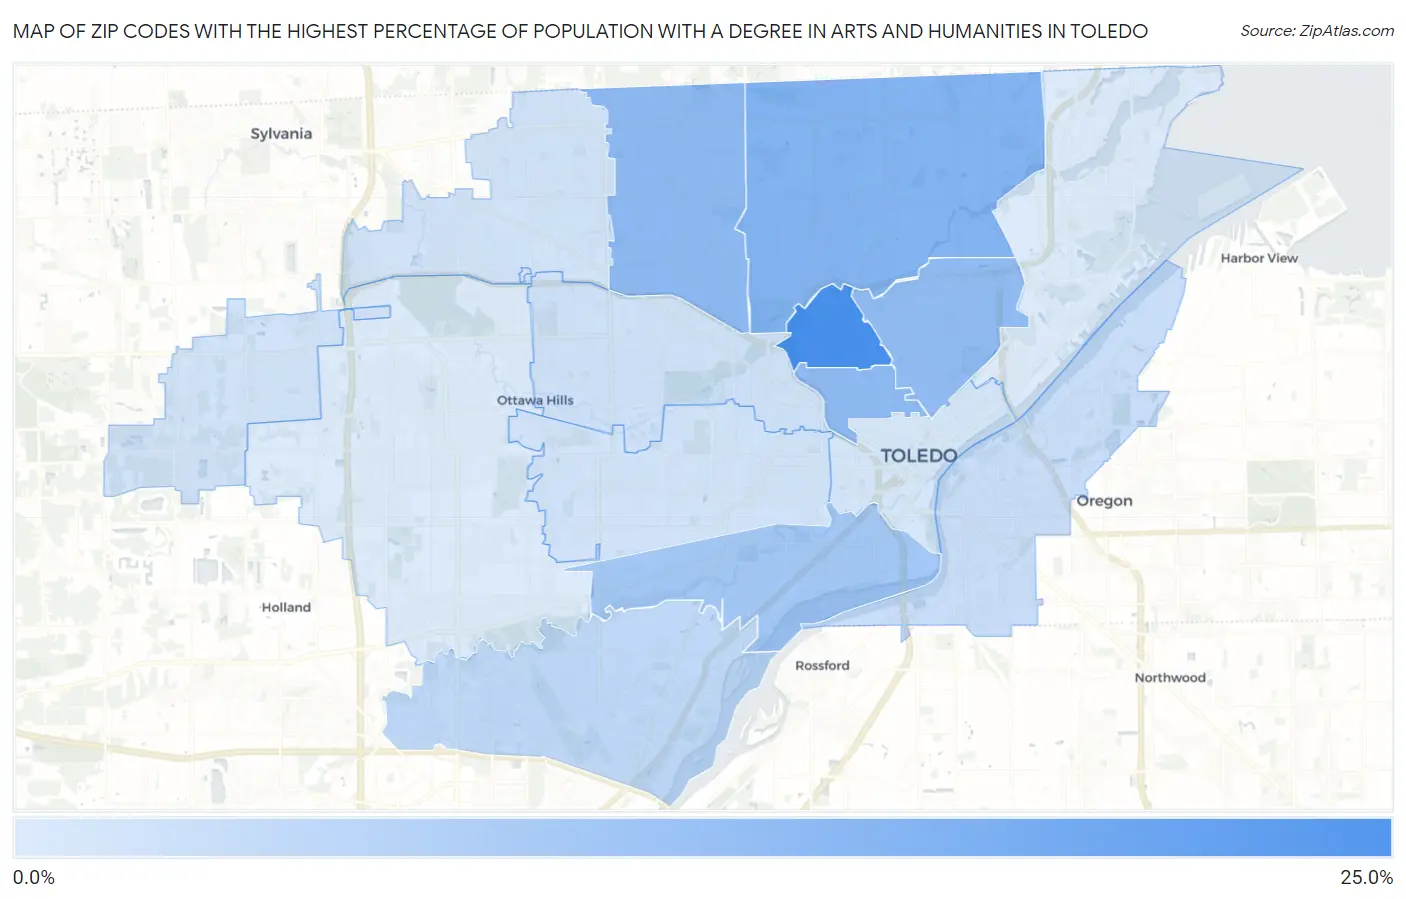
Map of Zip Codes with the Highest Percentage of Population with a Degree in Arts and Humanities in Toledo

0.0%
25.0%
Zip Codes with the Highest Percentage of Population with a Degree in Arts and Humanities in Toledo Map

Zip Codes with the Highest Percentage of Population with a Degree in Arts and Humanities in Toledo, OH

Zip Code % Graduates vs State vs National
1.4361021.3%5.8%(+15.5)#386.0%(+15.3)#1,312
2.4361214.2%5.8%(+8.45)#1136.0%(+8.24)#3,015
3.4361312.9%5.8%(+7.15)#1366.0%(+6.94)#3,688
4.4362012.9%5.8%(+7.08)#1406.0%(+6.87)#3,736
5.4360812.6%5.8%(+6.81)#1466.0%(+6.60)#3,894
6.4360910.3%5.8%(+4.55)#1996.0%(+4.33)#5,834
7.436147.4%5.8%(+1.62)#3776.0%(+1.41)#10,982
8.436056.3%5.8%(+0.540)#4706.0%(+0.329)#13,739
9.436065.5%5.8%(-0.321)#5716.0%(-0.532)#16,223
10.436175.4%5.8%(-0.350)#5746.0%(-0.561)#16,319
11.436075.3%5.8%(-0.472)#5926.0%(-0.683)#16,666
12.436235.3%5.8%(-0.532)#6046.0%(-0.743)#16,874
13.436044.8%5.8%(-0.978)#6516.0%(-1.19)#18,156
14.436154.2%5.8%(-1.60)#7196.0%(-1.81)#19,823
15.436114.1%5.8%(-1.69)#7316.0%(-1.90)#20,071

Common Questions

What are the Top 10 Zip Codes with the Highest Percentage of Population with a Degree in Arts and Humanities in Toledo, OH?
Top 10 Zip Codes with the Highest Percentage of Population with a Degree in Arts and Humanities in Toledo, OH are:
#1
21.3%
#2
14.2%
#3
12.9%
#4
12.9%
#5
12.6%
#6
10.3%
#7
7.4%
#8
6.3%
#9
5.5%
#10
5.4%
What zip code has the Highest Percentage of Population with a Degree in Arts and Humanities in Toledo, OH?
43610 has the Highest Percentage of Population with a Degree in Arts and Humanities in Toledo, OH with 21.3%.
What is the Percentage of Population with a Degree in Arts and Humanities in Toledo, OH?
Percentage of Population with a Degree in Arts and Humanities in Toledo is 7.9%.
What is the Percentage of Population with a Degree in Arts and Humanities in Ohio?
Percentage of Population with a Degree in Arts and Humanities in Ohio is 5.8%.
What is the Percentage of Population with a Degree in Arts and Humanities in the United States?
Percentage of Population with a Degree in Arts and Humanities in the United States is 6.0%.