Lynch, NE Map & Demographics
Lynch Map
Lynch Overview
$33,350
PER CAPITA INCOME
$76,875
AVG FAMILY INCOME
$41,667
AVG HOUSEHOLD INCOME
21.4%
WAGE / INCOME GAP [ % ]
78.6¢/ $1
WAGE / INCOME GAP [ $ ]
0.39
INEQUALITY / GINI INDEX
169
TOTAL POPULATION
94
MALE POPULATION
75
FEMALE POPULATION
125.33
MALES / 100 FEMALES
79.79
FEMALES / 100 MALES
64.7
MEDIAN AGE
2.5
AVG FAMILY SIZE
1.7
AVG HOUSEHOLD SIZE
91
LABOR FORCE [ PEOPLE ]
60.3%
PERCENT IN LABOR FORCE
Lynch Zip Codes
Lynch Area Codes
Income in Lynch
Income Overview in Lynch
Per Capita Income in Lynch is $33,350, while median incomes of families and households are $76,875 and $41,667 respectively.
| Characteristic | Number | Measure |
| Per Capita Income | 169 | $33,350 |
| Median Family Income | 46 | $76,875 |
| Mean Family Income | 46 | $85,570 |
| Median Household Income | 98 | $41,667 |
| Mean Household Income | 98 | $56,600 |
| Income Deficit | 46 | $0 |
| Wage / Income Gap (%) | 169 | 21.35% |
| Wage / Income Gap ($) | 169 | 78.65¢ per $1 |
| Gini / Inequality Index | 169 | 0.39 |
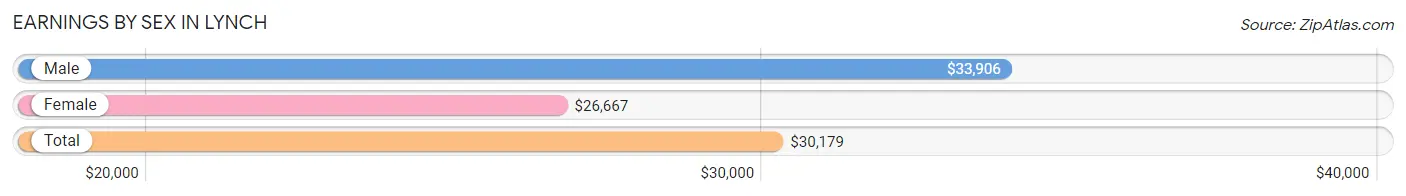
Earnings by Sex in Lynch
Average Earnings in Lynch are $30,179, $33,906 for men and $26,667 for women, a difference of 21.3%.
| Sex | Number | Average Earnings |
| Male | 57 (57.6%) | $33,906 |
| Female | 42 (42.4%) | $26,667 |
| Total | 99 (100.0%) | $30,179 |
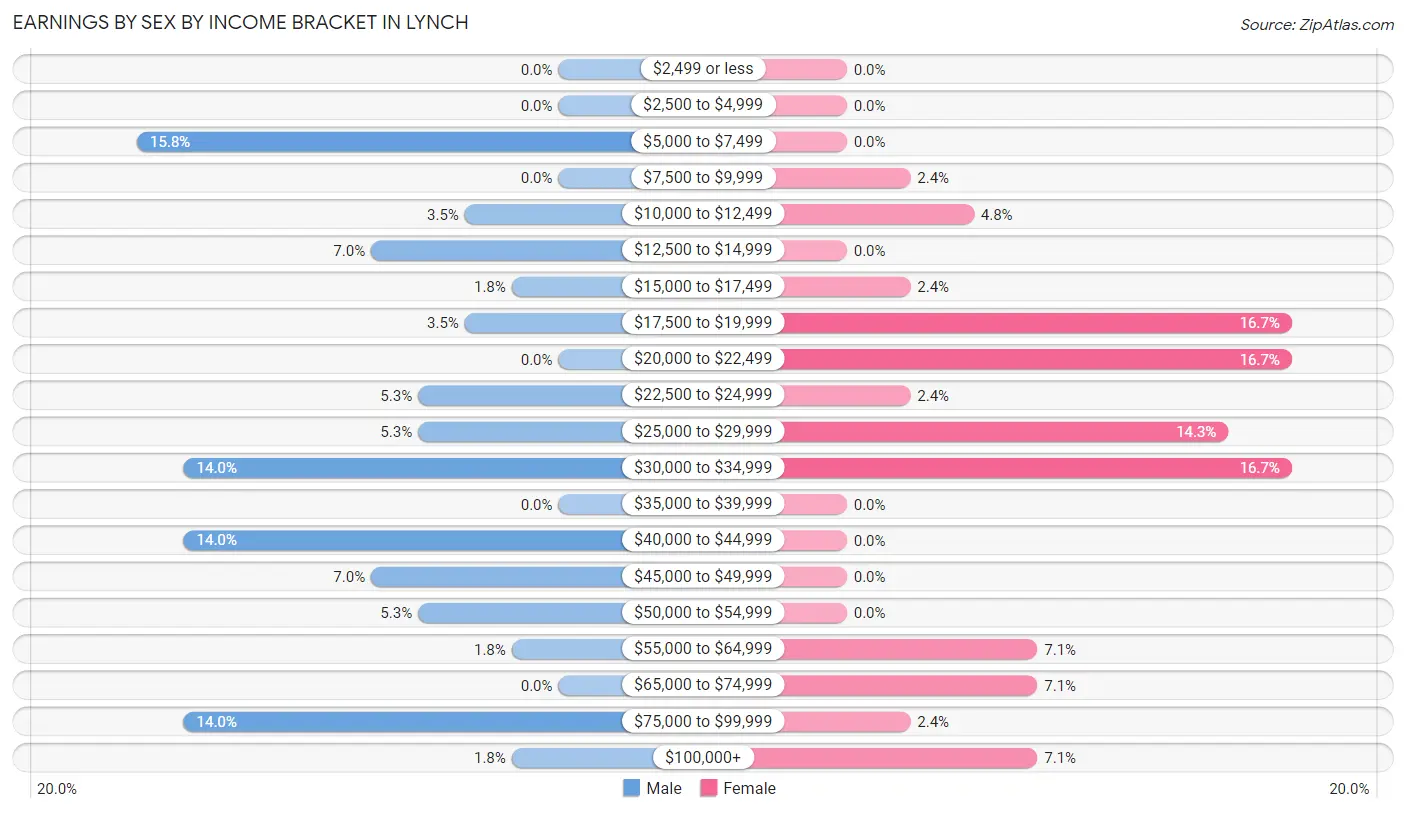
Earnings by Sex by Income Bracket in Lynch
The most common earnings brackets in Lynch are $5,000 to $7,499 for men (9 | 15.8%) and $17,500 to $19,999 for women (7 | 16.7%).
| Income | Male | Female |
| $2,499 or less | 0 (0.0%) | 0 (0.0%) |
| $2,500 to $4,999 | 0 (0.0%) | 0 (0.0%) |
| $5,000 to $7,499 | 9 (15.8%) | 0 (0.0%) |
| $7,500 to $9,999 | 0 (0.0%) | 1 (2.4%) |
| $10,000 to $12,499 | 2 (3.5%) | 2 (4.8%) |
| $12,500 to $14,999 | 4 (7.0%) | 0 (0.0%) |
| $15,000 to $17,499 | 1 (1.8%) | 1 (2.4%) |
| $17,500 to $19,999 | 2 (3.5%) | 7 (16.7%) |
| $20,000 to $22,499 | 0 (0.0%) | 7 (16.7%) |
| $22,500 to $24,999 | 3 (5.3%) | 1 (2.4%) |
| $25,000 to $29,999 | 3 (5.3%) | 6 (14.3%) |
| $30,000 to $34,999 | 8 (14.0%) | 7 (16.7%) |
| $35,000 to $39,999 | 0 (0.0%) | 0 (0.0%) |
| $40,000 to $44,999 | 8 (14.0%) | 0 (0.0%) |
| $45,000 to $49,999 | 4 (7.0%) | 0 (0.0%) |
| $50,000 to $54,999 | 3 (5.3%) | 0 (0.0%) |
| $55,000 to $64,999 | 1 (1.8%) | 3 (7.1%) |
| $65,000 to $74,999 | 0 (0.0%) | 3 (7.1%) |
| $75,000 to $99,999 | 8 (14.0%) | 1 (2.4%) |
| $100,000+ | 1 (1.8%) | 3 (7.1%) |
| Total | 57 (100.0%) | 42 (100.0%) |
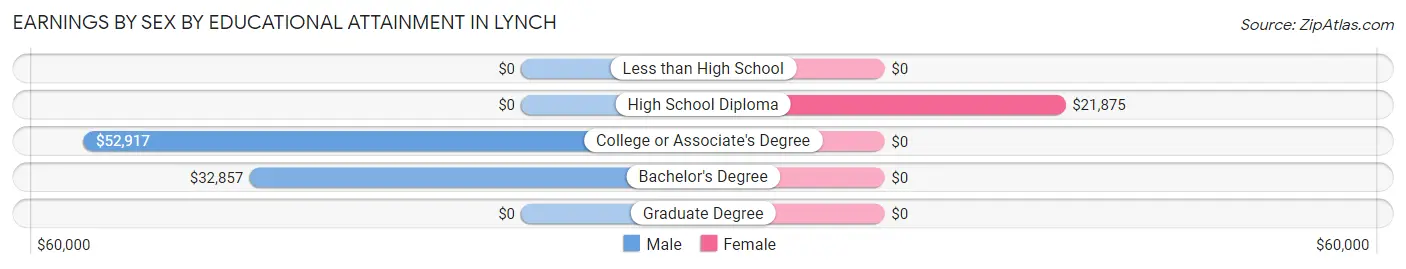
Earnings by Sex by Educational Attainment in Lynch
Average earnings in Lynch are $34,219 for men and $26,875 for women, a difference of 21.5%. Men with an educational attainment of college or associate's degree enjoy the highest average annual earnings of $52,917, while those with bachelor's degree education earn the least with $32,857. Women with an educational attainment of high school diploma earn the most with the average annual earnings of $21,875, while those with high school diploma education have the smallest earnings of $21,875.
| Educational Attainment | Male Income | Female Income |
| Less than High School | - | - |
| High School Diploma | - | - |
| College or Associate's Degree | $52,917 | $0 |
| Bachelor's Degree | $32,857 | $0 |
| Graduate Degree | - | - |
| Total | $34,219 | $26,875 |
Family Income in Lynch
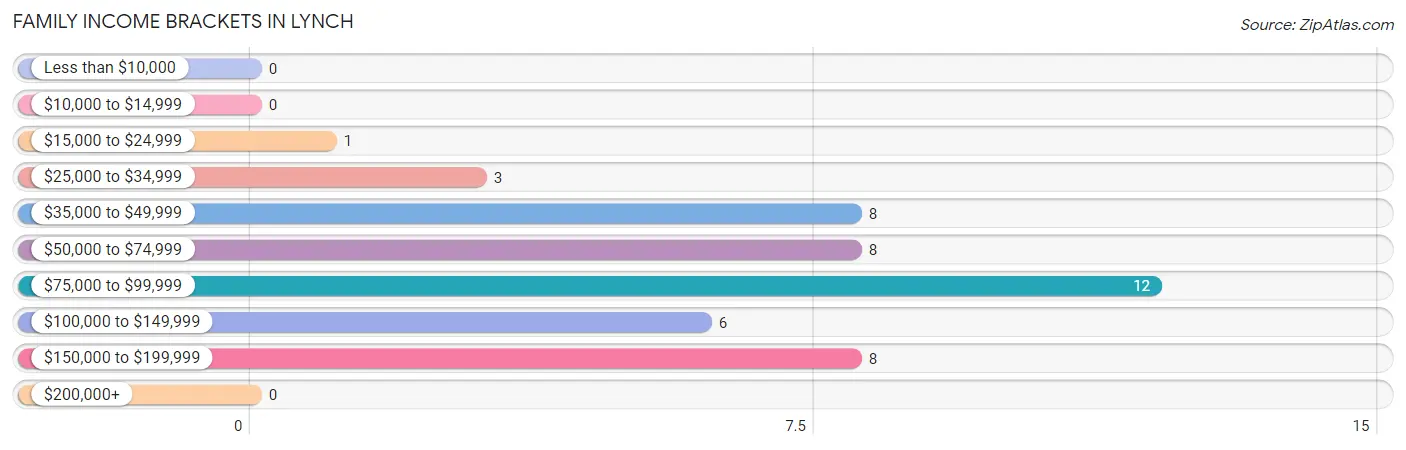
Family Income Brackets in Lynch
According to the Lynch family income data, there are 12 families falling into the $75,000 to $99,999 income range, which is the most common income bracket and makes up 26.1% of all families.
| Income Bracket | # Families | % Families |
| Less than $10,000 | 0 | 0.0% |
| $10,000 to $14,999 | 0 | 0.0% |
| $15,000 to $24,999 | 1 | 2.2% |
| $25,000 to $34,999 | 3 | 6.5% |
| $35,000 to $49,999 | 8 | 17.4% |
| $50,000 to $74,999 | 8 | 17.4% |
| $75,000 to $99,999 | 12 | 26.1% |
| $100,000 to $149,999 | 6 | 13.0% |
| $150,000 to $199,999 | 8 | 17.4% |
| $200,000+ | 0 | 0.0% |
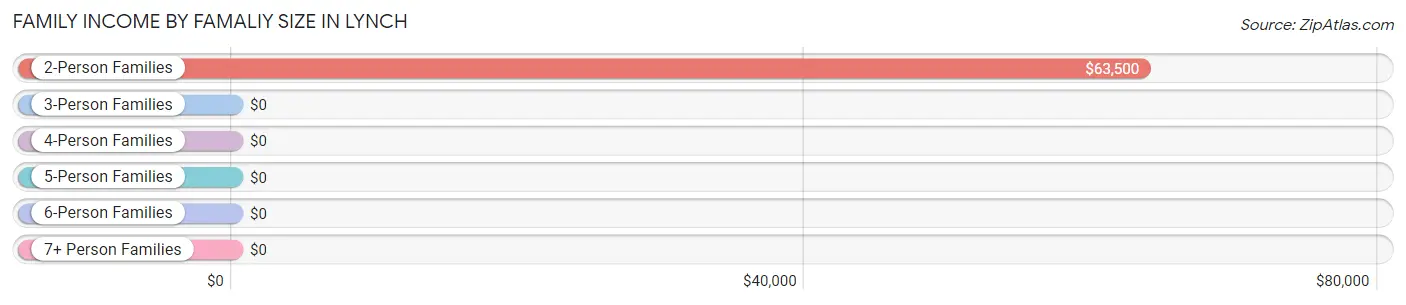
Family Income by Famaliy Size in Lynch
2-person families (34 | 73.9%) account for the highest median family income in Lynch with $63,500 per family, while 2-person families (34 | 73.9%) have the highest median income of $31,750 per family member.
| Income Bracket | # Families | Median Income |
| 2-Person Families | 34 (73.9%) | $63,500 |
| 3-Person Families | 5 (10.9%) | $0 |
| 4-Person Families | 6 (13.0%) | $0 |
| 5-Person Families | 1 (2.2%) | $0 |
| 6-Person Families | 0 (0.0%) | $0 |
| 7+ Person Families | 0 (0.0%) | $0 |
| Total | 46 (100.0%) | $76,875 |
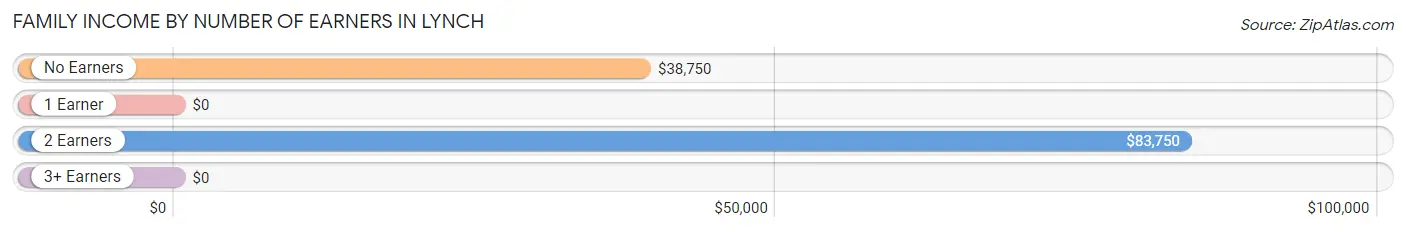
Family Income by Number of Earners in Lynch
| Number of Earners | # Families | Median Income |
| No Earners | 10 (21.7%) | $38,750 |
| 1 Earner | 7 (15.2%) | $0 |
| 2 Earners | 28 (60.9%) | $83,750 |
| 3+ Earners | 1 (2.2%) | $0 |
| Total | 46 (100.0%) | $76,875 |
Household Income in Lynch
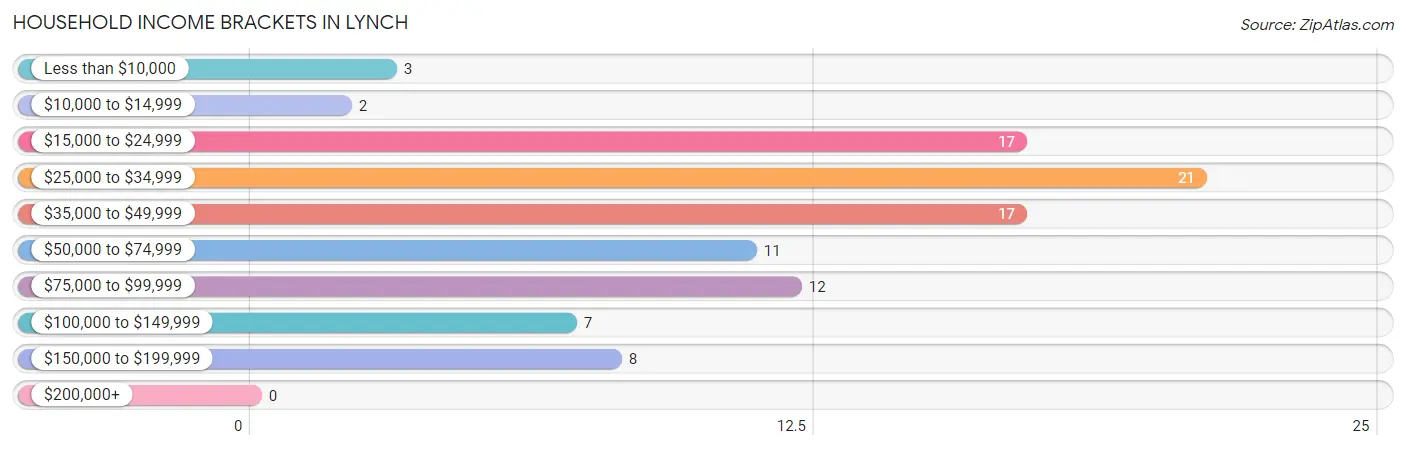
Household Income Brackets in Lynch
With 21 households falling in the category, the $25,000 to $34,999 income range is the most frequent in Lynch, accounting for 21.4% of all households.
| Income Bracket | # Households | % Households |
| Less than $10,000 | 3 | 3.1% |
| $10,000 to $14,999 | 2 | 2.0% |
| $15,000 to $24,999 | 17 | 17.3% |
| $25,000 to $34,999 | 21 | 21.4% |
| $35,000 to $49,999 | 17 | 17.3% |
| $50,000 to $74,999 | 11 | 11.2% |
| $75,000 to $99,999 | 12 | 12.2% |
| $100,000 to $149,999 | 7 | 7.1% |
| $150,000 to $199,999 | 8 | 8.2% |
| $200,000+ | 0 | 0.0% |
Household Income by Householder Age in Lynch
The median household income in Lynch is $41,667, with the highest median household income of $55,000 found in the 45 to 64 years age bracket for the primary householder. A total of 30 households (30.6%) fall into this category. Meanwhile, the 15 to 24 years age bracket for the primary householder has the lowest median household income of $0, with 2 households (2.0%) in this group.
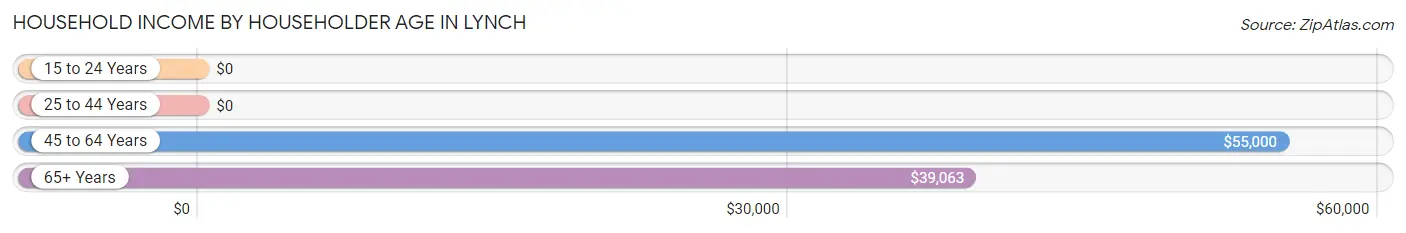
| Income Bracket | # Households | Median Income |
| 15 to 24 Years | 2 (2.0%) | $0 |
| 25 to 44 Years | 11 (11.2%) | $0 |
| 45 to 64 Years | 30 (30.6%) | $55,000 |
| 65+ Years | 55 (56.1%) | $39,063 |
| Total | 98 (100.0%) | $41,667 |
Poverty in Lynch
Income Below Poverty by Sex and Age in Lynch
With 3.2% poverty level for males and 5.3% for females among the residents of Lynch, 35 to 44 year old males and 75 year old and over females are the most vulnerable to poverty, with 2 males (40.0%) and 4 females (16.0%) in their respective age groups living below the poverty level.
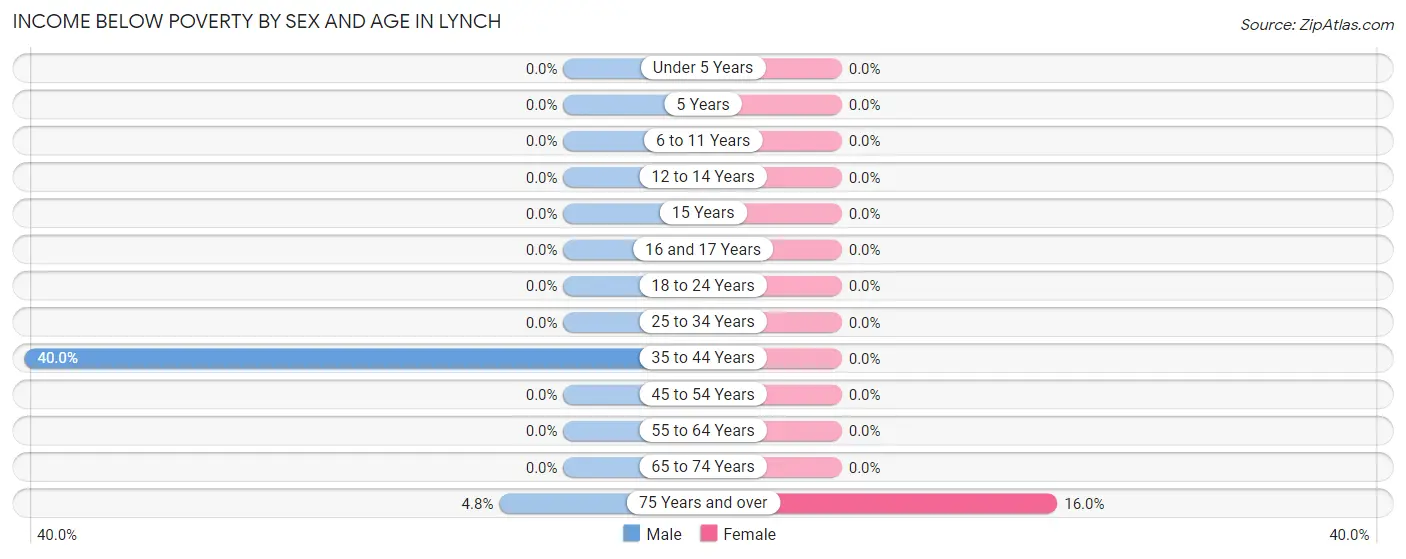
| Age Bracket | Male | Female |
| Under 5 Years | 0 (0.0%) | 0 (0.0%) |
| 5 Years | 0 (0.0%) | 0 (0.0%) |
| 6 to 11 Years | 0 (0.0%) | 0 (0.0%) |
| 12 to 14 Years | 0 (0.0%) | 0 (0.0%) |
| 15 Years | 0 (0.0%) | 0 (0.0%) |
| 16 and 17 Years | 0 (0.0%) | 0 (0.0%) |
| 18 to 24 Years | 0 (0.0%) | 0 (0.0%) |
| 25 to 34 Years | 0 (0.0%) | 0 (0.0%) |
| 35 to 44 Years | 2 (40.0%) | 0 (0.0%) |
| 45 to 54 Years | 0 (0.0%) | 0 (0.0%) |
| 55 to 64 Years | 0 (0.0%) | 0 (0.0%) |
| 65 to 74 Years | 0 (0.0%) | 0 (0.0%) |
| 75 Years and over | 1 (4.8%) | 4 (16.0%) |
| Total | 3 (3.2%) | 4 (5.3%) |
Income Above Poverty by Sex and Age in Lynch
According to the poverty statistics in Lynch, males aged 6 to 11 years and females aged 6 to 11 years are the age groups that are most secure financially, with 100.0% of males and 100.0% of females in these age groups living above the poverty line.
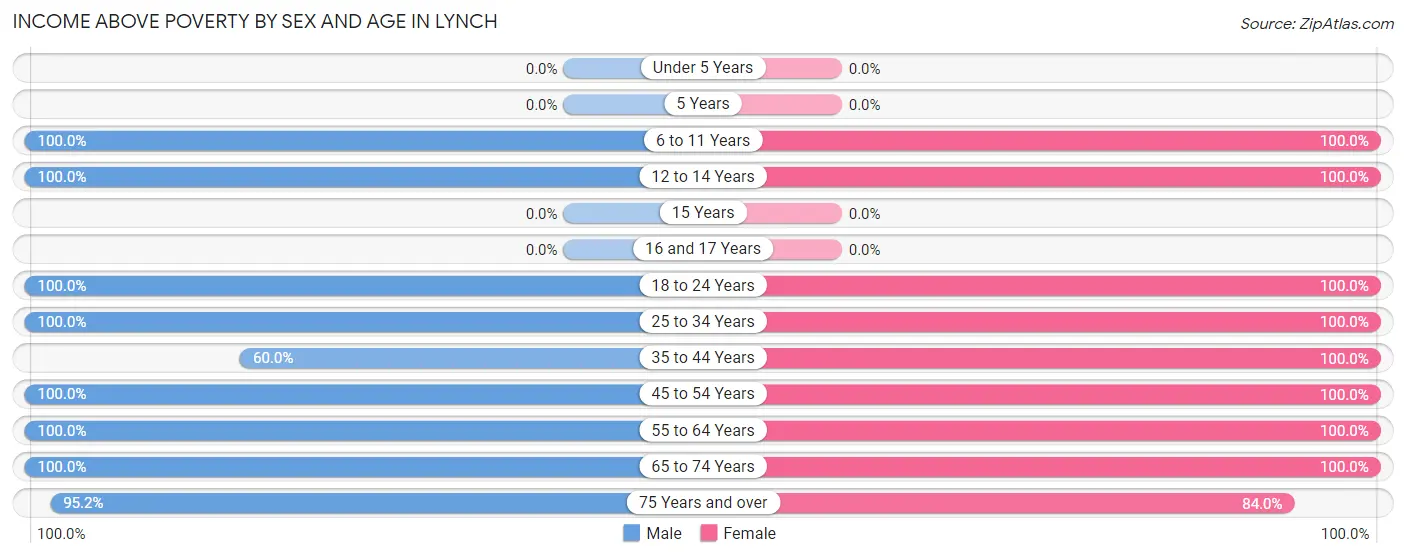
| Age Bracket | Male | Female |
| Under 5 Years | 0 (0.0%) | 0 (0.0%) |
| 5 Years | 0 (0.0%) | 0 (0.0%) |
| 6 to 11 Years | 4 (100.0%) | 2 (100.0%) |
| 12 to 14 Years | 7 (100.0%) | 5 (100.0%) |
| 15 Years | 0 (0.0%) | 0 (0.0%) |
| 16 and 17 Years | 0 (0.0%) | 0 (0.0%) |
| 18 to 24 Years | 2 (100.0%) | 1 (100.0%) |
| 25 to 34 Years | 9 (100.0%) | 1 (100.0%) |
| 35 to 44 Years | 3 (60.0%) | 4 (100.0%) |
| 45 to 54 Years | 8 (100.0%) | 1 (100.0%) |
| 55 to 64 Years | 19 (100.0%) | 19 (100.0%) |
| 65 to 74 Years | 19 (100.0%) | 17 (100.0%) |
| 75 Years and over | 20 (95.2%) | 21 (84.0%) |
| Total | 91 (96.8%) | 71 (94.7%) |
Income Below Poverty Among Married-Couple Families in Lynch
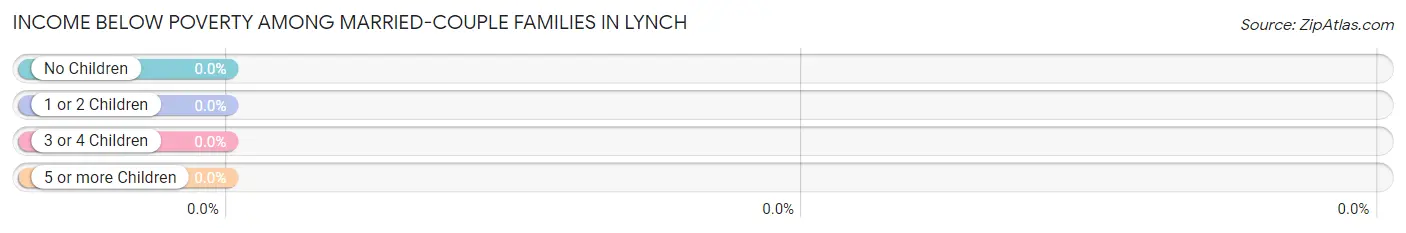
| Children | Above Poverty | Below Poverty |
| No Children | 32 (100.0%) | 0 (0.0%) |
| 1 or 2 Children | 11 (100.0%) | 0 (0.0%) |
| 3 or 4 Children | 0 (0.0%) | 0 (0.0%) |
| 5 or more Children | 0 (0.0%) | 0 (0.0%) |
| Total | 43 (100.0%) | 0 (0.0%) |
Income Below Poverty Among Single-Parent Households in Lynch
| Children | Single Father | Single Mother |
| No Children | 0 (0.0%) | 0 (0.0%) |
| 1 or 2 Children | 0 (0.0%) | 0 (0.0%) |
| 3 or 4 Children | 0 (0.0%) | 0 (0.0%) |
| 5 or more Children | 0 (0.0%) | 0 (0.0%) |
| Total | 0 (0.0%) | 0 (0.0%) |
Income Below Poverty Among Married-Couple vs Single-Parent Households in Lynch
| Children | Married-Couple Families | Single-Parent Households |
| No Children | 0 (0.0%) | 0 (0.0%) |
| 1 or 2 Children | 0 (0.0%) | 0 (0.0%) |
| 3 or 4 Children | 0 (0.0%) | 0 (0.0%) |
| 5 or more Children | 0 (0.0%) | 0 (0.0%) |
| Total | 0 (0.0%) | 0 (0.0%) |
Race in Lynch
The most populous races in Lynch are White / Caucasian (162 | 95.9%), Two or more Races (5 | 3.0%), and Some other Race (2 | 1.2%).
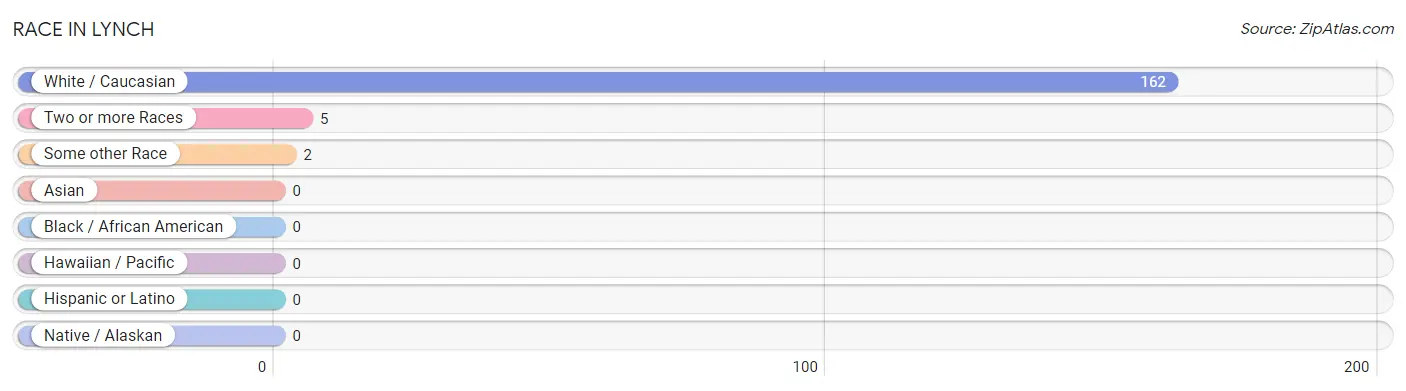
| Race | # Population | % Population |
| Asian | 0 | 0.0% |
| Black / African American | 0 | 0.0% |
| Hawaiian / Pacific | 0 | 0.0% |
| Hispanic or Latino | 0 | 0.0% |
| Native / Alaskan | 0 | 0.0% |
| White / Caucasian | 162 | 95.9% |
| Two or more Races | 5 | 3.0% |
| Some other Race | 2 | 1.2% |
| Total | 169 | 100.0% |
Ancestry in Lynch
The most populous ancestries reported in Lynch are German (76 | 45.0%), Czech (30 | 17.7%), English (24 | 14.2%), Irish (24 | 14.2%), and American (9 | 5.3%), together accounting for 96.5% of all Lynch residents.
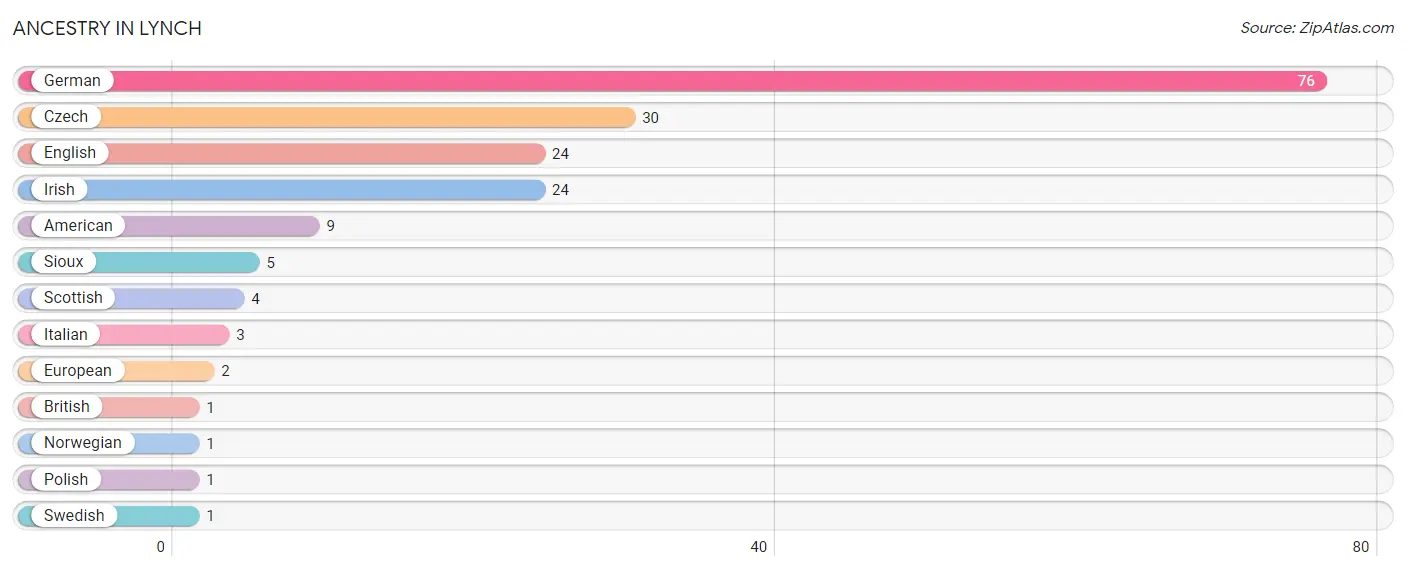
| Ancestry | # Population | % Population |
| American | 9 | 5.3% |
| British | 1 | 0.6% |
| Czech | 30 | 17.7% |
| English | 24 | 14.2% |
| European | 2 | 1.2% |
| German | 76 | 45.0% |
| Irish | 24 | 14.2% |
| Italian | 3 | 1.8% |
| Norwegian | 1 | 0.6% |
| Polish | 1 | 0.6% |
| Scottish | 4 | 2.4% |
| Sioux | 5 | 3.0% |
| Swedish | 1 | 0.6% | View All 13 Rows |
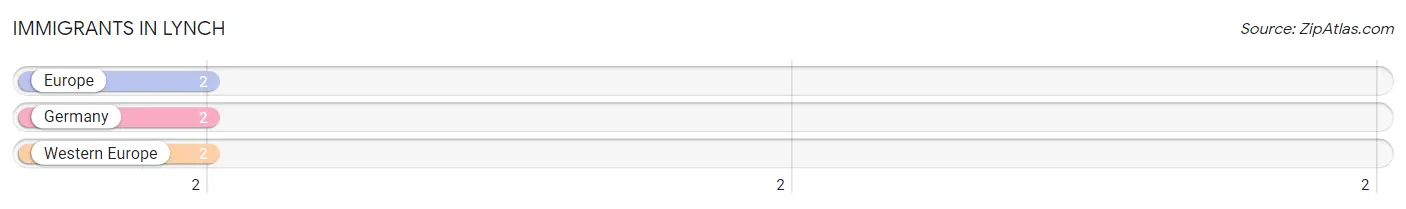
Immigrants in Lynch
The most numerous immigrant groups reported in Lynch came from Europe (2 | 1.2%), Germany (2 | 1.2%), and Western Europe (2 | 1.2%), together accounting for 3.5% of all Lynch residents.
| Immigration Origin | # Population | % Population |
| Europe | 2 | 1.2% |
| Germany | 2 | 1.2% |
| Western Europe | 2 | 1.2% | View All 3 Rows |
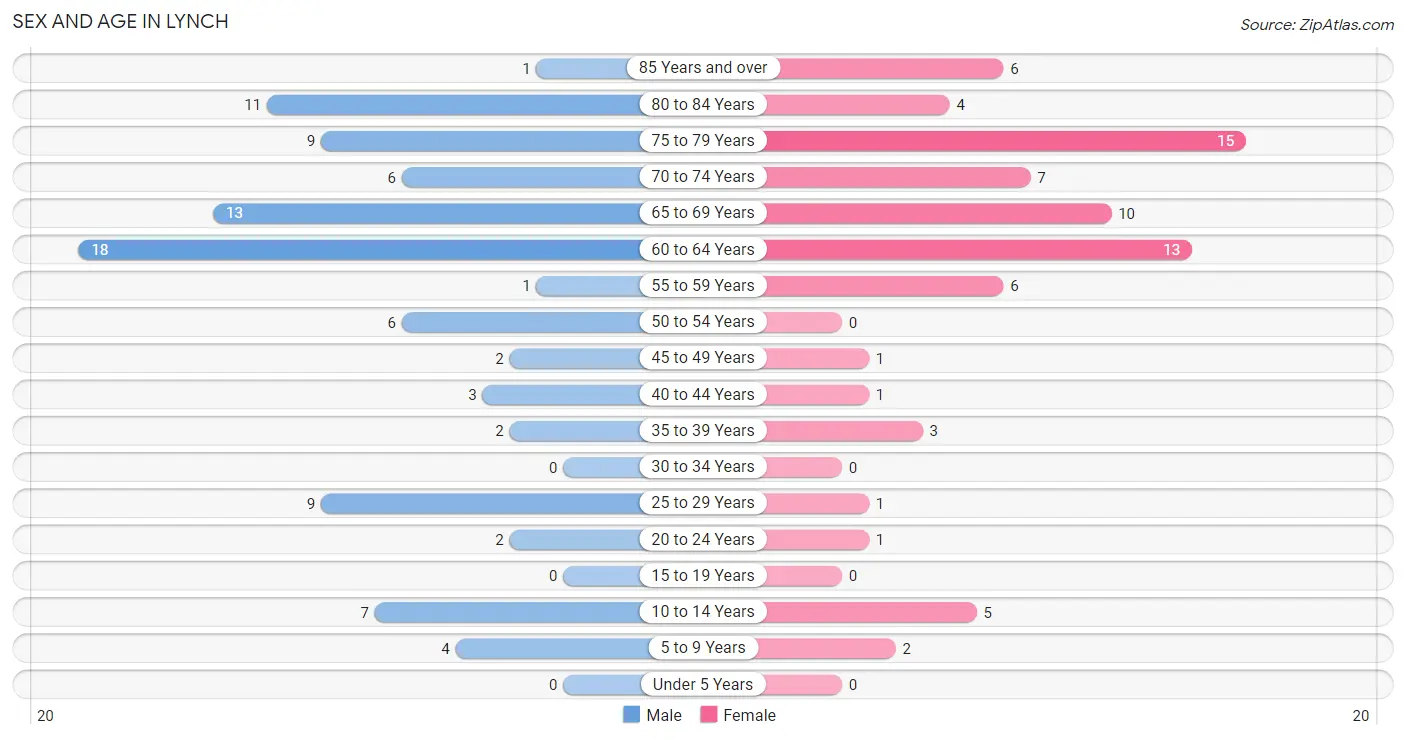
Sex and Age in Lynch
Sex and Age in Lynch
The most populous age groups in Lynch are 60 to 64 Years (18 | 19.2%) for men and 75 to 79 Years (15 | 20.0%) for women.
| Age Bracket | Male | Female |
| Under 5 Years | 0 (0.0%) | 0 (0.0%) |
| 5 to 9 Years | 4 (4.3%) | 2 (2.7%) |
| 10 to 14 Years | 7 (7.4%) | 5 (6.7%) |
| 15 to 19 Years | 0 (0.0%) | 0 (0.0%) |
| 20 to 24 Years | 2 (2.1%) | 1 (1.3%) |
| 25 to 29 Years | 9 (9.6%) | 1 (1.3%) |
| 30 to 34 Years | 0 (0.0%) | 0 (0.0%) |
| 35 to 39 Years | 2 (2.1%) | 3 (4.0%) |
| 40 to 44 Years | 3 (3.2%) | 1 (1.3%) |
| 45 to 49 Years | 2 (2.1%) | 1 (1.3%) |
| 50 to 54 Years | 6 (6.4%) | 0 (0.0%) |
| 55 to 59 Years | 1 (1.1%) | 6 (8.0%) |
| 60 to 64 Years | 18 (19.2%) | 13 (17.3%) |
| 65 to 69 Years | 13 (13.8%) | 10 (13.3%) |
| 70 to 74 Years | 6 (6.4%) | 7 (9.3%) |
| 75 to 79 Years | 9 (9.6%) | 15 (20.0%) |
| 80 to 84 Years | 11 (11.7%) | 4 (5.3%) |
| 85 Years and over | 1 (1.1%) | 6 (8.0%) |
| Total | 94 (100.0%) | 75 (100.0%) |
Families and Households in Lynch
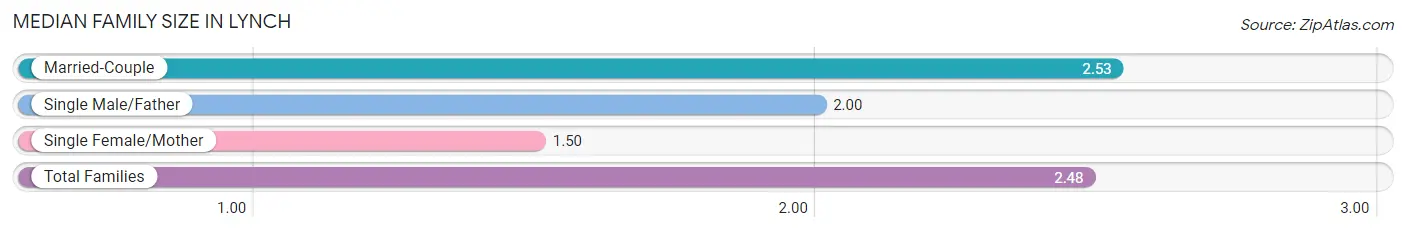
Median Family Size in Lynch
The median family size in Lynch is 2.48 persons per family, with married-couple families (43 | 93.5%) accounting for the largest median family size of 2.53 persons per family. On the other hand, single female/mother families (2 | 4.3%) represent the smallest median family size with 1.50 persons per family.
| Family Type | # Families | Family Size |
| Married-Couple | 43 (93.5%) | 2.53 |
| Single Male/Father | 1 (2.2%) | 2.00 |
| Single Female/Mother | 2 (4.3%) | 1.50 |
| Total Families | 46 (100.0%) | 2.48 |
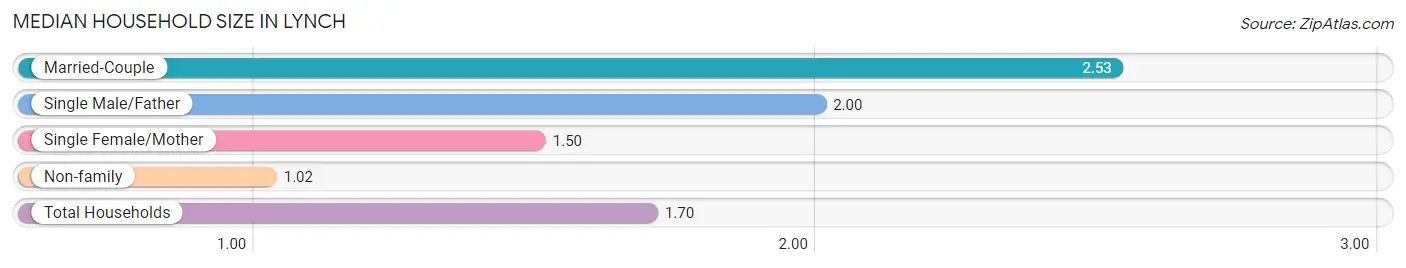
Median Household Size in Lynch
The median household size in Lynch is 1.70 persons per household, with married-couple households (43 | 43.9%) accounting for the largest median household size of 2.53 persons per household. non-family households (52 | 53.1%) represent the smallest median household size with 1.02 persons per household.
| Household Type | # Households | Household Size |
| Married-Couple | 43 (43.9%) | 2.53 |
| Single Male/Father | 1 (1.0%) | 2.00 |
| Single Female/Mother | 2 (2.0%) | 1.50 |
| Non-family | 52 (53.1%) | 1.02 |
| Total Households | 98 (100.0%) | 1.70 |
Household Size by Marriage Status in Lynch
Out of a total of 98 households in Lynch, 46 (46.9%) are family households, while 52 (53.1%) are nonfamily households. The most numerous type of family households are 2-person households, comprising 34, and the most common type of nonfamily households are 1-person households, comprising 51.
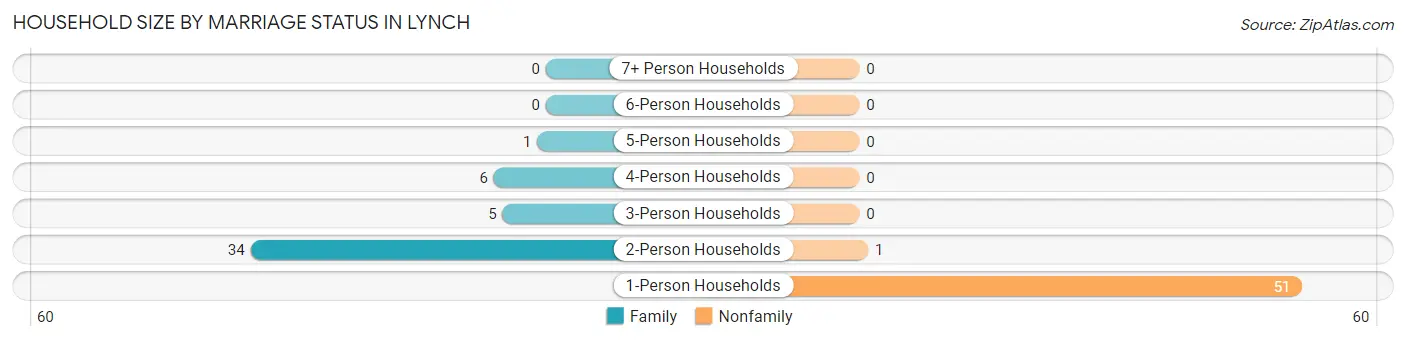
| Household Size | Family Households | Nonfamily Households |
| 1-Person Households | - | 51 (52.0%) |
| 2-Person Households | 34 (34.7%) | 1 (1.0%) |
| 3-Person Households | 5 (5.1%) | 0 (0.0%) |
| 4-Person Households | 6 (6.1%) | 0 (0.0%) |
| 5-Person Households | 1 (1.0%) | 0 (0.0%) |
| 6-Person Households | 0 (0.0%) | 0 (0.0%) |
| 7+ Person Households | 0 (0.0%) | 0 (0.0%) |
| Total | 46 (46.9%) | 52 (53.1%) |
Female Fertility in Lynch
Fertility by Age in Lynch
| Age Bracket | Women with Births | Births / 1,000 Women |
| 15 to 19 years | 0 (0.0%) | 0.0 |
| 20 to 34 years | 0 (0.0%) | 0.0 |
| 35 to 50 years | 0 (0.0%) | 0.0 |
| Total | 0 (0.0%) | 0.0 |
Fertility by Age by Marriage Status in Lynch
| Age Bracket | Married | Unmarried |
| 15 to 19 years | 0 (0.0%) | 0 (0.0%) |
| 20 to 34 years | 0 (0.0%) | 0 (0.0%) |
| 35 to 50 years | 0 (0.0%) | 0 (0.0%) |
| Total | 0 (0.0%) | 0 (0.0%) |
Fertility by Education in Lynch
| Educational Attainment | Women with Births | Births / 1,000 Women |
| Less than High School | 0 (0.0%) | 0.0 |
| High School Diploma | 0 (0.0%) | 0.0 |
| College or Associate's Degree | 0 (0.0%) | 0.0 |
| Bachelor's Degree | 0 (0.0%) | 0.0 |
| Graduate Degree | 0 (0.0%) | 0.0 |
| Total | 0 (0.0%) | 0.0 |
Fertility by Education by Marriage Status in Lynch
| Educational Attainment | Married | Unmarried |
| Less than High School | 0 (0.0%) | 0 (0.0%) |
| High School Diploma | 0 (0.0%) | 0 (0.0%) |
| College or Associate's Degree | 0 (0.0%) | 0 (0.0%) |
| Bachelor's Degree | 0 (0.0%) | 0 (0.0%) |
| Graduate Degree | 0 (0.0%) | 0 (0.0%) |
| Total | 0 (0.0%) | 0 (0.0%) |
Employment Characteristics in Lynch
Employment by Class of Employer in Lynch
Among the 89 employed individuals in Lynch, local government employees (31 | 34.8%), private company employees (21 | 23.6%), and self-employed (incorporated) (17 | 19.1%) make up the most common classes of employment.
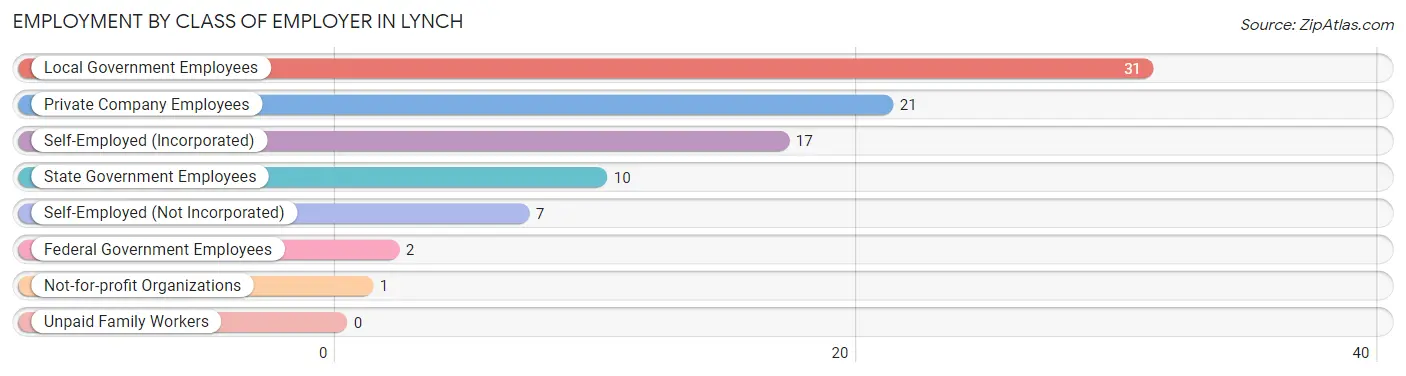
| Employer Class | # Employees | % Employees |
| Private Company Employees | 21 | 23.6% |
| Self-Employed (Incorporated) | 17 | 19.1% |
| Self-Employed (Not Incorporated) | 7 | 7.9% |
| Not-for-profit Organizations | 1 | 1.1% |
| Local Government Employees | 31 | 34.8% |
| State Government Employees | 10 | 11.2% |
| Federal Government Employees | 2 | 2.2% |
| Unpaid Family Workers | 0 | 0.0% |
| Total | 89 | 100.0% |
Employment Status by Age in Lynch
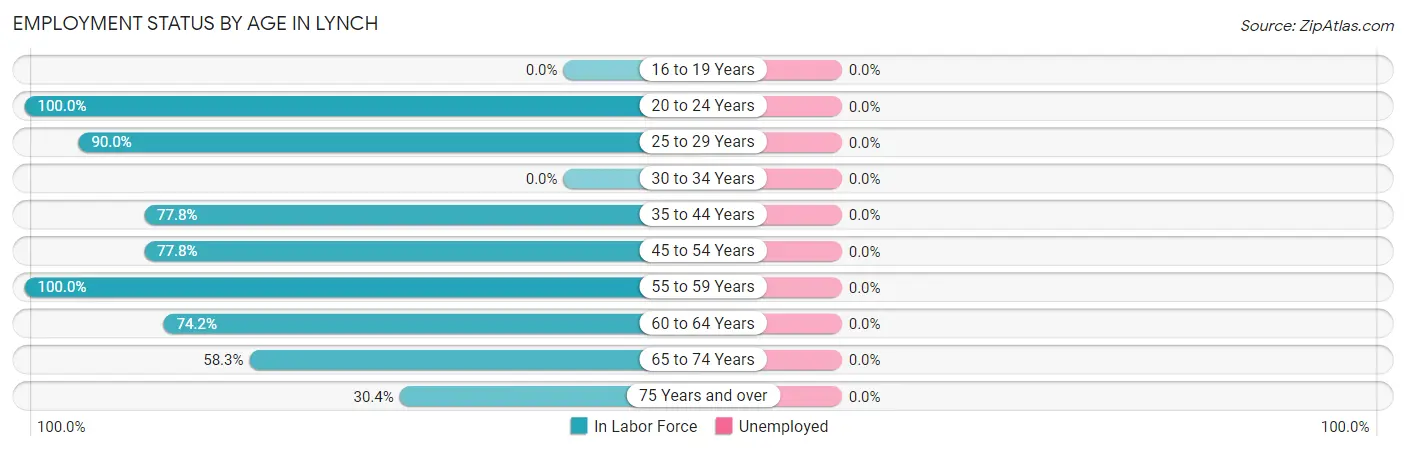
| Age Bracket | In Labor Force | Unemployed |
| 16 to 19 Years | 0 (0.0%) | 0 (0.0%) |
| 20 to 24 Years | 3 (100.0%) | 0 (0.0%) |
| 25 to 29 Years | 9 (90.0%) | 0 (0.0%) |
| 30 to 34 Years | 0 (0.0%) | 0 (0.0%) |
| 35 to 44 Years | 7 (77.8%) | 0 (0.0%) |
| 45 to 54 Years | 7 (77.8%) | 0 (0.0%) |
| 55 to 59 Years | 7 (100.0%) | 0 (0.0%) |
| 60 to 64 Years | 23 (74.2%) | 0 (0.0%) |
| 65 to 74 Years | 21 (58.3%) | 0 (0.0%) |
| 75 Years and over | 14 (30.4%) | 0 (0.0%) |
| Total | 91 (60.3%) | 0 (0.0%) |
Employment Status by Educational Attainment in Lynch
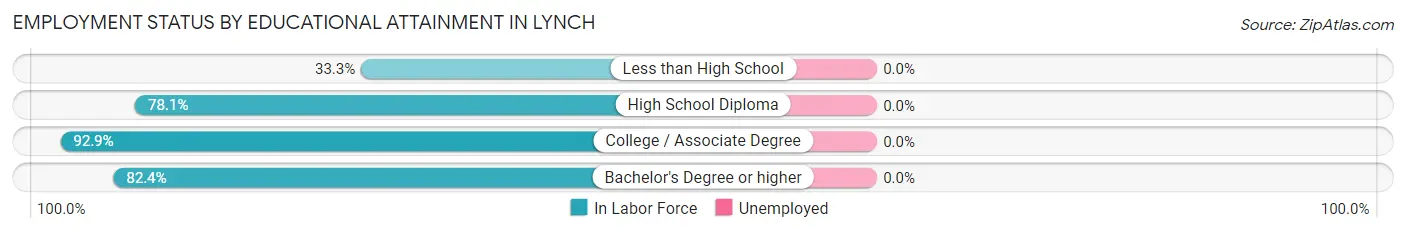
| Educational Attainment | In Labor Force | Unemployed |
| Less than High School | 1 (33.3%) | 0 (0.0%) |
| High School Diploma | 25 (78.1%) | 0 (0.0%) |
| College / Associate Degree | 13 (92.9%) | 0 (0.0%) |
| Bachelor's Degree or higher | 14 (82.4%) | 0 (0.0%) |
| Total | 53 (80.3%) | 0 (0.0%) |
Employment Occupations by Sex in Lynch
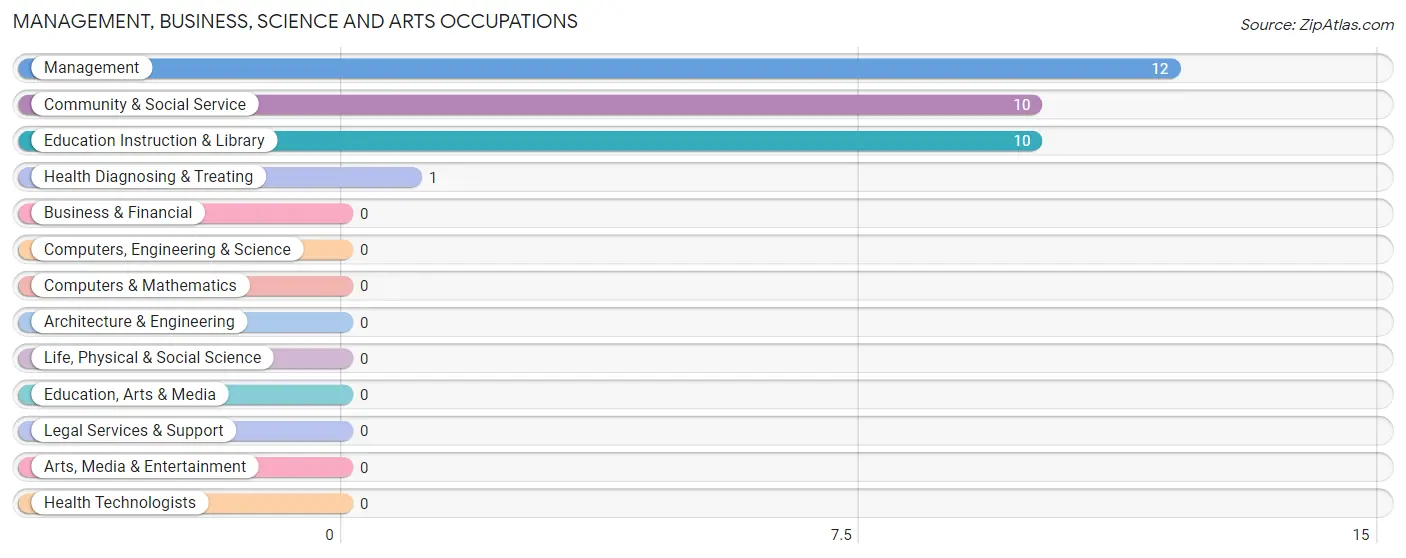
Management, Business, Science and Arts Occupations
The most common Management, Business, Science and Arts occupations in Lynch are Management (12 | 13.2%), Community & Social Service (10 | 11.0%), Education Instruction & Library (10 | 11.0%), and Health Diagnosing & Treating (1 | 1.1%).
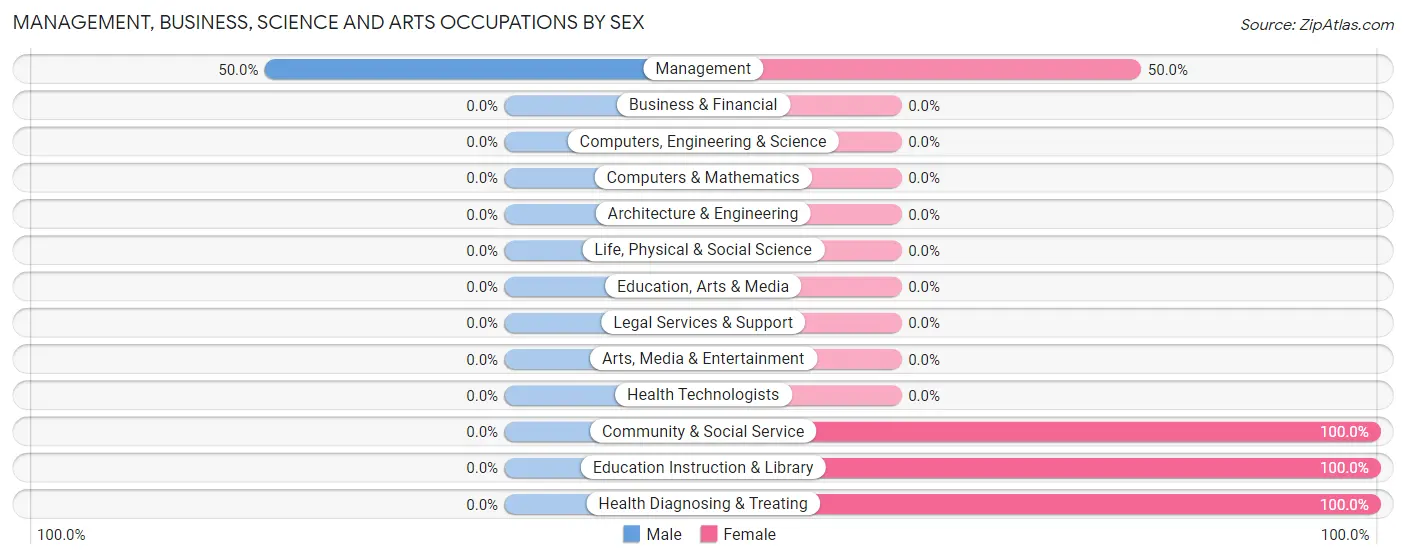
Management, Business, Science and Arts Occupations by Sex
| Occupation | Male | Female |
| Management | 6 (50.0%) | 6 (50.0%) |
| Business & Financial | 0 (0.0%) | 0 (0.0%) |
| Computers, Engineering & Science | 0 (0.0%) | 0 (0.0%) |
| Computers & Mathematics | 0 (0.0%) | 0 (0.0%) |
| Architecture & Engineering | 0 (0.0%) | 0 (0.0%) |
| Life, Physical & Social Science | 0 (0.0%) | 0 (0.0%) |
| Community & Social Service | 0 (0.0%) | 10 (100.0%) |
| Education, Arts & Media | 0 (0.0%) | 0 (0.0%) |
| Legal Services & Support | 0 (0.0%) | 0 (0.0%) |
| Education Instruction & Library | 0 (0.0%) | 10 (100.0%) |
| Arts, Media & Entertainment | 0 (0.0%) | 0 (0.0%) |
| Health Diagnosing & Treating | 0 (0.0%) | 1 (100.0%) |
| Health Technologists | 0 (0.0%) | 0 (0.0%) |
| Total (Category) | 6 (26.1%) | 17 (73.9%) |
| Total (Overall) | 57 (62.6%) | 34 (37.4%) |
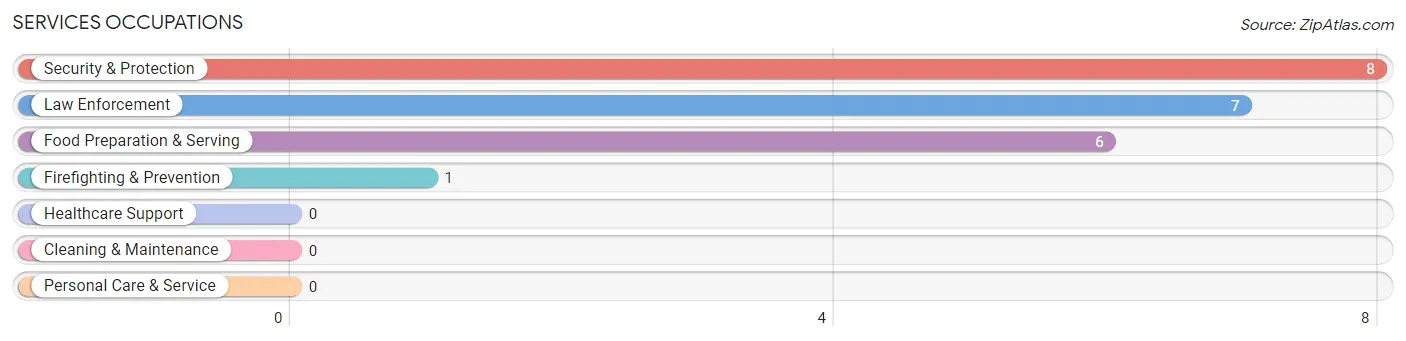
Services Occupations
The most common Services occupations in Lynch are Security & Protection (8 | 8.8%), Law Enforcement (7 | 7.7%), Food Preparation & Serving (6 | 6.6%), and Firefighting & Prevention (1 | 1.1%).
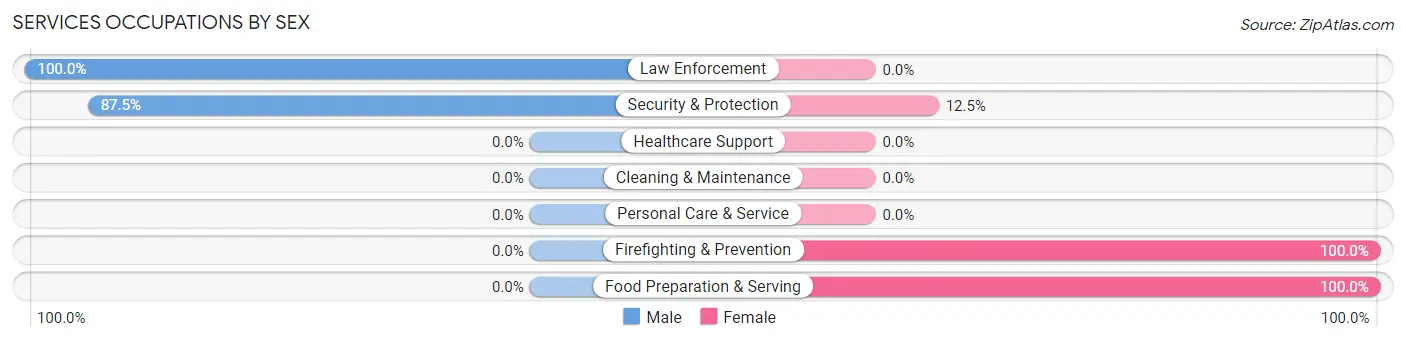
Services Occupations by Sex
Within the Services occupations in Lynch, the most male-oriented occupations are Law Enforcement (100.0%), and Security & Protection (87.5%), while the most female-oriented occupations are Firefighting & Prevention (100.0%), Food Preparation & Serving (100.0%), and Security & Protection (12.5%).
| Occupation | Male | Female |
| Healthcare Support | 0 (0.0%) | 0 (0.0%) |
| Security & Protection | 7 (87.5%) | 1 (12.5%) |
| Firefighting & Prevention | 0 (0.0%) | 1 (100.0%) |
| Law Enforcement | 7 (100.0%) | 0 (0.0%) |
| Food Preparation & Serving | 0 (0.0%) | 6 (100.0%) |
| Cleaning & Maintenance | 0 (0.0%) | 0 (0.0%) |
| Personal Care & Service | 0 (0.0%) | 0 (0.0%) |
| Total (Category) | 7 (50.0%) | 7 (50.0%) |
| Total (Overall) | 57 (62.6%) | 34 (37.4%) |
Sales and Office Occupations
The most common Sales and Office occupations in Lynch are Office & Administration (10 | 11.0%), and Sales & Related (1 | 1.1%).
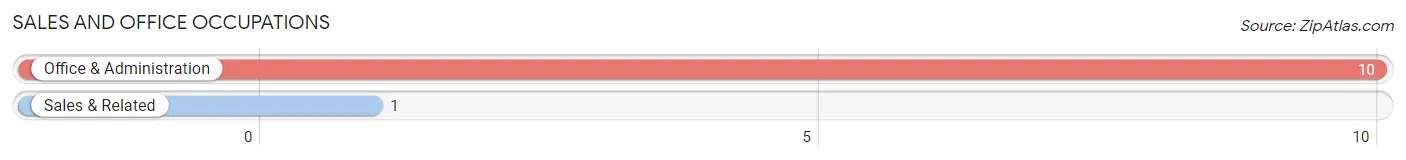
Sales and Office Occupations by Sex

| Occupation | Male | Female |
| Sales & Related | 1 (100.0%) | 0 (0.0%) |
| Office & Administration | 7 (70.0%) | 3 (30.0%) |
| Total (Category) | 8 (72.7%) | 3 (27.3%) |
| Total (Overall) | 57 (62.6%) | 34 (37.4%) |
Natural Resources, Construction and Maintenance Occupations
The most common Natural Resources, Construction and Maintenance occupations in Lynch are Construction & Extraction (14 | 15.4%), Farming, Fishing & Forestry (4 | 4.4%), and Installation, Maintenance & Repair (1 | 1.1%).
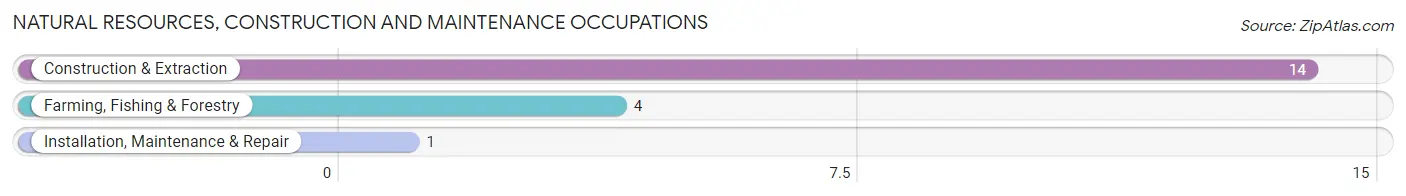
Natural Resources, Construction and Maintenance Occupations by Sex
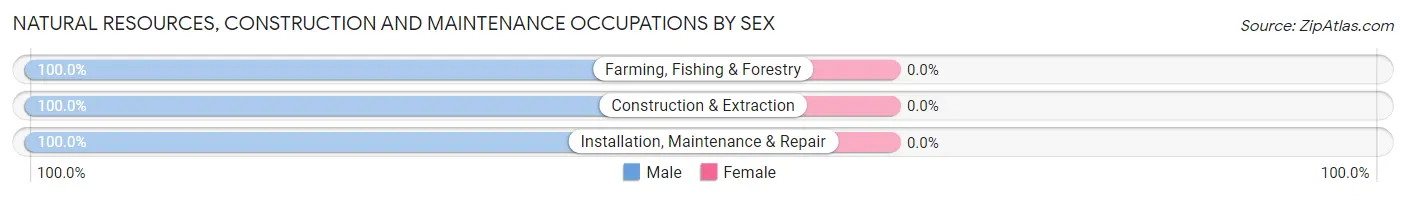
| Occupation | Male | Female |
| Farming, Fishing & Forestry | 4 (100.0%) | 0 (0.0%) |
| Construction & Extraction | 14 (100.0%) | 0 (0.0%) |
| Installation, Maintenance & Repair | 1 (100.0%) | 0 (0.0%) |
| Total (Category) | 19 (100.0%) | 0 (0.0%) |
| Total (Overall) | 57 (62.6%) | 34 (37.4%) |
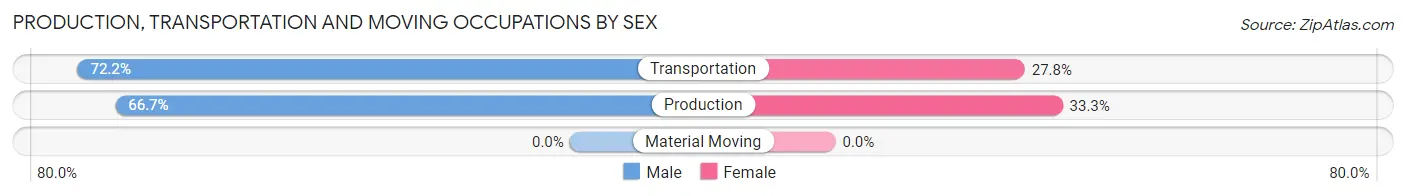
Production, Transportation and Moving Occupations
The most common Production, Transportation and Moving occupations in Lynch are Transportation (18 | 19.8%), and Production (6 | 6.6%).
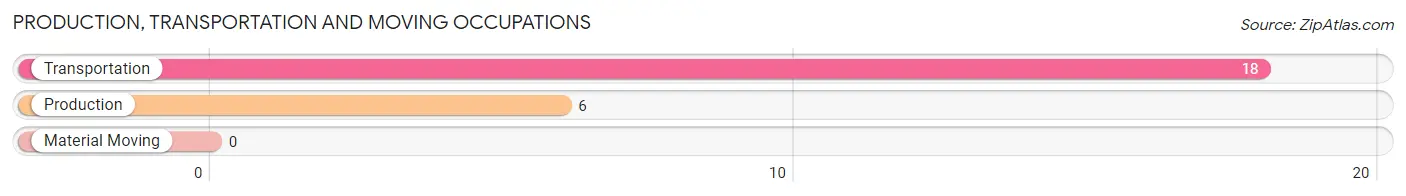
Production, Transportation and Moving Occupations by Sex
| Occupation | Male | Female |
| Production | 4 (66.7%) | 2 (33.3%) |
| Transportation | 13 (72.2%) | 5 (27.8%) |
| Material Moving | 0 (0.0%) | 0 (0.0%) |
| Total (Category) | 17 (70.8%) | 7 (29.2%) |
| Total (Overall) | 57 (62.6%) | 34 (37.4%) |
Employment Industries by Sex in Lynch
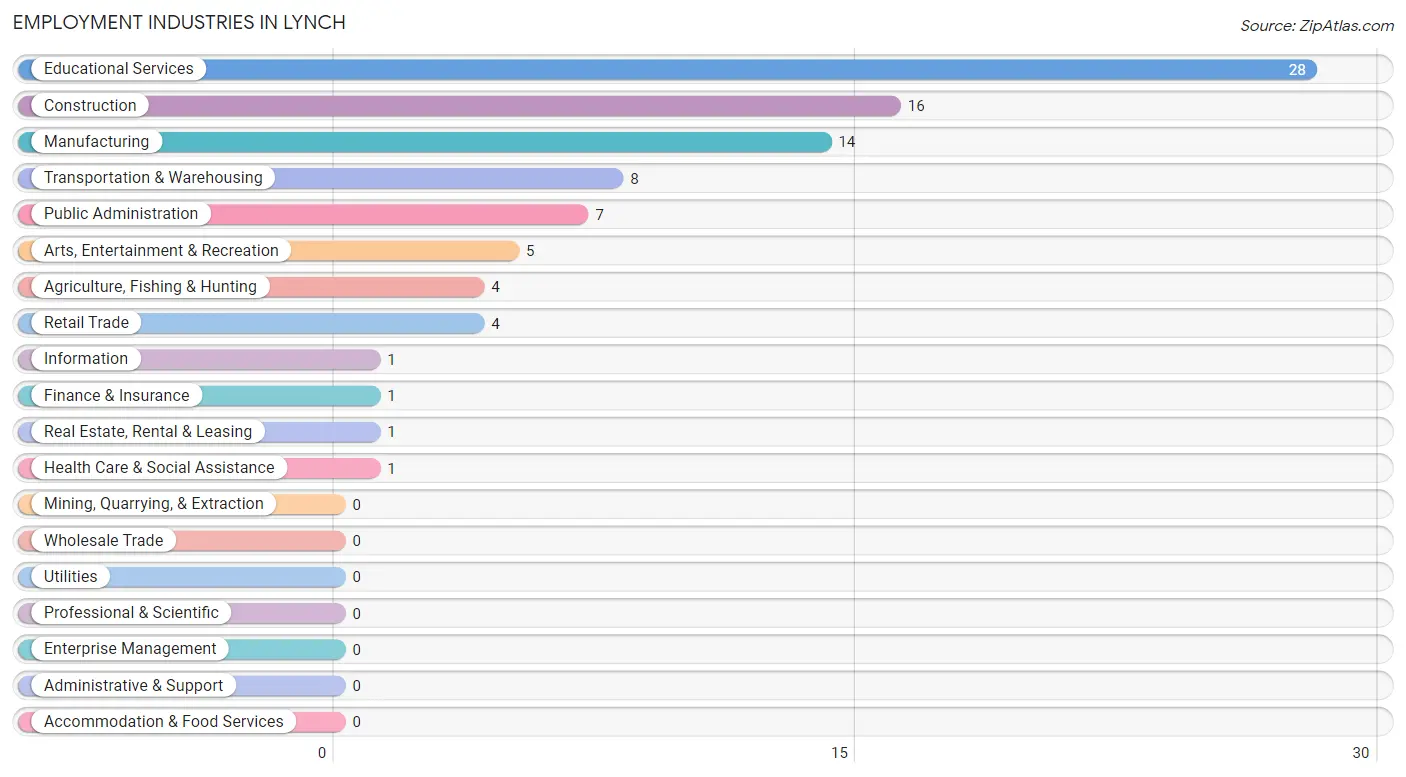
Employment Industries in Lynch
The major employment industries in Lynch include Educational Services (28 | 30.8%), Construction (16 | 17.6%), Manufacturing (14 | 15.4%), Transportation & Warehousing (8 | 8.8%), and Public Administration (7 | 7.7%).
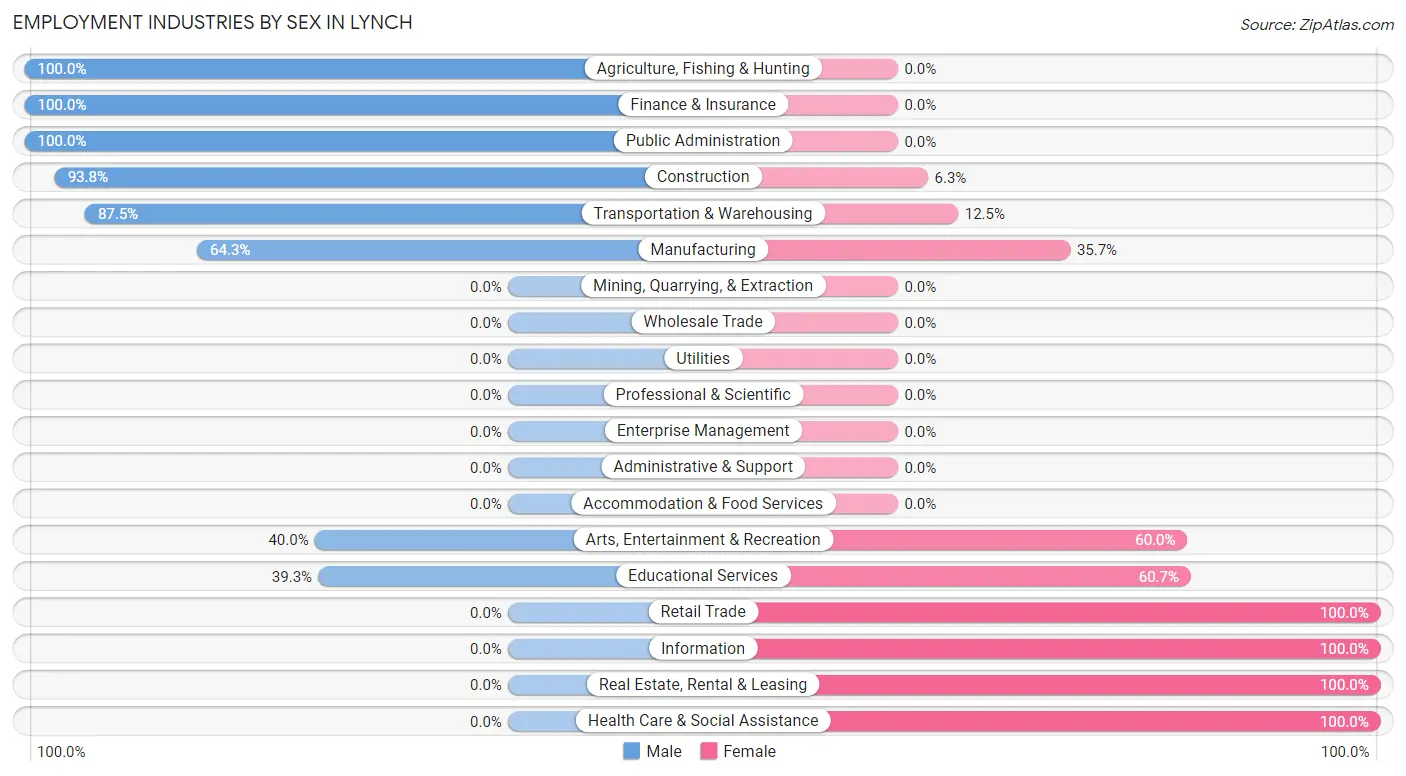
Employment Industries by Sex in Lynch
The Lynch industries that see more men than women are Agriculture, Fishing & Hunting (100.0%), Finance & Insurance (100.0%), and Public Administration (100.0%), whereas the industries that tend to have a higher number of women are Retail Trade (100.0%), Information (100.0%), and Real Estate, Rental & Leasing (100.0%).
| Industry | Male | Female |
| Agriculture, Fishing & Hunting | 4 (100.0%) | 0 (0.0%) |
| Mining, Quarrying, & Extraction | 0 (0.0%) | 0 (0.0%) |
| Construction | 15 (93.8%) | 1 (6.2%) |
| Manufacturing | 9 (64.3%) | 5 (35.7%) |
| Wholesale Trade | 0 (0.0%) | 0 (0.0%) |
| Retail Trade | 0 (0.0%) | 4 (100.0%) |
| Transportation & Warehousing | 7 (87.5%) | 1 (12.5%) |
| Utilities | 0 (0.0%) | 0 (0.0%) |
| Information | 0 (0.0%) | 1 (100.0%) |
| Finance & Insurance | 1 (100.0%) | 0 (0.0%) |
| Real Estate, Rental & Leasing | 0 (0.0%) | 1 (100.0%) |
| Professional & Scientific | 0 (0.0%) | 0 (0.0%) |
| Enterprise Management | 0 (0.0%) | 0 (0.0%) |
| Administrative & Support | 0 (0.0%) | 0 (0.0%) |
| Educational Services | 11 (39.3%) | 17 (60.7%) |
| Health Care & Social Assistance | 0 (0.0%) | 1 (100.0%) |
| Arts, Entertainment & Recreation | 2 (40.0%) | 3 (60.0%) |
| Accommodation & Food Services | 0 (0.0%) | 0 (0.0%) |
| Public Administration | 7 (100.0%) | 0 (0.0%) |
| Total | 57 (62.6%) | 34 (37.4%) |
Education in Lynch
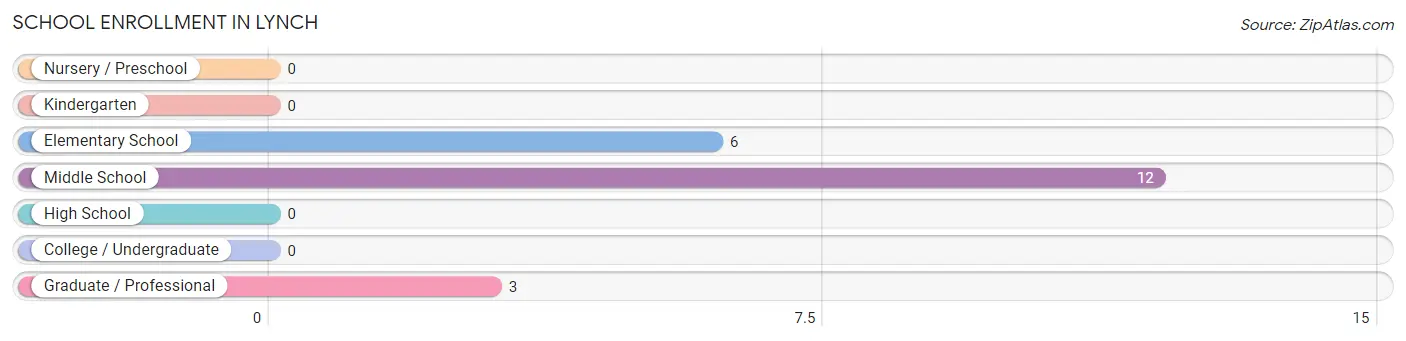
School Enrollment in Lynch
The most common levels of schooling among the 21 students in Lynch are middle school (12 | 57.1%), elementary school (6 | 28.6%), and graduate / professional (3 | 14.3%).
| School Level | # Students | % Students |
| Nursery / Preschool | 0 | 0.0% |
| Kindergarten | 0 | 0.0% |
| Elementary School | 6 | 28.6% |
| Middle School | 12 | 57.1% |
| High School | 0 | 0.0% |
| College / Undergraduate | 0 | 0.0% |
| Graduate / Professional | 3 | 14.3% |
| Total | 21 | 100.0% |
School Enrollment by Age by Funding Source in Lynch
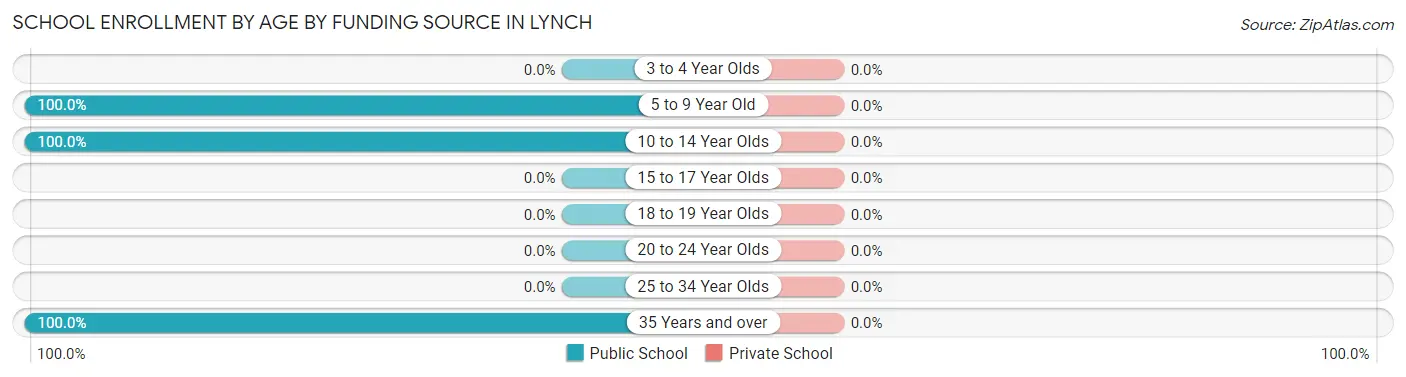
| Age Bracket | Public School | Private School |
| 3 to 4 Year Olds | 0 (0.0%) | 0 (0.0%) |
| 5 to 9 Year Old | 6 (100.0%) | 0 (0.0%) |
| 10 to 14 Year Olds | 12 (100.0%) | 0 (0.0%) |
| 15 to 17 Year Olds | 0 (0.0%) | 0 (0.0%) |
| 18 to 19 Year Olds | 0 (0.0%) | 0 (0.0%) |
| 20 to 24 Year Olds | 0 (0.0%) | 0 (0.0%) |
| 25 to 34 Year Olds | 0 (0.0%) | 0 (0.0%) |
| 35 Years and over | 3 (100.0%) | 0 (0.0%) |
| Total | 21 (100.0%) | 0 (0.0%) |
Educational Attainment by Field of Study in Lynch
Arts & humanities (12 | 28.6%), business (8 | 19.1%), science & technology (6 | 14.3%), education (6 | 14.3%), and bio, nature & agricultural (4 | 9.5%) are the most common fields of study among 42 individuals in Lynch who have obtained a bachelor's degree or higher.
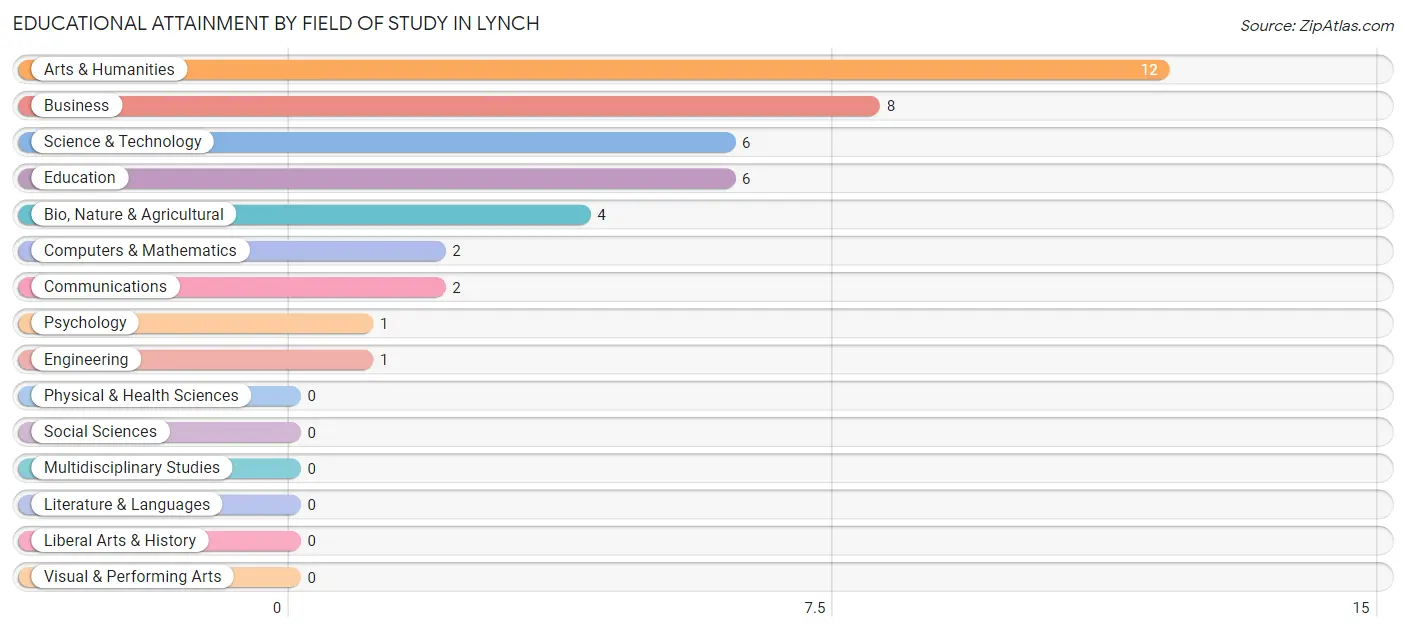
| Field of Study | # Graduates | % Graduates |
| Computers & Mathematics | 2 | 4.8% |
| Bio, Nature & Agricultural | 4 | 9.5% |
| Physical & Health Sciences | 0 | 0.0% |
| Psychology | 1 | 2.4% |
| Social Sciences | 0 | 0.0% |
| Engineering | 1 | 2.4% |
| Multidisciplinary Studies | 0 | 0.0% |
| Science & Technology | 6 | 14.3% |
| Business | 8 | 19.1% |
| Education | 6 | 14.3% |
| Literature & Languages | 0 | 0.0% |
| Liberal Arts & History | 0 | 0.0% |
| Visual & Performing Arts | 0 | 0.0% |
| Communications | 2 | 4.8% |
| Arts & Humanities | 12 | 28.6% |
| Total | 42 | 100.0% |
Transportation & Commute in Lynch
Vehicle Availability by Sex in Lynch
The most prevalent vehicle ownership categories in Lynch are males with 2 vehicles (22, accounting for 40.0%) and females with 2 vehicles (19, making up 64.7%).
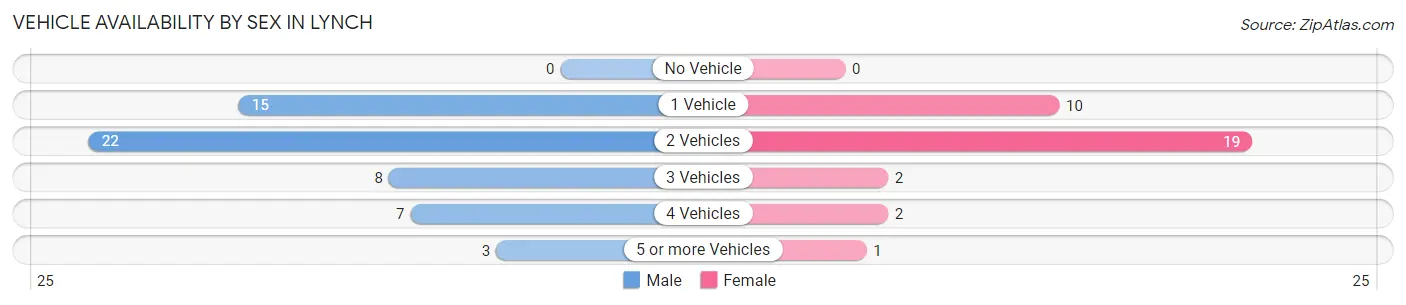
| Vehicles Available | Male | Female |
| No Vehicle | 0 (0.0%) | 0 (0.0%) |
| 1 Vehicle | 15 (27.3%) | 10 (29.4%) |
| 2 Vehicles | 22 (40.0%) | 19 (55.9%) |
| 3 Vehicles | 8 (14.5%) | 2 (5.9%) |
| 4 Vehicles | 7 (12.7%) | 2 (5.9%) |
| 5 or more Vehicles | 3 (5.4%) | 1 (2.9%) |
| Total | 55 (100.0%) | 34 (100.0%) |
Commute Time in Lynch
The most frequently occuring commute durations in Lynch are 5 to 9 minutes (21 commuters, 25.3%), less than 5 minutes (20 commuters, 24.1%), and 15 to 19 minutes (11 commuters, 13.3%).
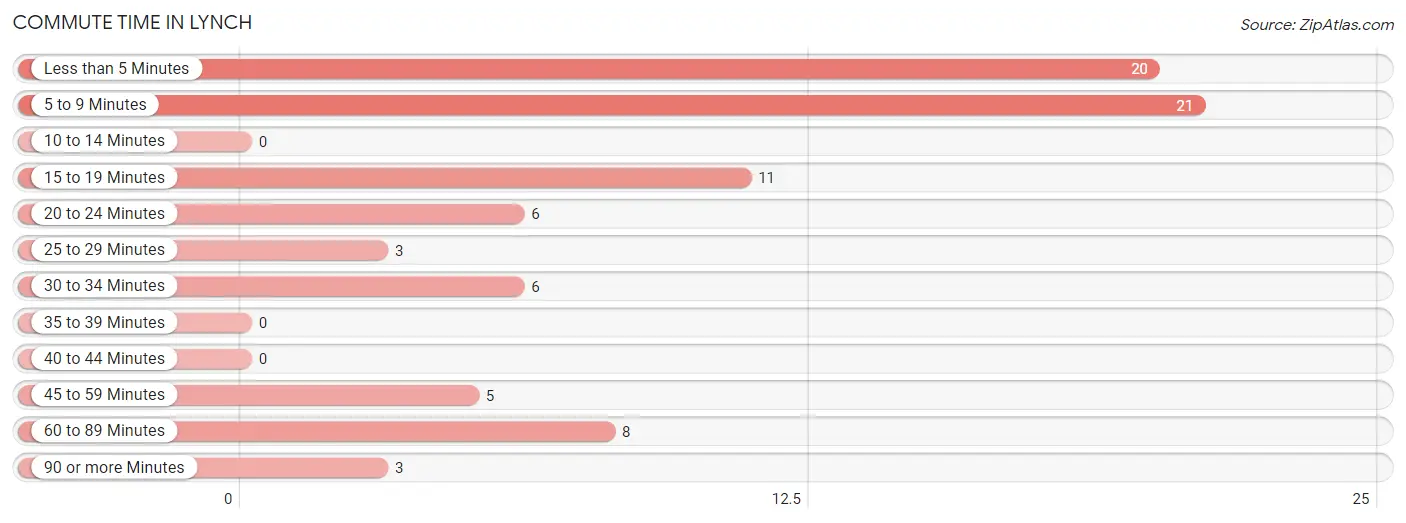
| Commute Time | # Commuters | % Commuters |
| Less than 5 Minutes | 20 | 24.1% |
| 5 to 9 Minutes | 21 | 25.3% |
| 10 to 14 Minutes | 0 | 0.0% |
| 15 to 19 Minutes | 11 | 13.3% |
| 20 to 24 Minutes | 6 | 7.2% |
| 25 to 29 Minutes | 3 | 3.6% |
| 30 to 34 Minutes | 6 | 7.2% |
| 35 to 39 Minutes | 0 | 0.0% |
| 40 to 44 Minutes | 0 | 0.0% |
| 45 to 59 Minutes | 5 | 6.0% |
| 60 to 89 Minutes | 8 | 9.6% |
| 90 or more Minutes | 3 | 3.6% |
Commute Time by Sex in Lynch
The most common commute times in Lynch are 5 to 9 minutes (10 commuters, 20.4%) for males and less than 5 minutes (14 commuters, 41.2%) for females.
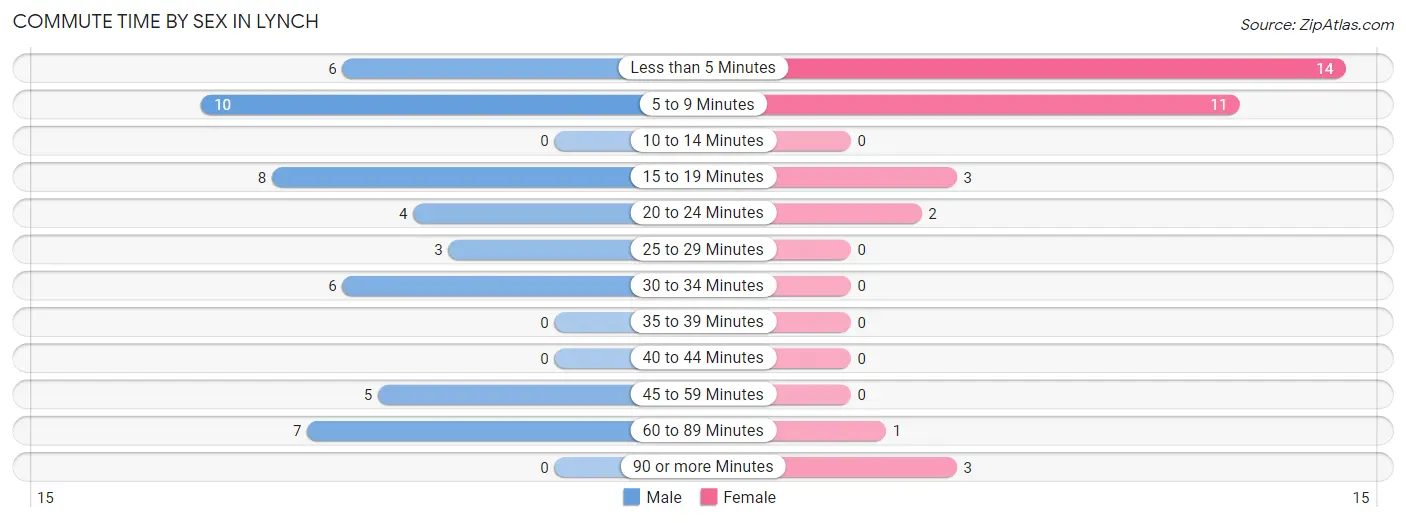
| Commute Time | Male | Female |
| Less than 5 Minutes | 6 (12.2%) | 14 (41.2%) |
| 5 to 9 Minutes | 10 (20.4%) | 11 (32.4%) |
| 10 to 14 Minutes | 0 (0.0%) | 0 (0.0%) |
| 15 to 19 Minutes | 8 (16.3%) | 3 (8.8%) |
| 20 to 24 Minutes | 4 (8.2%) | 2 (5.9%) |
| 25 to 29 Minutes | 3 (6.1%) | 0 (0.0%) |
| 30 to 34 Minutes | 6 (12.2%) | 0 (0.0%) |
| 35 to 39 Minutes | 0 (0.0%) | 0 (0.0%) |
| 40 to 44 Minutes | 0 (0.0%) | 0 (0.0%) |
| 45 to 59 Minutes | 5 (10.2%) | 0 (0.0%) |
| 60 to 89 Minutes | 7 (14.3%) | 1 (2.9%) |
| 90 or more Minutes | 0 (0.0%) | 3 (8.8%) |
Time of Departure to Work by Sex in Lynch
The most frequent times of departure to work in Lynch are 5:30 AM to 5:59 AM (16, 32.7%) for males and 7:30 AM to 7:59 AM (8, 23.5%) for females.
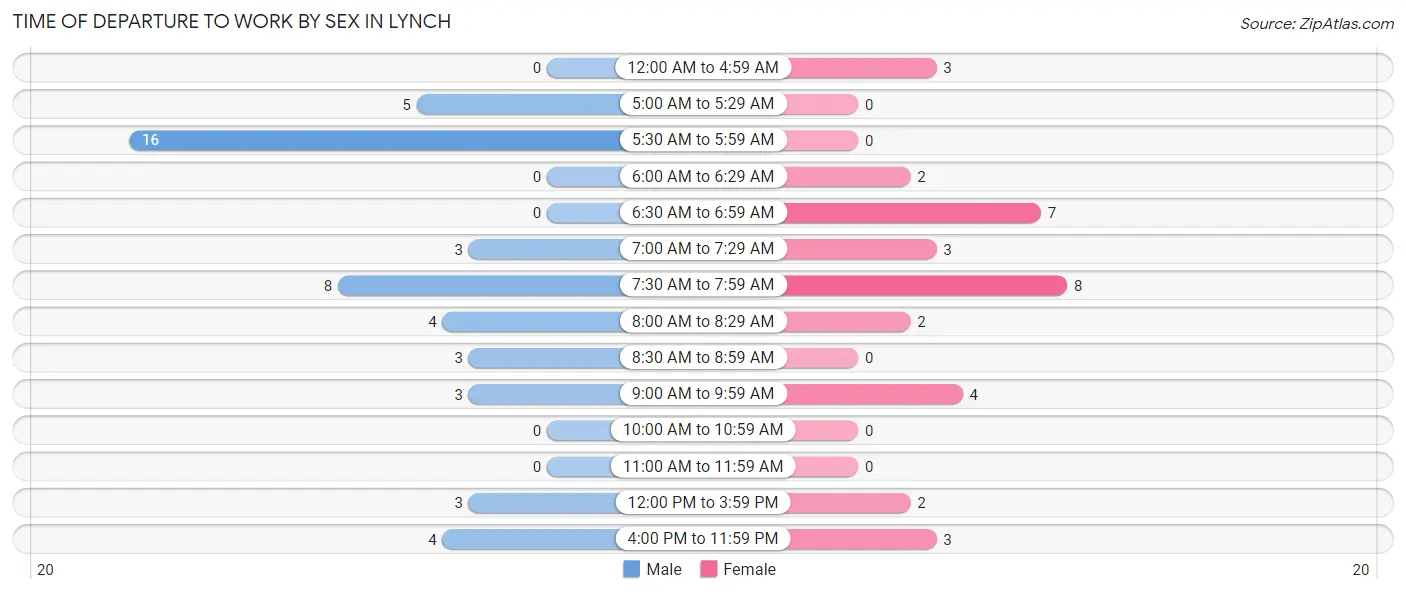
| Time of Departure | Male | Female |
| 12:00 AM to 4:59 AM | 0 (0.0%) | 3 (8.8%) |
| 5:00 AM to 5:29 AM | 5 (10.2%) | 0 (0.0%) |
| 5:30 AM to 5:59 AM | 16 (32.7%) | 0 (0.0%) |
| 6:00 AM to 6:29 AM | 0 (0.0%) | 2 (5.9%) |
| 6:30 AM to 6:59 AM | 0 (0.0%) | 7 (20.6%) |
| 7:00 AM to 7:29 AM | 3 (6.1%) | 3 (8.8%) |
| 7:30 AM to 7:59 AM | 8 (16.3%) | 8 (23.5%) |
| 8:00 AM to 8:29 AM | 4 (8.2%) | 2 (5.9%) |
| 8:30 AM to 8:59 AM | 3 (6.1%) | 0 (0.0%) |
| 9:00 AM to 9:59 AM | 3 (6.1%) | 4 (11.8%) |
| 10:00 AM to 10:59 AM | 0 (0.0%) | 0 (0.0%) |
| 11:00 AM to 11:59 AM | 0 (0.0%) | 0 (0.0%) |
| 12:00 PM to 3:59 PM | 3 (6.1%) | 2 (5.9%) |
| 4:00 PM to 11:59 PM | 4 (8.2%) | 3 (8.8%) |
| Total | 49 (100.0%) | 34 (100.0%) |
Housing Occupancy in Lynch
Occupancy by Ownership in Lynch
Of the total 98 dwellings in Lynch, owner-occupied units account for 87 (88.8%), while renter-occupied units make up 11 (11.2%).
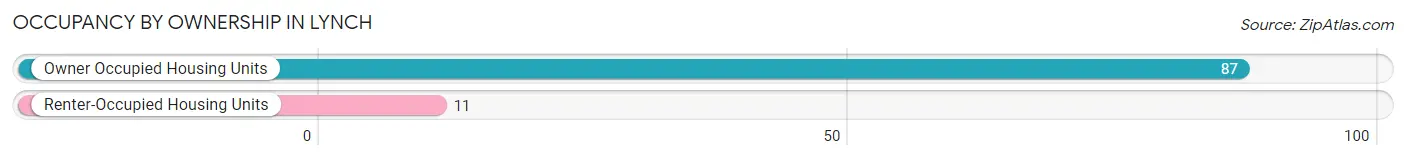
| Occupancy | # Housing Units | % Housing Units |
| Owner Occupied Housing Units | 87 | 88.8% |
| Renter-Occupied Housing Units | 11 | 11.2% |
| Total Occupied Housing Units | 98 | 100.0% |
Occupancy by Household Size in Lynch
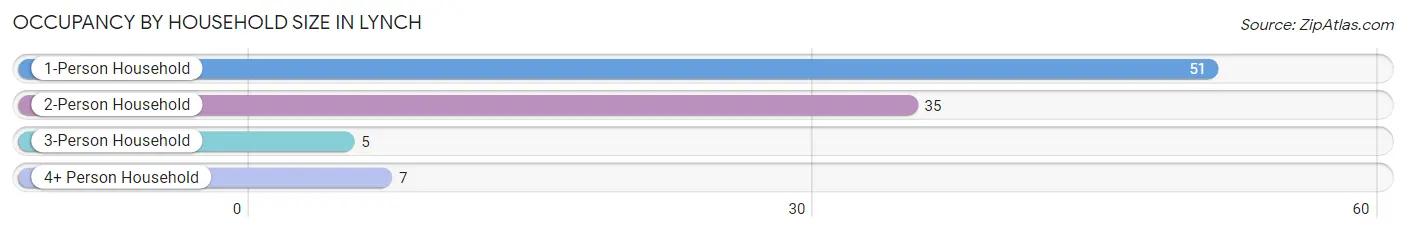
| Household Size | # Housing Units | % Housing Units |
| 1-Person Household | 51 | 52.0% |
| 2-Person Household | 35 | 35.7% |
| 3-Person Household | 5 | 5.1% |
| 4+ Person Household | 7 | 7.1% |
| Total Housing Units | 98 | 100.0% |
Occupancy by Ownership by Household Size in Lynch
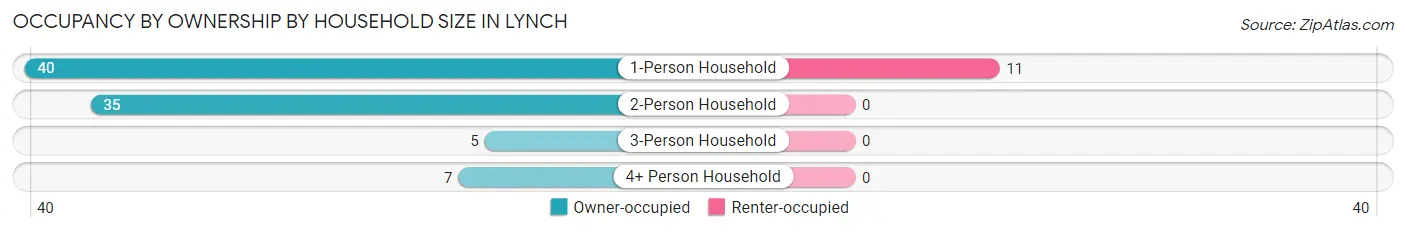
| Household Size | Owner-occupied | Renter-occupied |
| 1-Person Household | 40 (78.4%) | 11 (21.6%) |
| 2-Person Household | 35 (100.0%) | 0 (0.0%) |
| 3-Person Household | 5 (100.0%) | 0 (0.0%) |
| 4+ Person Household | 7 (100.0%) | 0 (0.0%) |
| Total Housing Units | 87 (88.8%) | 11 (11.2%) |
Occupancy by Educational Attainment in Lynch
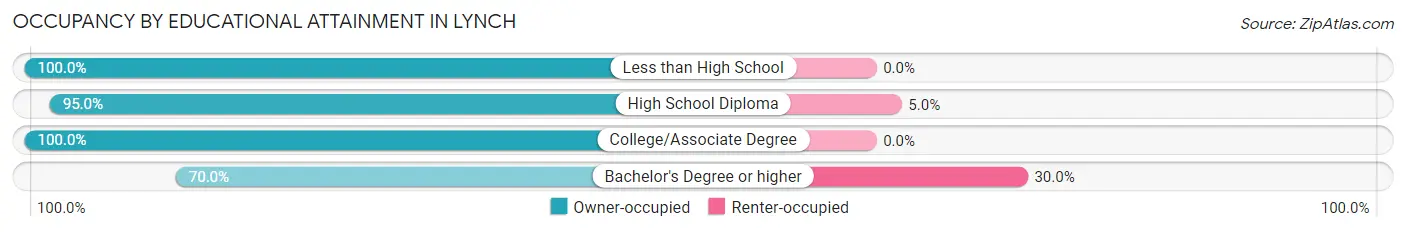
| Household Size | Owner-occupied | Renter-occupied |
| Less than High School | 8 (100.0%) | 0 (0.0%) |
| High School Diploma | 38 (95.0%) | 2 (5.0%) |
| College/Associate Degree | 20 (100.0%) | 0 (0.0%) |
| Bachelor's Degree or higher | 21 (70.0%) | 9 (30.0%) |
Occupancy by Age of Householder in Lynch
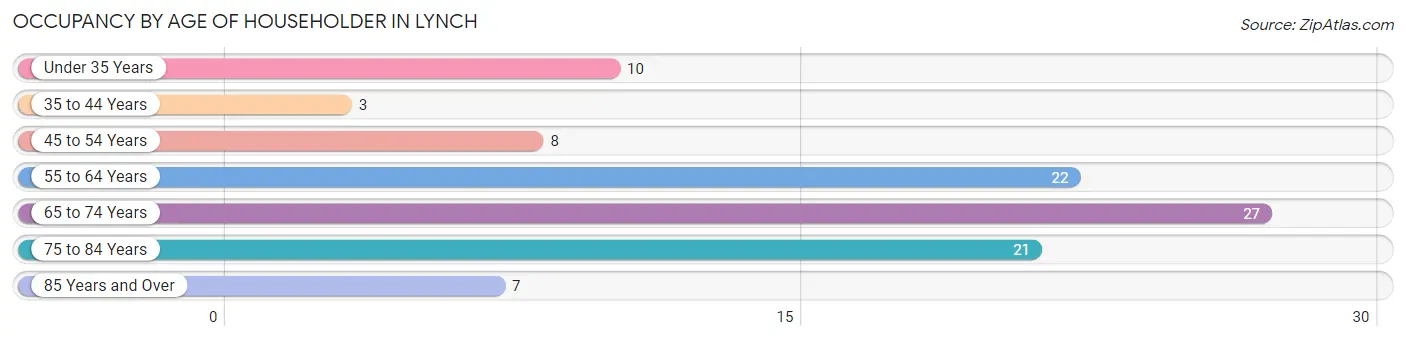
| Age Bracket | # Households | % Households |
| Under 35 Years | 10 | 10.2% |
| 35 to 44 Years | 3 | 3.1% |
| 45 to 54 Years | 8 | 8.2% |
| 55 to 64 Years | 22 | 22.5% |
| 65 to 74 Years | 27 | 27.6% |
| 75 to 84 Years | 21 | 21.4% |
| 85 Years and Over | 7 | 7.1% |
| Total | 98 | 100.0% |
Housing Finances in Lynch
Median Income by Occupancy in Lynch
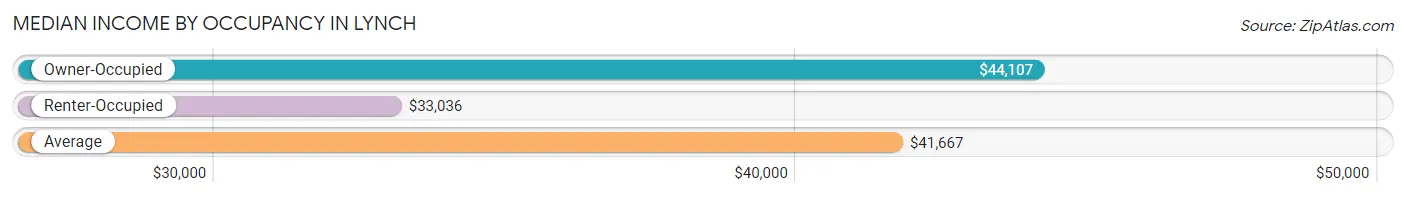
| Occupancy Type | # Households | Median Income |
| Owner-Occupied | 87 (88.8%) | $44,107 |
| Renter-Occupied | 11 (11.2%) | $33,036 |
| Average | 98 (100.0%) | $41,667 |
Occupancy by Householder Income Bracket in Lynch
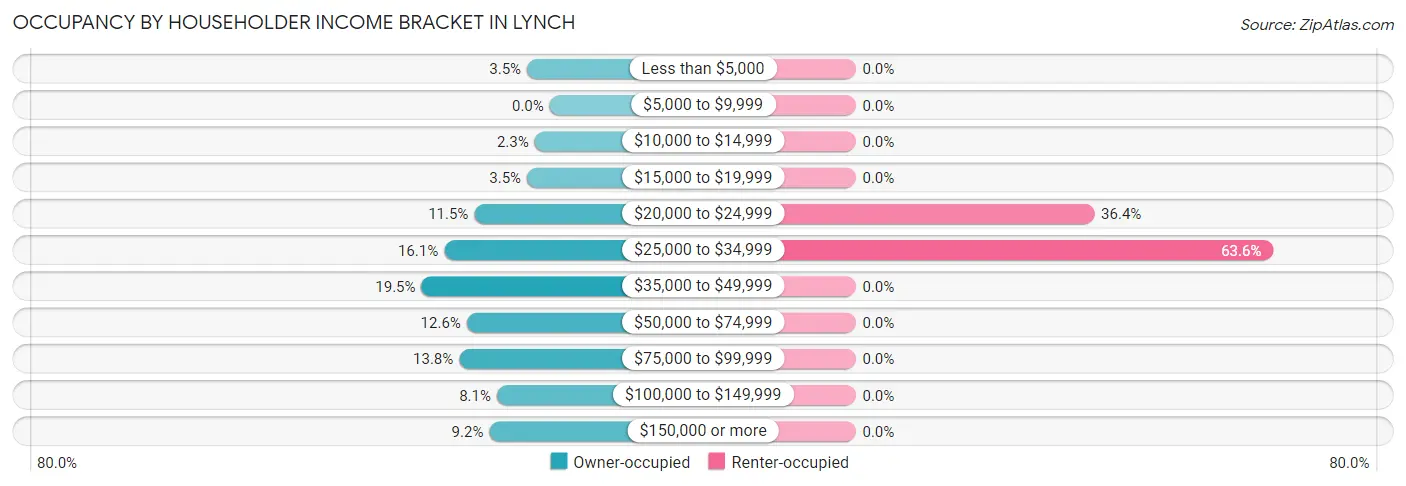
| Income Bracket | Owner-occupied | Renter-occupied |
| Less than $5,000 | 3 (3.5%) | 0 (0.0%) |
| $5,000 to $9,999 | 0 (0.0%) | 0 (0.0%) |
| $10,000 to $14,999 | 2 (2.3%) | 0 (0.0%) |
| $15,000 to $19,999 | 3 (3.5%) | 0 (0.0%) |
| $20,000 to $24,999 | 10 (11.5%) | 4 (36.4%) |
| $25,000 to $34,999 | 14 (16.1%) | 7 (63.6%) |
| $35,000 to $49,999 | 17 (19.5%) | 0 (0.0%) |
| $50,000 to $74,999 | 11 (12.6%) | 0 (0.0%) |
| $75,000 to $99,999 | 12 (13.8%) | 0 (0.0%) |
| $100,000 to $149,999 | 7 (8.1%) | 0 (0.0%) |
| $150,000 or more | 8 (9.2%) | 0 (0.0%) |
| Total | 87 (100.0%) | 11 (100.0%) |
Monthly Housing Cost Tiers in Lynch
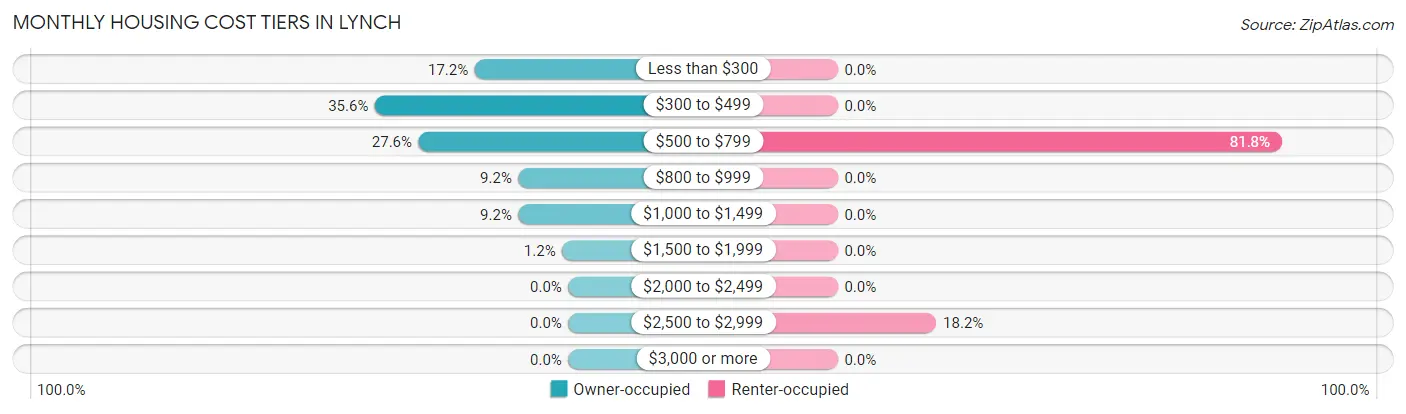
| Monthly Cost | Owner-occupied | Renter-occupied |
| Less than $300 | 15 (17.2%) | 0 (0.0%) |
| $300 to $499 | 31 (35.6%) | 0 (0.0%) |
| $500 to $799 | 24 (27.6%) | 9 (81.8%) |
| $800 to $999 | 8 (9.2%) | 0 (0.0%) |
| $1,000 to $1,499 | 8 (9.2%) | 0 (0.0%) |
| $1,500 to $1,999 | 1 (1.1%) | 0 (0.0%) |
| $2,000 to $2,499 | 0 (0.0%) | 0 (0.0%) |
| $2,500 to $2,999 | 0 (0.0%) | 2 (18.2%) |
| $3,000 or more | 0 (0.0%) | 0 (0.0%) |
| Total | 87 (100.0%) | 11 (100.0%) |
Physical Housing Characteristics in Lynch
Housing Structures in Lynch
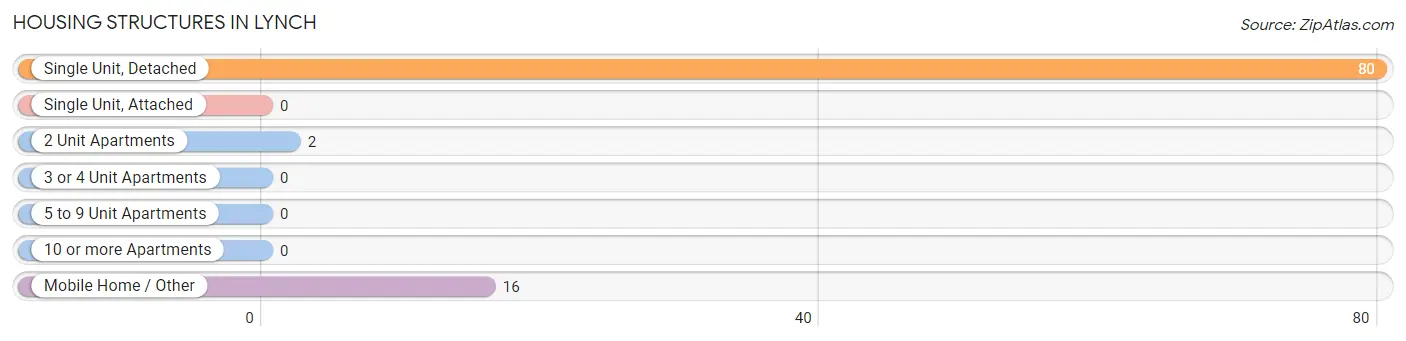
| Structure Type | # Housing Units | % Housing Units |
| Single Unit, Detached | 80 | 81.6% |
| Single Unit, Attached | 0 | 0.0% |
| 2 Unit Apartments | 2 | 2.0% |
| 3 or 4 Unit Apartments | 0 | 0.0% |
| 5 to 9 Unit Apartments | 0 | 0.0% |
| 10 or more Apartments | 0 | 0.0% |
| Mobile Home / Other | 16 | 16.3% |
| Total | 98 | 100.0% |
Housing Structures by Occupancy in Lynch
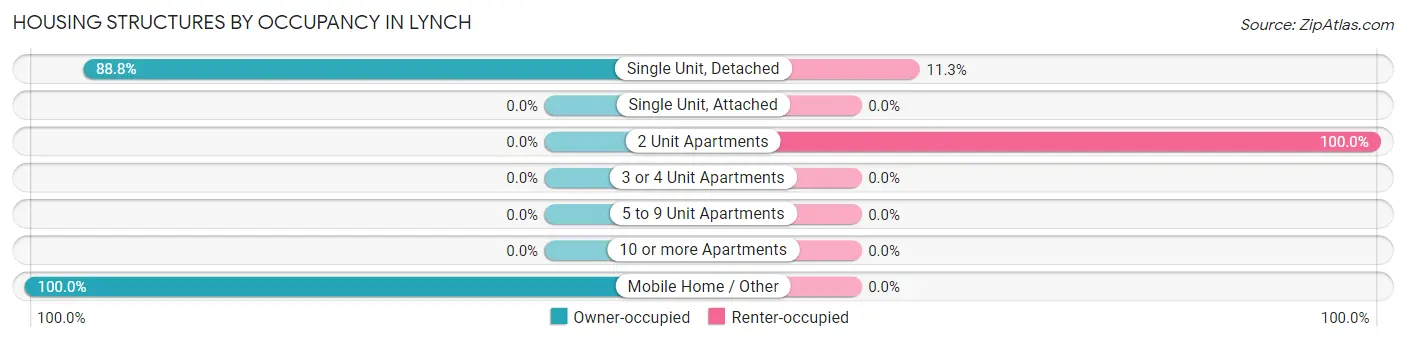
| Structure Type | Owner-occupied | Renter-occupied |
| Single Unit, Detached | 71 (88.7%) | 9 (11.3%) |
| Single Unit, Attached | 0 (0.0%) | 0 (0.0%) |
| 2 Unit Apartments | 0 (0.0%) | 2 (100.0%) |
| 3 or 4 Unit Apartments | 0 (0.0%) | 0 (0.0%) |
| 5 to 9 Unit Apartments | 0 (0.0%) | 0 (0.0%) |
| 10 or more Apartments | 0 (0.0%) | 0 (0.0%) |
| Mobile Home / Other | 16 (100.0%) | 0 (0.0%) |
| Total | 87 (88.8%) | 11 (11.2%) |
Housing Structures by Number of Rooms in Lynch
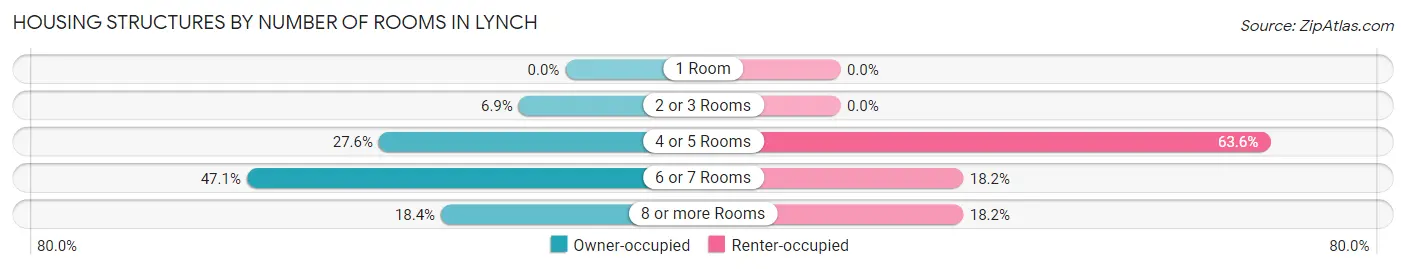
| Number of Rooms | Owner-occupied | Renter-occupied |
| 1 Room | 0 (0.0%) | 0 (0.0%) |
| 2 or 3 Rooms | 6 (6.9%) | 0 (0.0%) |
| 4 or 5 Rooms | 24 (27.6%) | 7 (63.6%) |
| 6 or 7 Rooms | 41 (47.1%) | 2 (18.2%) |
| 8 or more Rooms | 16 (18.4%) | 2 (18.2%) |
| Total | 87 (100.0%) | 11 (100.0%) |
Housing Structure by Heating Type in Lynch
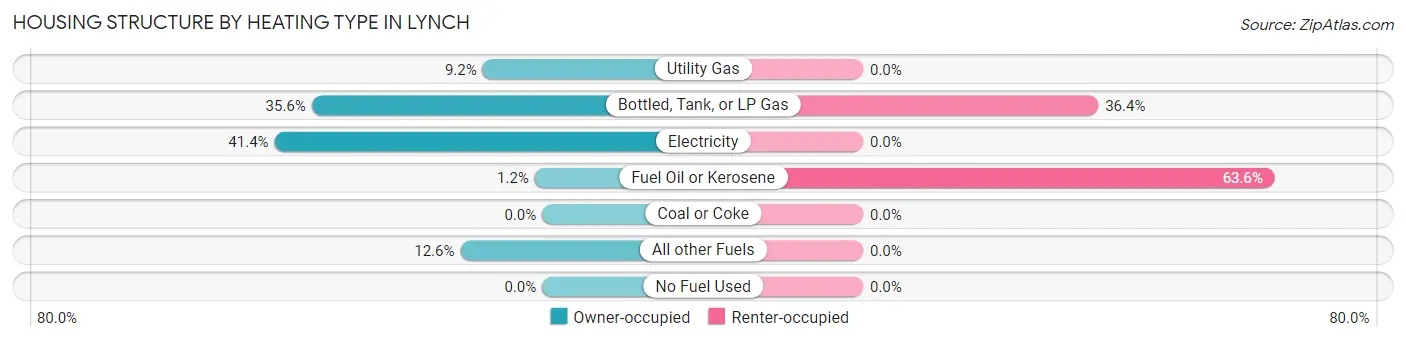
| Heating Type | Owner-occupied | Renter-occupied |
| Utility Gas | 8 (9.2%) | 0 (0.0%) |
| Bottled, Tank, or LP Gas | 31 (35.6%) | 4 (36.4%) |
| Electricity | 36 (41.4%) | 0 (0.0%) |
| Fuel Oil or Kerosene | 1 (1.1%) | 7 (63.6%) |
| Coal or Coke | 0 (0.0%) | 0 (0.0%) |
| All other Fuels | 11 (12.6%) | 0 (0.0%) |
| No Fuel Used | 0 (0.0%) | 0 (0.0%) |
| Total | 87 (100.0%) | 11 (100.0%) |
Household Vehicle Usage in Lynch
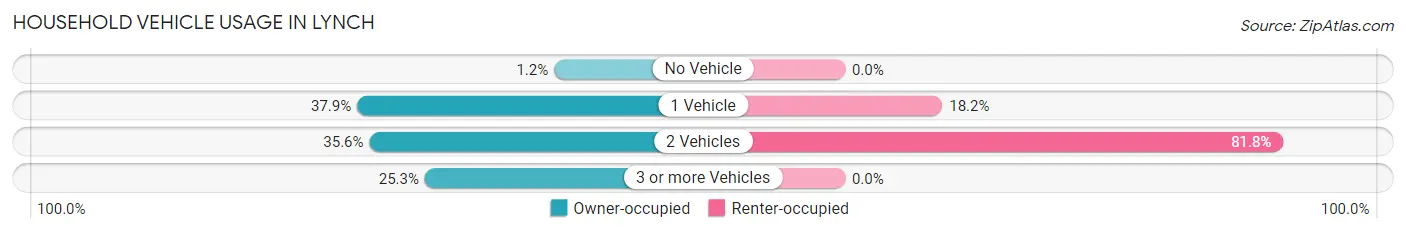
| Vehicles per Household | Owner-occupied | Renter-occupied |
| No Vehicle | 1 (1.1%) | 0 (0.0%) |
| 1 Vehicle | 33 (37.9%) | 2 (18.2%) |
| 2 Vehicles | 31 (35.6%) | 9 (81.8%) |
| 3 or more Vehicles | 22 (25.3%) | 0 (0.0%) |
| Total | 87 (100.0%) | 11 (100.0%) |
Real Estate & Mortgages in Lynch
Real Estate and Mortgage Overview in Lynch
| Characteristic | Without Mortgage | With Mortgage |
| Housing Units | 77 | 10 |
| Median Property Value | $47,100 | $70,000 |
| Median Household Income | $42,083 | $4 |
| Monthly Housing Costs | $453 | $0 |
| Real Estate Taxes | $414 | $0 |
Property Value by Mortgage Status in Lynch
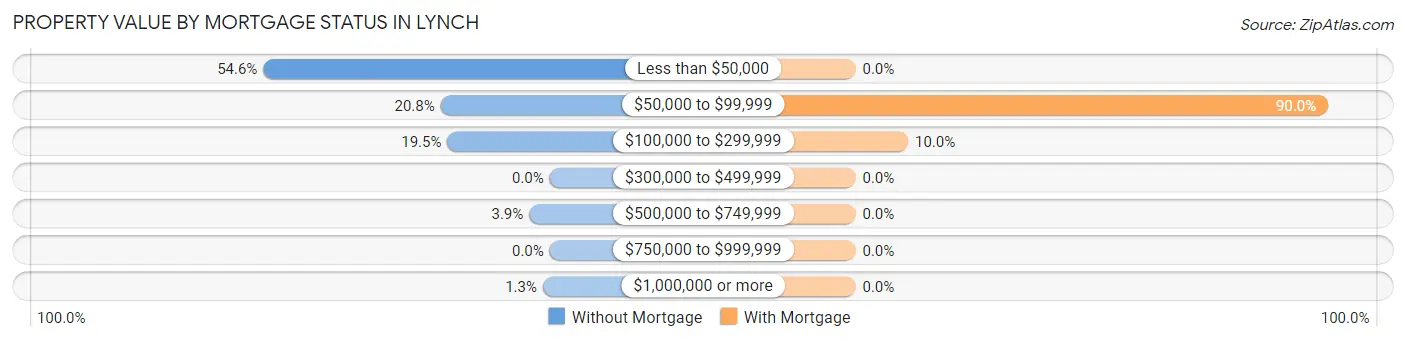
| Property Value | Without Mortgage | With Mortgage |
| Less than $50,000 | 42 (54.5%) | 0 (0.0%) |
| $50,000 to $99,999 | 16 (20.8%) | 9 (90.0%) |
| $100,000 to $299,999 | 15 (19.5%) | 1 (10.0%) |
| $300,000 to $499,999 | 0 (0.0%) | 0 (0.0%) |
| $500,000 to $749,999 | 3 (3.9%) | 0 (0.0%) |
| $750,000 to $999,999 | 0 (0.0%) | 0 (0.0%) |
| $1,000,000 or more | 1 (1.3%) | 0 (0.0%) |
| Total | 77 (100.0%) | 10 (100.0%) |
Household Income by Mortgage Status in Lynch
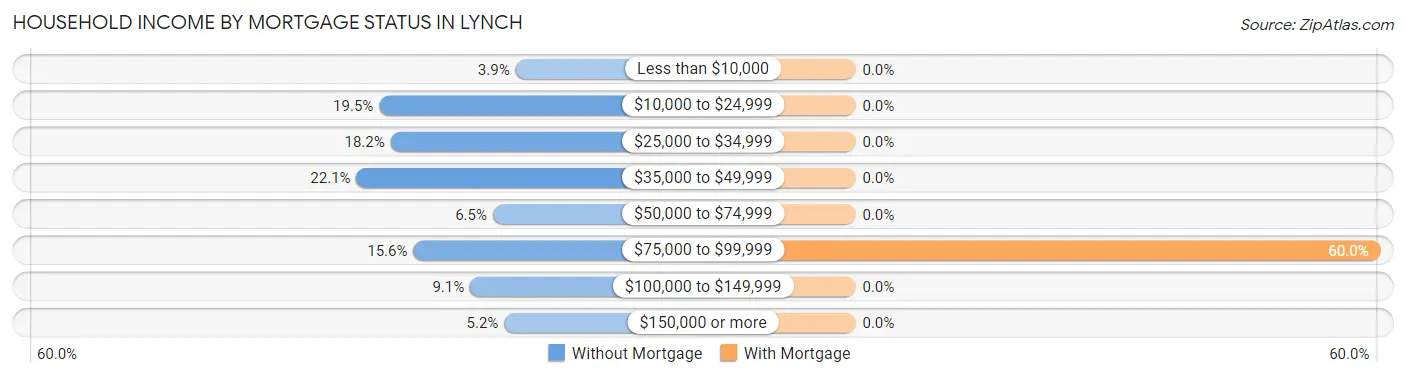
| Household Income | Without Mortgage | With Mortgage |
| Less than $10,000 | 3 (3.9%) | 0 (0.0%) |
| $10,000 to $24,999 | 15 (19.5%) | 0 (0.0%) |
| $25,000 to $34,999 | 14 (18.2%) | 0 (0.0%) |
| $35,000 to $49,999 | 17 (22.1%) | 0 (0.0%) |
| $50,000 to $74,999 | 5 (6.5%) | 0 (0.0%) |
| $75,000 to $99,999 | 12 (15.6%) | 6 (60.0%) |
| $100,000 to $149,999 | 7 (9.1%) | 0 (0.0%) |
| $150,000 or more | 4 (5.2%) | 0 (0.0%) |
| Total | 77 (100.0%) | 10 (100.0%) |
Property Value to Household Income Ratio in Lynch
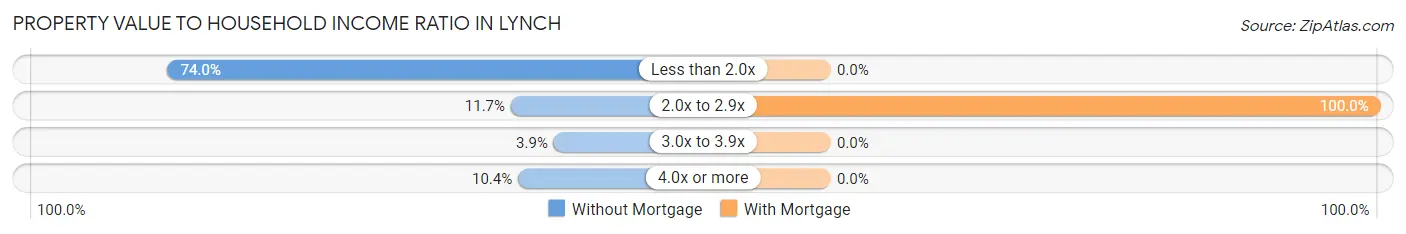
| Value-to-Income Ratio | Without Mortgage | With Mortgage |
| Less than 2.0x | 57 (74.0%) | 0 (0.0%) |
| 2.0x to 2.9x | 9 (11.7%) | 10 (100.0%) |
| 3.0x to 3.9x | 3 (3.9%) | 0 (0.0%) |
| 4.0x or more | 8 (10.4%) | 0 (0.0%) |
| Total | 77 (100.0%) | 10 (100.0%) |
Real Estate Taxes by Mortgage Status in Lynch
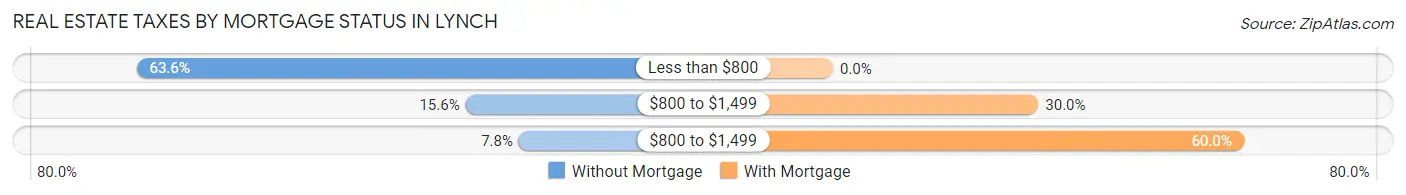
| Property Taxes | Without Mortgage | With Mortgage |
| Less than $800 | 49 (63.6%) | 0 (0.0%) |
| $800 to $1,499 | 12 (15.6%) | 3 (30.0%) |
| $800 to $1,499 | 6 (7.8%) | 6 (60.0%) |
| Total | 77 (100.0%) | 10 (100.0%) |
Health & Disability in Lynch
Health Insurance Coverage by Age in Lynch
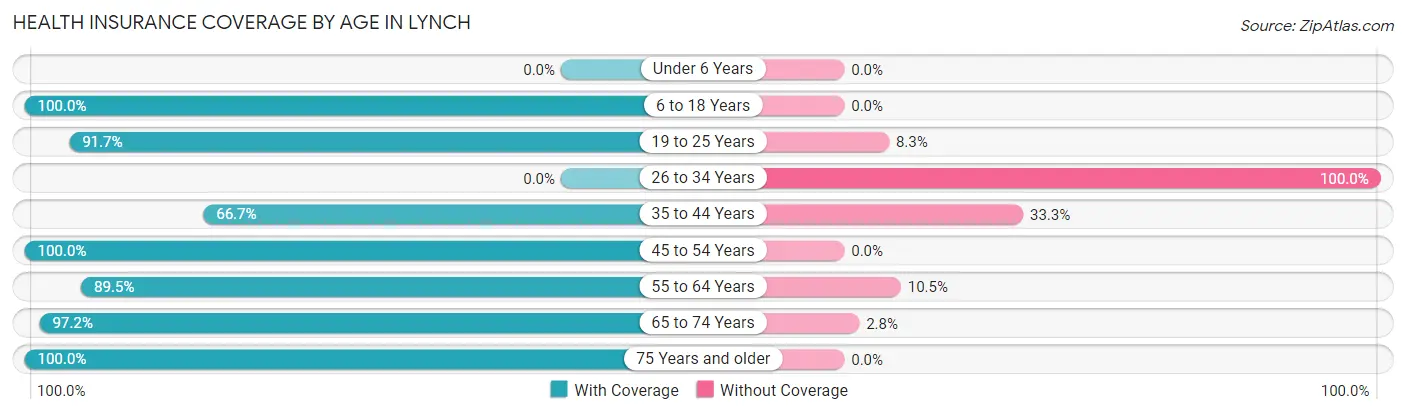
| Age Bracket | With Coverage | Without Coverage |
| Under 6 Years | 0 (0.0%) | 0 (0.0%) |
| 6 to 18 Years | 18 (100.0%) | 0 (0.0%) |
| 19 to 25 Years | 11 (91.7%) | 1 (8.3%) |
| 26 to 34 Years | 0 (0.0%) | 1 (100.0%) |
| 35 to 44 Years | 6 (66.7%) | 3 (33.3%) |
| 45 to 54 Years | 9 (100.0%) | 0 (0.0%) |
| 55 to 64 Years | 34 (89.5%) | 4 (10.5%) |
| 65 to 74 Years | 35 (97.2%) | 1 (2.8%) |
| 75 Years and older | 46 (100.0%) | 0 (0.0%) |
| Total | 159 (94.1%) | 10 (5.9%) |
Health Insurance Coverage by Citizenship Status in Lynch
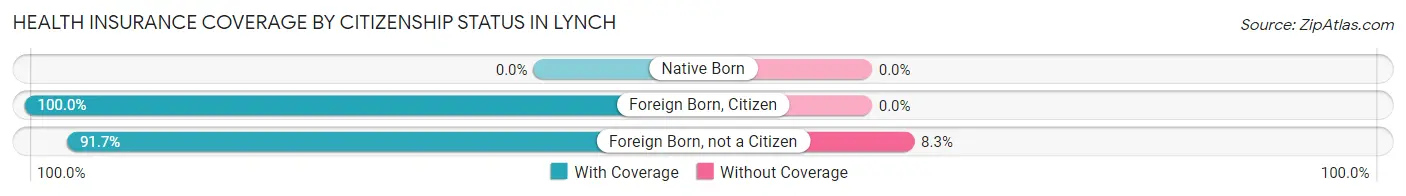
| Citizenship Status | With Coverage | Without Coverage |
| Native Born | 0 (0.0%) | 0 (0.0%) |
| Foreign Born, Citizen | 18 (100.0%) | 0 (0.0%) |
| Foreign Born, not a Citizen | 11 (91.7%) | 1 (8.3%) |
Health Insurance Coverage by Household Income in Lynch
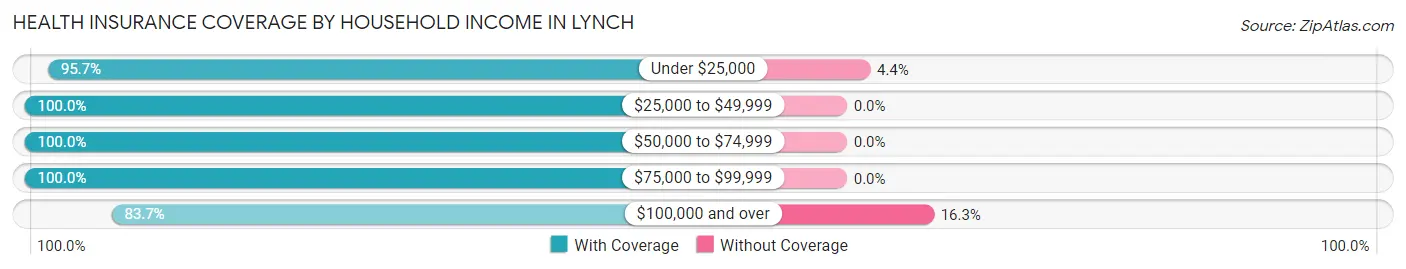
| Household Income | With Coverage | Without Coverage |
| Under $25,000 | 22 (95.7%) | 1 (4.3%) |
| $25,000 to $49,999 | 48 (100.0%) | 0 (0.0%) |
| $50,000 to $74,999 | 22 (100.0%) | 0 (0.0%) |
| $75,000 to $99,999 | 31 (100.0%) | 0 (0.0%) |
| $100,000 and over | 36 (83.7%) | 7 (16.3%) |
Public vs Private Health Insurance Coverage by Age in Lynch
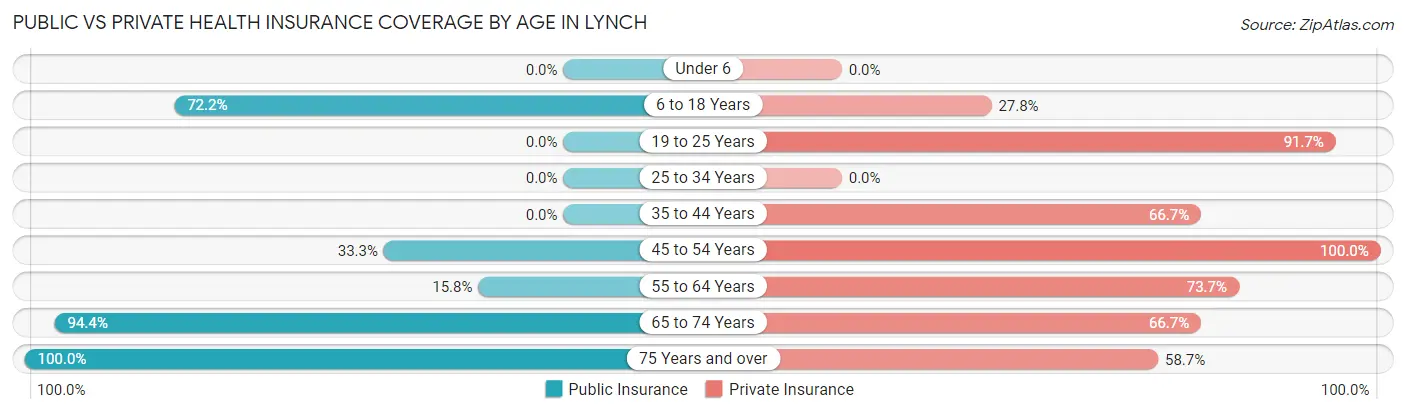
| Age Bracket | Public Insurance | Private Insurance |
| Under 6 | 0 (0.0%) | 0 (0.0%) |
| 6 to 18 Years | 13 (72.2%) | 5 (27.8%) |
| 19 to 25 Years | 0 (0.0%) | 11 (91.7%) |
| 25 to 34 Years | 0 (0.0%) | 0 (0.0%) |
| 35 to 44 Years | 0 (0.0%) | 6 (66.7%) |
| 45 to 54 Years | 3 (33.3%) | 9 (100.0%) |
| 55 to 64 Years | 6 (15.8%) | 28 (73.7%) |
| 65 to 74 Years | 34 (94.4%) | 24 (66.7%) |
| 75 Years and over | 46 (100.0%) | 27 (58.7%) |
| Total | 102 (60.4%) | 110 (65.1%) |
Disability Status by Sex by Age in Lynch
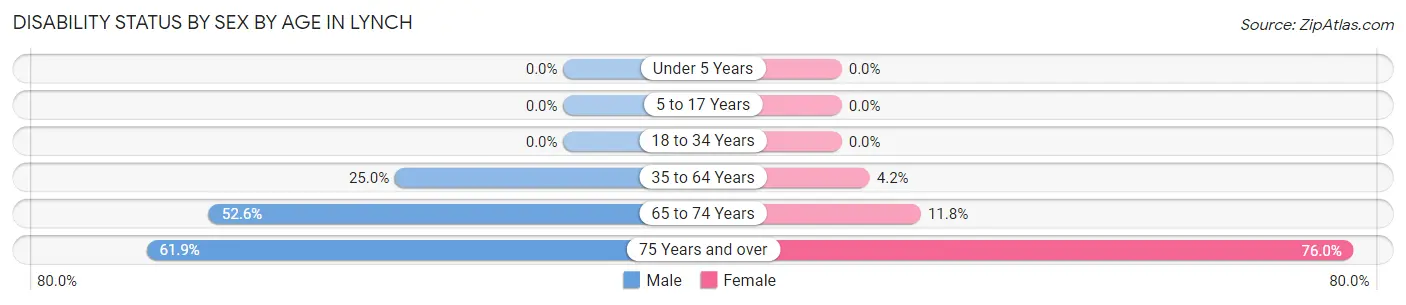
| Age Bracket | Male | Female |
| Under 5 Years | 0 (0.0%) | 0 (0.0%) |
| 5 to 17 Years | 0 (0.0%) | 0 (0.0%) |
| 18 to 34 Years | 0 (0.0%) | 0 (0.0%) |
| 35 to 64 Years | 8 (25.0%) | 1 (4.2%) |
| 65 to 74 Years | 10 (52.6%) | 2 (11.8%) |
| 75 Years and over | 13 (61.9%) | 19 (76.0%) |
Disability Class by Sex by Age in Lynch
Disability Class: Hearing Difficulty
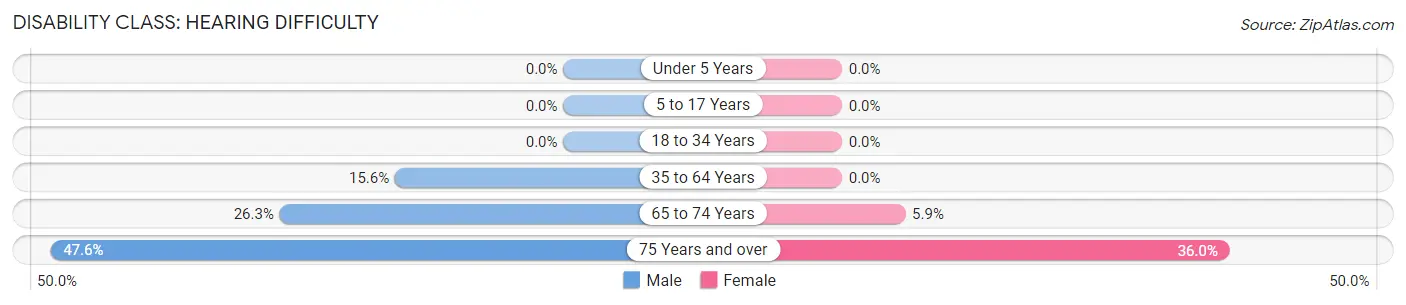
| Age Bracket | Male | Female |
| Under 5 Years | 0 (0.0%) | 0 (0.0%) |
| 5 to 17 Years | 0 (0.0%) | 0 (0.0%) |
| 18 to 34 Years | 0 (0.0%) | 0 (0.0%) |
| 35 to 64 Years | 5 (15.6%) | 0 (0.0%) |
| 65 to 74 Years | 5 (26.3%) | 1 (5.9%) |
| 75 Years and over | 10 (47.6%) | 9 (36.0%) |
Disability Class: Vision Difficulty
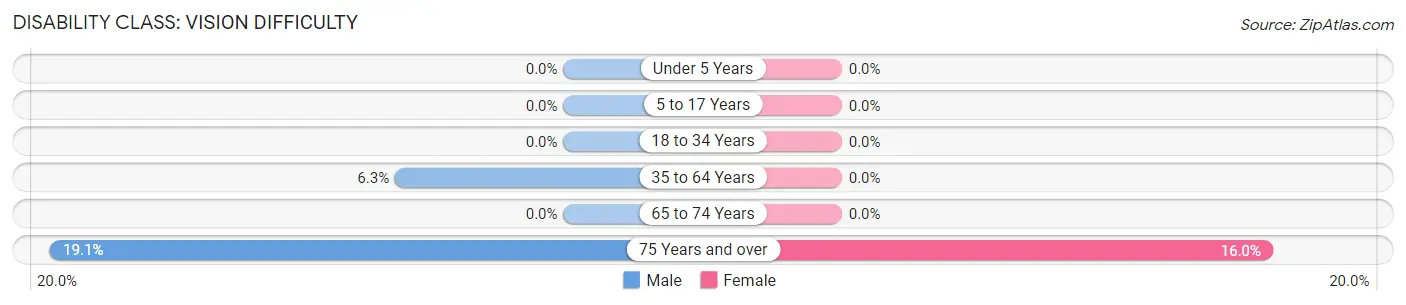
| Age Bracket | Male | Female |
| Under 5 Years | 0 (0.0%) | 0 (0.0%) |
| 5 to 17 Years | 0 (0.0%) | 0 (0.0%) |
| 18 to 34 Years | 0 (0.0%) | 0 (0.0%) |
| 35 to 64 Years | 2 (6.2%) | 0 (0.0%) |
| 65 to 74 Years | 0 (0.0%) | 0 (0.0%) |
| 75 Years and over | 4 (19.1%) | 4 (16.0%) |
Disability Class: Cognitive Difficulty
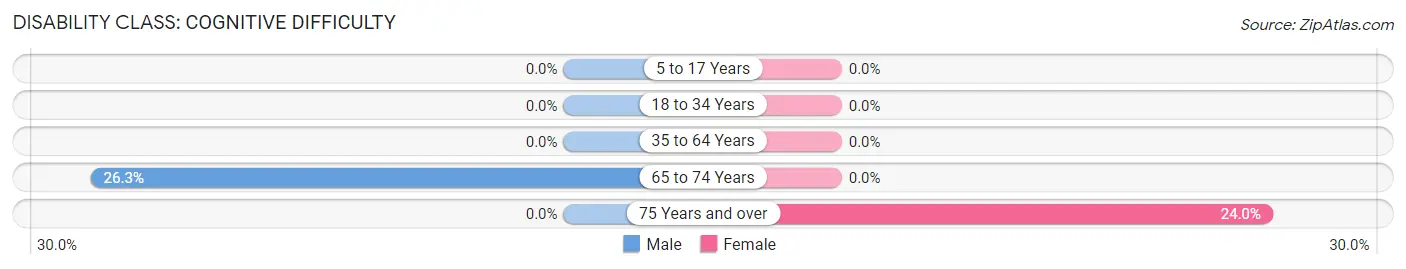
| Age Bracket | Male | Female |
| 5 to 17 Years | 0 (0.0%) | 0 (0.0%) |
| 18 to 34 Years | 0 (0.0%) | 0 (0.0%) |
| 35 to 64 Years | 0 (0.0%) | 0 (0.0%) |
| 65 to 74 Years | 5 (26.3%) | 0 (0.0%) |
| 75 Years and over | 0 (0.0%) | 6 (24.0%) |
Disability Class: Ambulatory Difficulty
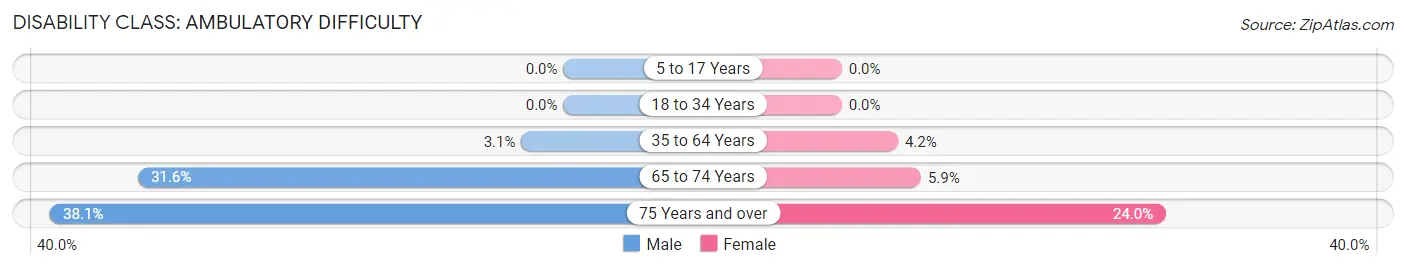
| Age Bracket | Male | Female |
| 5 to 17 Years | 0 (0.0%) | 0 (0.0%) |
| 18 to 34 Years | 0 (0.0%) | 0 (0.0%) |
| 35 to 64 Years | 1 (3.1%) | 1 (4.2%) |
| 65 to 74 Years | 6 (31.6%) | 1 (5.9%) |
| 75 Years and over | 8 (38.1%) | 6 (24.0%) |
Disability Class: Self-Care Difficulty
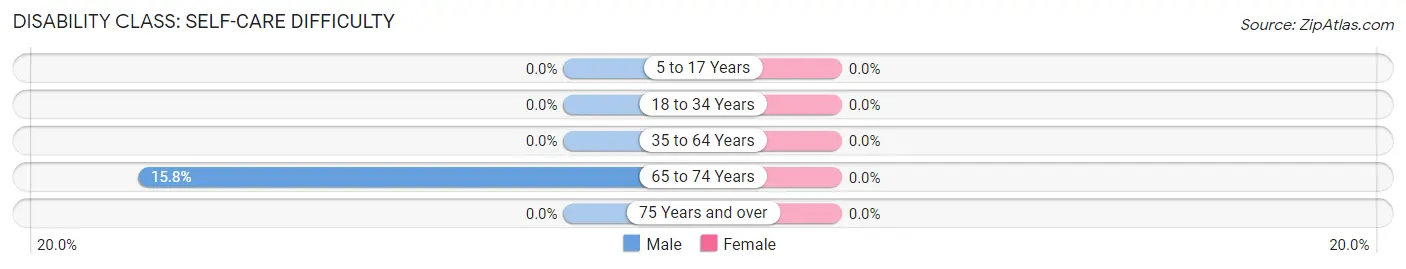
| Age Bracket | Male | Female |
| 5 to 17 Years | 0 (0.0%) | 0 (0.0%) |
| 18 to 34 Years | 0 (0.0%) | 0 (0.0%) |
| 35 to 64 Years | 0 (0.0%) | 0 (0.0%) |
| 65 to 74 Years | 3 (15.8%) | 0 (0.0%) |
| 75 Years and over | 0 (0.0%) | 0 (0.0%) |
Technology Access in Lynch
Computing Device Access in Lynch
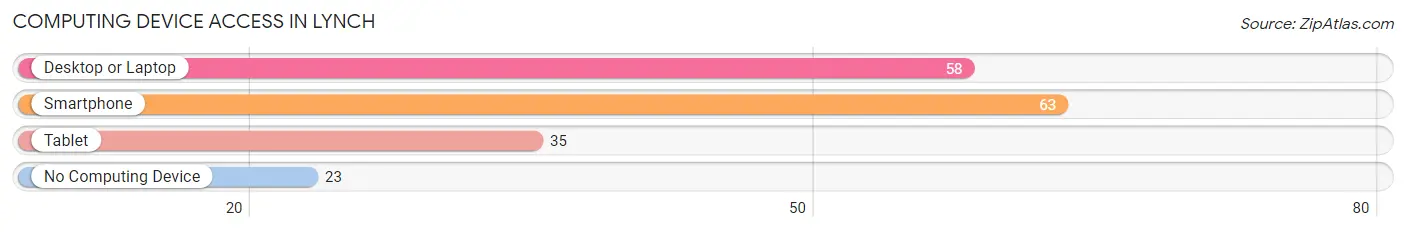
| Device Type | # Households | % Households |
| Desktop or Laptop | 58 | 59.2% |
| Smartphone | 63 | 64.3% |
| Tablet | 35 | 35.7% |
| No Computing Device | 23 | 23.5% |
| Total | 98 | 100.0% |
Internet Access in Lynch
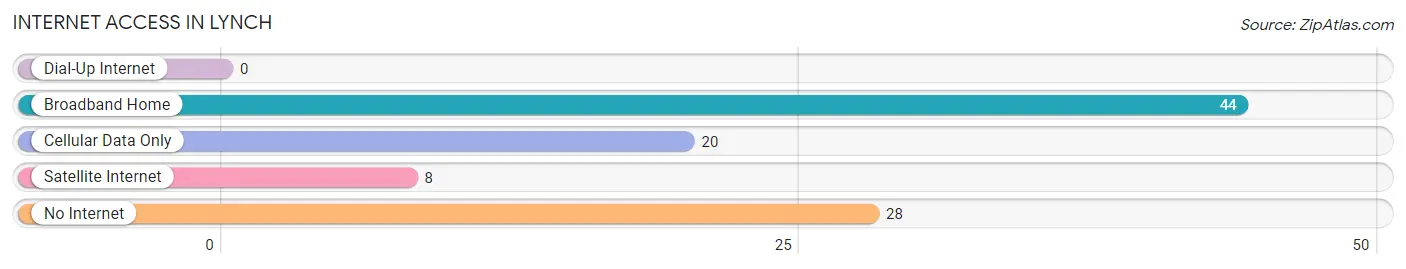
| Internet Type | # Households | % Households |
| Dial-Up Internet | 0 | 0.0% |
| Broadband Home | 44 | 44.9% |
| Cellular Data Only | 20 | 20.4% |
| Satellite Internet | 8 | 8.2% |
| No Internet | 28 | 28.6% |
| Total | 98 | 100.0% |
Lynch Summary
Lynch is a small town located in the northeastern corner of Nebraska, in the United States. It is situated in the Sandhills region of the state, and is the county seat of Boyd County. The town has a population of approximately 500 people, and is located about 50 miles from the South Dakota border.
History
The town of Lynch was founded in 1887, when the Union Pacific Railroad was extended to the area. The town was named after the railroad's superintendent, William Lynch. The town was incorporated in 1891, and the first post office was established in 1892.
In the early 1900s, Lynch was a thriving agricultural community, with a population of over 1,000 people. The town was home to several businesses, including a bank, a hotel, a general store, and a lumberyard.
Geography
Lynch is located in the Sandhills region of Nebraska, which is characterized by rolling hills and sandy soils. The town is situated in the Niobrara River Valley, and is surrounded by the Niobrara National Wildlife Refuge. The town is located about 50 miles from the South Dakota border, and is about 100 miles from the state capital of Lincoln.
The climate in Lynch is semi-arid, with hot summers and cold winters. The average annual temperature is around 50 degrees Fahrenheit, and the average annual precipitation is around 20 inches.
Economy
The economy of Lynch is largely based on agriculture. The town is home to several farms, which produce corn, soybeans, and wheat. The town also has a small manufacturing sector, which produces agricultural equipment and other products.
The town is also home to several small businesses, including a grocery store, a hardware store, and a restaurant. The town also has a small tourism industry, with several attractions, including the Niobrara National Wildlife Refuge and the Sandhills Museum.
Demographics
As of the 2010 census, Lynch had a population of 498 people. The racial makeup of the town was 97.2% White, 0.2% African American, 0.2% Native American, 0.2% Asian, 0.2% from other races, and 1.8% from two or more races. Hispanic or Latino of any race were 0.8% of the population.
The median household income in Lynch was $37,500, and the median family income was $45,000. The per capita income in the town was $17,000. About 11.2% of families and 14.2% of the population were below the poverty line, including 18.2% of those under age 18 and 8.2% of those age 65 or over.
Common Questions
What is Per Capita Income in Lynch?
Per Capita income in Lynch is $33,350.
What is the Median Family Income in Lynch?
Median Family Income in Lynch is $76,875.
What is the Median Household income in Lynch?
Median Household Income in Lynch is $41,667.
What is Income or Wage Gap in Lynch?
Income or Wage Gap in Lynch is 21.4%.
Women in Lynch earn 78.6 cents for every dollar earned by a man.
What is Inequality or Gini Index in Lynch?
Inequality or Gini Index in Lynch is 0.39.
What is the Total Population of Lynch?
Total Population of Lynch is 169.
What is the Total Male Population of Lynch?
Total Male Population of Lynch is 94.
What is the Total Female Population of Lynch?
Total Female Population of Lynch is 75.
What is the Ratio of Males per 100 Females in Lynch?
There are 125.33 Males per 100 Females in Lynch.
What is the Ratio of Females per 100 Males in Lynch?
There are 79.79 Females per 100 Males in Lynch.
What is the Median Population Age in Lynch?
Median Population Age in Lynch is 64.7 Years.
What is the Average Family Size in Lynch
Average Family Size in Lynch is 2.5 People.
What is the Average Household Size in Lynch
Average Household Size in Lynch is 1.7 People.
How Large is the Labor Force in Lynch?
There are 91 People in the Labor Forcein in Lynch.
What is the Percentage of People in the Labor Force in Lynch?
60.3% of People are in the Labor Force in Lynch.