Pierce County, NE Map & Demographics
Pierce County Map
Pierce County Overview
$33,513
PER CAPITA INCOME
$78,912
AVG FAMILY INCOME
$65,603
AVG HOUSEHOLD INCOME
30.8%
WAGE / INCOME GAP [ % ]
69.2¢/ $1
WAGE / INCOME GAP [ $ ]
0.41
INEQUALITY / GINI INDEX
7,301
TOTAL POPULATION
3,691
MALE POPULATION
3,610
FEMALE POPULATION
102.24
MALES / 100 FEMALES
97.81
FEMALES / 100 MALES
40.2
MEDIAN AGE
3.1
AVG FAMILY SIZE
2.5
AVG HOUSEHOLD SIZE
3,876
LABOR FORCE [ PEOPLE ]
68.0%
PERCENT IN LABOR FORCE
2.4%
UNEMPLOYMENT RATE
Pierce County Area Codes
Income in Pierce County
Income Overview in Pierce County
Per Capita Income in Pierce County is $33,513, while median incomes of families and households are $78,912 and $65,603 respectively.
| Characteristic | Number | Measure |
| Per Capita Income | 7,301 | $33,513 |
| Median Family Income | 1,962 | $78,912 |
| Mean Family Income | 1,962 | $93,733 |
| Median Household Income | 2,876 | $65,603 |
| Mean Household Income | 2,876 | $81,865 |
| Income Deficit | 1,962 | $0 |
| Wage / Income Gap (%) | 7,301 | 30.84% |
| Wage / Income Gap ($) | 7,301 | 69.16¢ per $1 |
| Gini / Inequality Index | 7,301 | 0.41 |
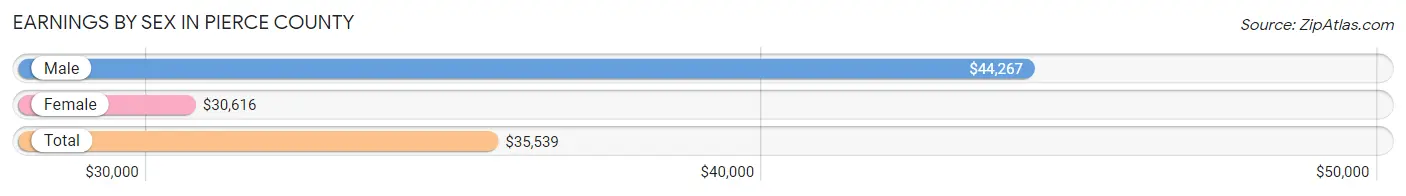
Earnings by Sex in Pierce County
Average Earnings in Pierce County are $35,539, $44,267 for men and $30,616 for women, a difference of 30.8%.
| Sex | Number | Average Earnings |
| Male | 2,274 (54.8%) | $44,267 |
| Female | 1,873 (45.2%) | $30,616 |
| Total | 4,147 (100.0%) | $35,539 |
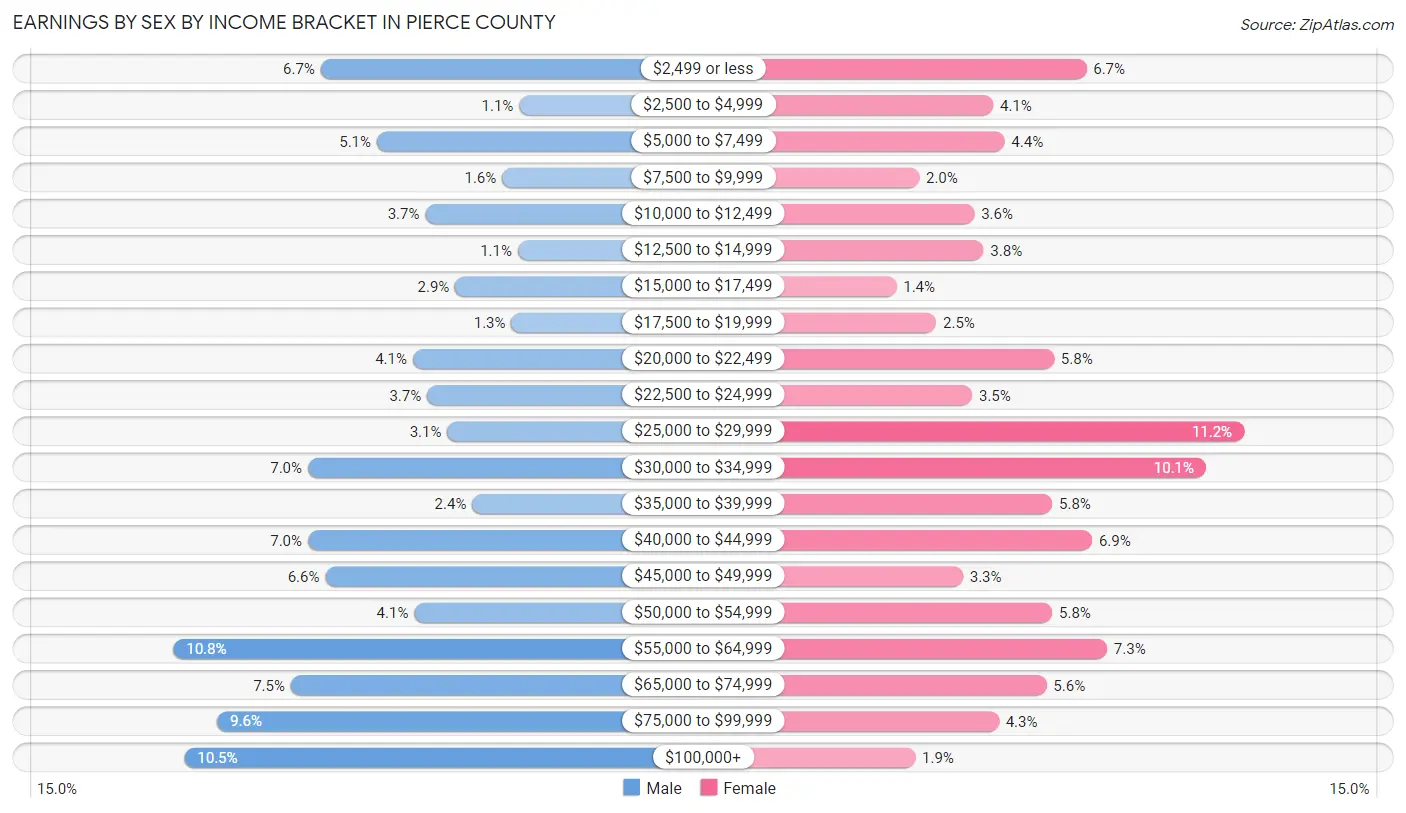
Earnings by Sex by Income Bracket in Pierce County
The most common earnings brackets in Pierce County are $55,000 to $64,999 for men (246 | 10.8%) and $25,000 to $29,999 for women (209 | 11.2%).
| Income | Male | Female |
| $2,499 or less | 152 (6.7%) | 126 (6.7%) |
| $2,500 to $4,999 | 25 (1.1%) | 77 (4.1%) |
| $5,000 to $7,499 | 116 (5.1%) | 83 (4.4%) |
| $7,500 to $9,999 | 36 (1.6%) | 38 (2.0%) |
| $10,000 to $12,499 | 85 (3.7%) | 67 (3.6%) |
| $12,500 to $14,999 | 26 (1.1%) | 72 (3.8%) |
| $15,000 to $17,499 | 66 (2.9%) | 26 (1.4%) |
| $17,500 to $19,999 | 30 (1.3%) | 47 (2.5%) |
| $20,000 to $22,499 | 93 (4.1%) | 109 (5.8%) |
| $22,500 to $24,999 | 84 (3.7%) | 66 (3.5%) |
| $25,000 to $29,999 | 71 (3.1%) | 209 (11.2%) |
| $30,000 to $34,999 | 160 (7.0%) | 189 (10.1%) |
| $35,000 to $39,999 | 55 (2.4%) | 108 (5.8%) |
| $40,000 to $44,999 | 160 (7.0%) | 129 (6.9%) |
| $45,000 to $49,999 | 149 (6.6%) | 61 (3.3%) |
| $50,000 to $54,999 | 92 (4.1%) | 108 (5.8%) |
| $55,000 to $64,999 | 246 (10.8%) | 137 (7.3%) |
| $65,000 to $74,999 | 171 (7.5%) | 105 (5.6%) |
| $75,000 to $99,999 | 218 (9.6%) | 80 (4.3%) |
| $100,000+ | 239 (10.5%) | 36 (1.9%) |
| Total | 2,274 (100.0%) | 1,873 (100.0%) |
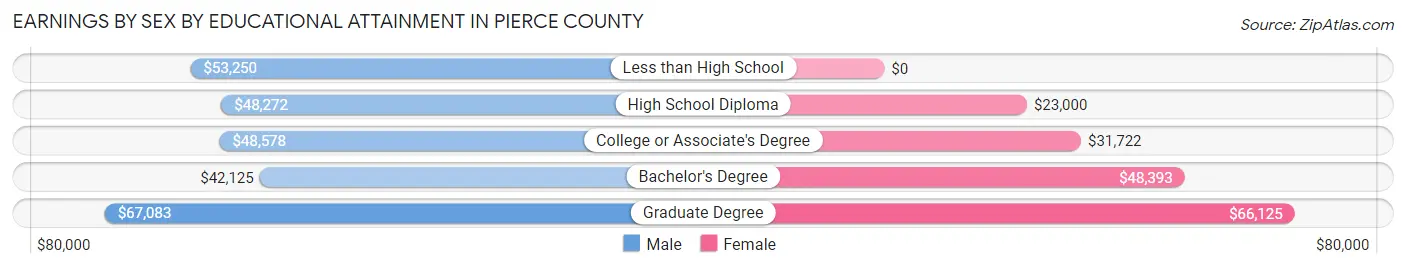
Earnings by Sex by Educational Attainment in Pierce County
Average earnings in Pierce County are $48,988 for men and $33,163 for women, a difference of 32.3%. Men with an educational attainment of graduate degree enjoy the highest average annual earnings of $67,083, while those with bachelor's degree education earn the least with $42,125. Women with an educational attainment of graduate degree earn the most with the average annual earnings of $66,125, while those with high school diploma education have the smallest earnings of $23,000.
| Educational Attainment | Male Income | Female Income |
| Less than High School | $53,250 | $0 |
| High School Diploma | $48,272 | $23,000 |
| College or Associate's Degree | $48,578 | $31,722 |
| Bachelor's Degree | $42,125 | $48,393 |
| Graduate Degree | $67,083 | $66,125 |
| Total | $48,988 | $33,163 |
Family Income in Pierce County
Family Income Brackets in Pierce County
According to the Pierce County family income data, there are 438 families falling into the $75,000 to $99,999 income range, which is the most common income bracket and makes up 22.3% of all families. Conversely, the $10,000 to $14,999 income bracket is the least frequent group with only 14 families (0.7%) belonging to this category.
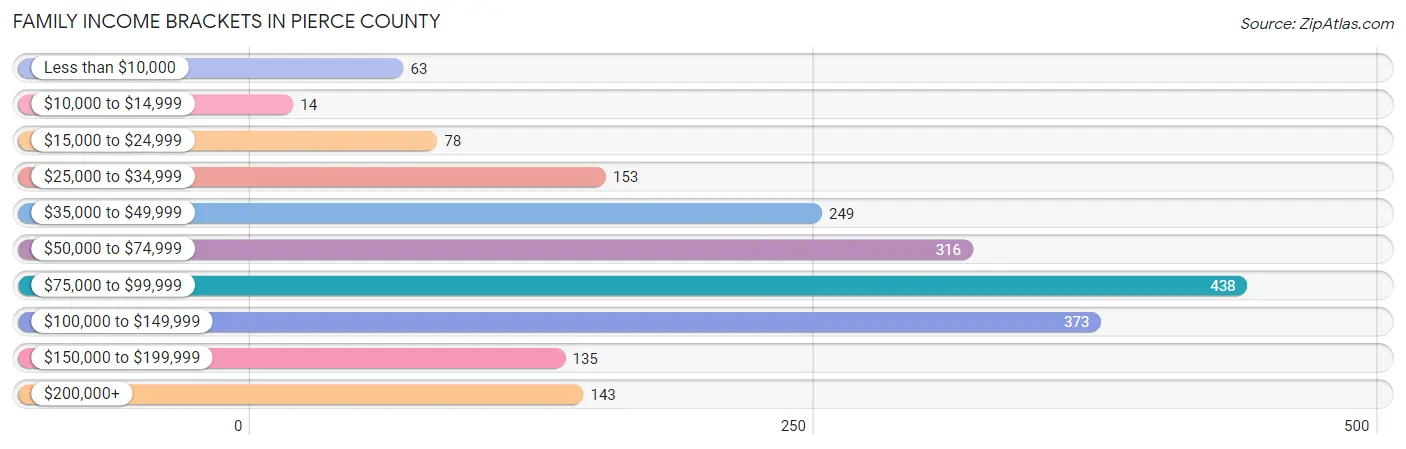
| Income Bracket | # Families | % Families |
| Less than $10,000 | 63 | 3.2% |
| $10,000 to $14,999 | 14 | 0.7% |
| $15,000 to $24,999 | 78 | 4.0% |
| $25,000 to $34,999 | 153 | 7.8% |
| $35,000 to $49,999 | 249 | 12.7% |
| $50,000 to $74,999 | 316 | 16.1% |
| $75,000 to $99,999 | 438 | 22.3% |
| $100,000 to $149,999 | 373 | 19.0% |
| $150,000 to $199,999 | 135 | 6.9% |
| $200,000+ | 143 | 7.3% |
Family Income by Famaliy Size in Pierce County
5-person families (183 | 9.3%) account for the highest median family income in Pierce County with $104,663 per family, while 2-person families (1,035 | 52.7%) have the highest median income of $33,542 per family member.
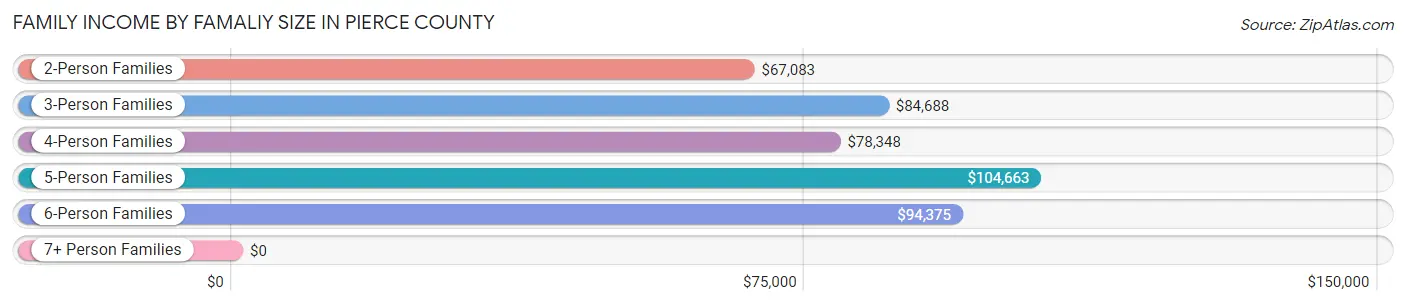
| Income Bracket | # Families | Median Income |
| 2-Person Families | 1,035 (52.7%) | $67,083 |
| 3-Person Families | 382 (19.5%) | $84,688 |
| 4-Person Families | 305 (15.5%) | $78,348 |
| 5-Person Families | 183 (9.3%) | $104,663 |
| 6-Person Families | 42 (2.1%) | $94,375 |
| 7+ Person Families | 15 (0.8%) | $0 |
| Total | 1,962 (100.0%) | $78,912 |
Family Income by Number of Earners in Pierce County
The median family income in Pierce County is $78,912, with families comprising 3+ earners (197) having the highest median family income of $117,917, while families with no earners (281) have the lowest median family income of $35,313, accounting for 10.0% and 14.3% of families, respectively.
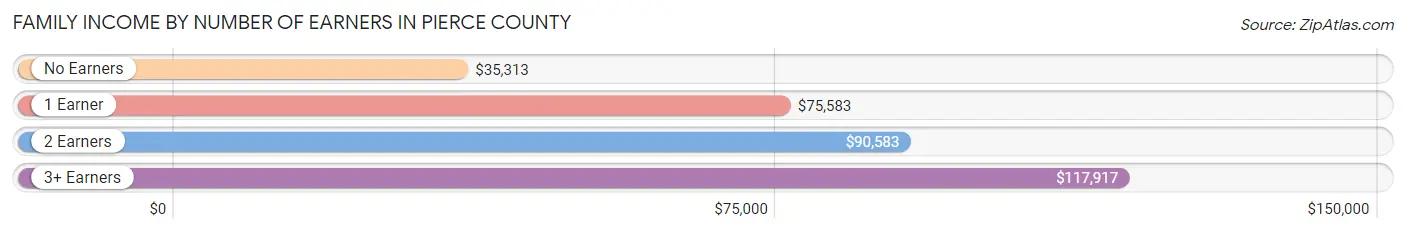
| Number of Earners | # Families | Median Income |
| No Earners | 281 (14.3%) | $35,313 |
| 1 Earner | 439 (22.4%) | $75,583 |
| 2 Earners | 1,045 (53.3%) | $90,583 |
| 3+ Earners | 197 (10.0%) | $117,917 |
| Total | 1,962 (100.0%) | $78,912 |
Household Income in Pierce County
Household Income Brackets in Pierce County
With 532 households falling in the category, the $75,000 to $99,999 income range is the most frequent in Pierce County, accounting for 18.5% of all households. In contrast, only 60 households (2.1%) fall into the $10,000 to $14,999 income bracket, making it the least populous group.
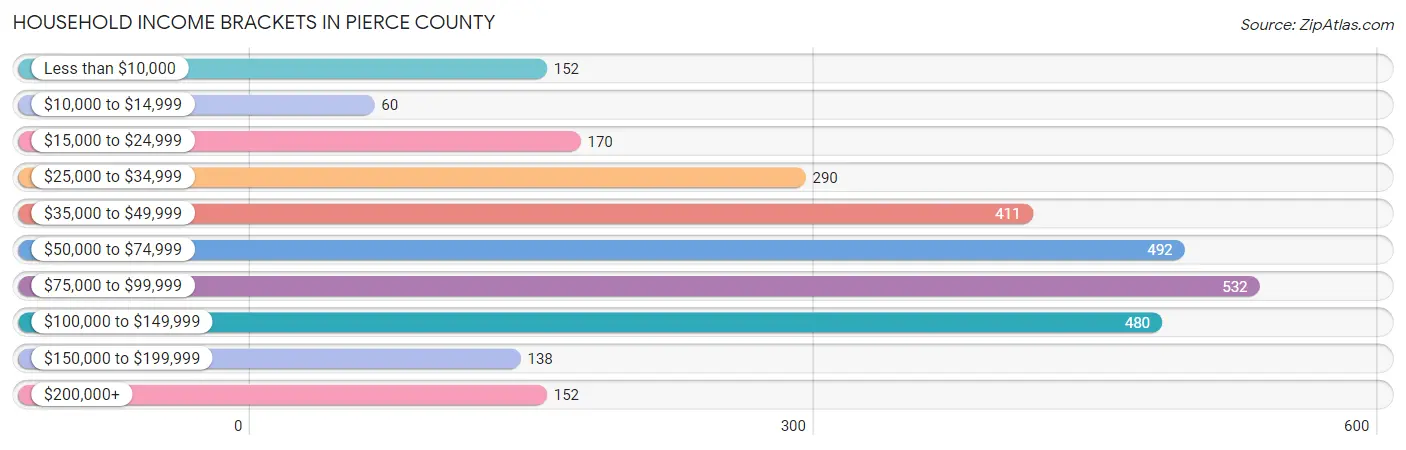
| Income Bracket | # Households | % Households |
| Less than $10,000 | 152 | 5.3% |
| $10,000 to $14,999 | 60 | 2.1% |
| $15,000 to $24,999 | 170 | 5.9% |
| $25,000 to $34,999 | 290 | 10.1% |
| $35,000 to $49,999 | 411 | 14.3% |
| $50,000 to $74,999 | 492 | 17.1% |
| $75,000 to $99,999 | 532 | 18.5% |
| $100,000 to $149,999 | 480 | 16.7% |
| $150,000 to $199,999 | 138 | 4.8% |
| $200,000+ | 152 | 5.3% |
Household Income by Householder Age in Pierce County
The median household income in Pierce County is $65,603, with the highest median household income of $78,487 found in the 45 to 64 years age bracket for the primary householder. A total of 1,062 households (36.9%) fall into this category. Meanwhile, the 15 to 24 years age bracket for the primary householder has the lowest median household income of $40,524, with 141 households (4.9%) in this group.
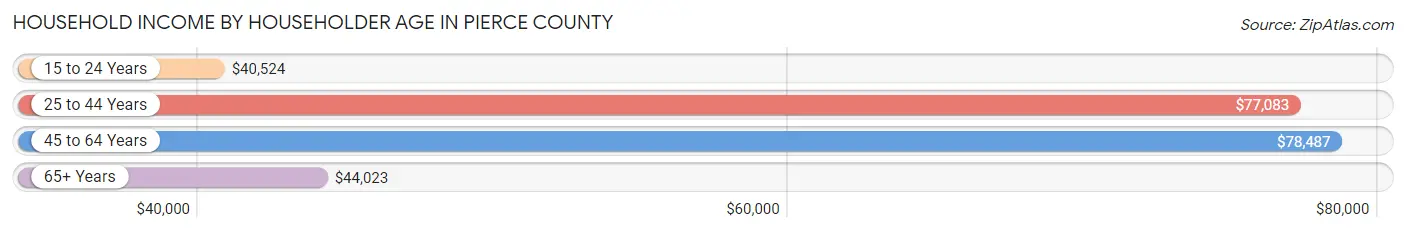
| Income Bracket | # Households | Median Income |
| 15 to 24 Years | 141 (4.9%) | $40,524 |
| 25 to 44 Years | 835 (29.0%) | $77,083 |
| 45 to 64 Years | 1,062 (36.9%) | $78,487 |
| 65+ Years | 838 (29.1%) | $44,023 |
| Total | 2,876 (100.0%) | $65,603 |
Poverty in Pierce County
Income Below Poverty by Sex and Age in Pierce County
With 7.0% poverty level for males and 8.9% for females among the residents of Pierce County, under 5 year old males and 12 to 14 year old females are the most vulnerable to poverty, with 37 males (15.5%) and 34 females (20.2%) in their respective age groups living below the poverty level.
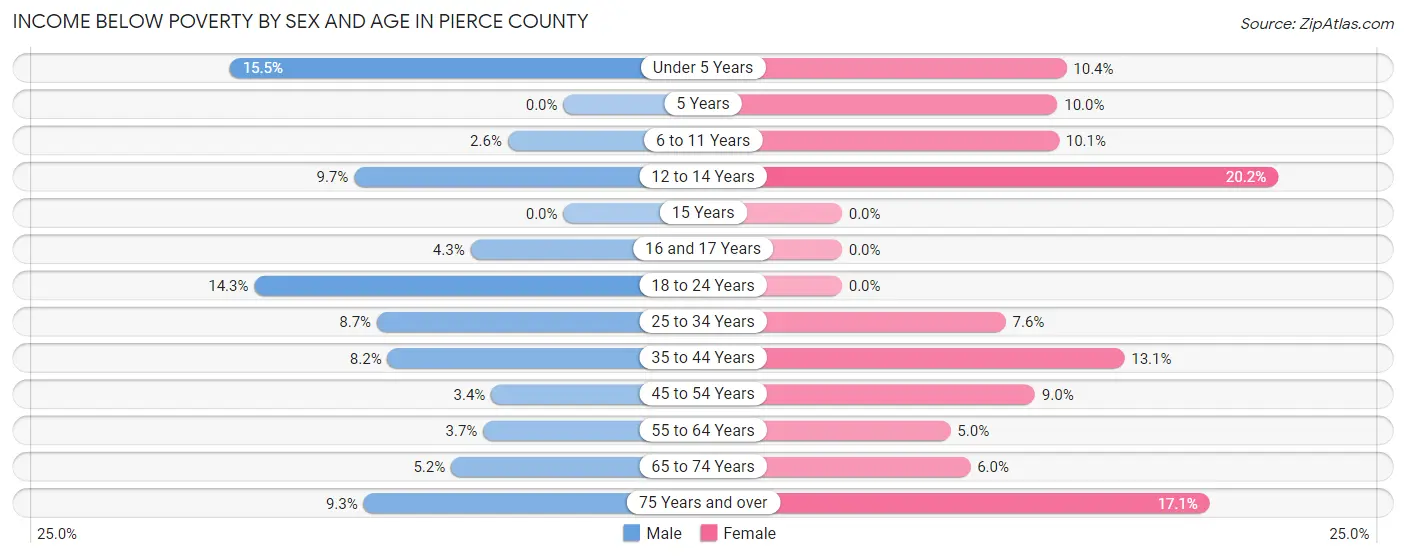
| Age Bracket | Male | Female |
| Under 5 Years | 37 (15.5%) | 30 (10.4%) |
| 5 Years | 0 (0.0%) | 4 (10.0%) |
| 6 to 11 Years | 9 (2.6%) | 28 (10.1%) |
| 12 to 14 Years | 10 (9.7%) | 34 (20.2%) |
| 15 Years | 0 (0.0%) | 0 (0.0%) |
| 16 and 17 Years | 5 (4.3%) | 0 (0.0%) |
| 18 to 24 Years | 41 (14.3%) | 0 (0.0%) |
| 25 to 34 Years | 34 (8.6%) | 26 (7.6%) |
| 35 to 44 Years | 39 (8.2%) | 54 (13.1%) |
| 45 to 54 Years | 13 (3.4%) | 36 (9.0%) |
| 55 to 64 Years | 21 (3.7%) | 26 (5.0%) |
| 65 to 74 Years | 20 (5.2%) | 22 (6.0%) |
| 75 Years and over | 23 (9.3%) | 57 (17.1%) |
| Total | 252 (7.0%) | 317 (8.9%) |
Income Above Poverty by Sex and Age in Pierce County
According to the poverty statistics in Pierce County, males aged 5 years and females aged 15 years are the age groups that are most secure financially, with 100.0% of males and 100.0% of females in these age groups living above the poverty line.
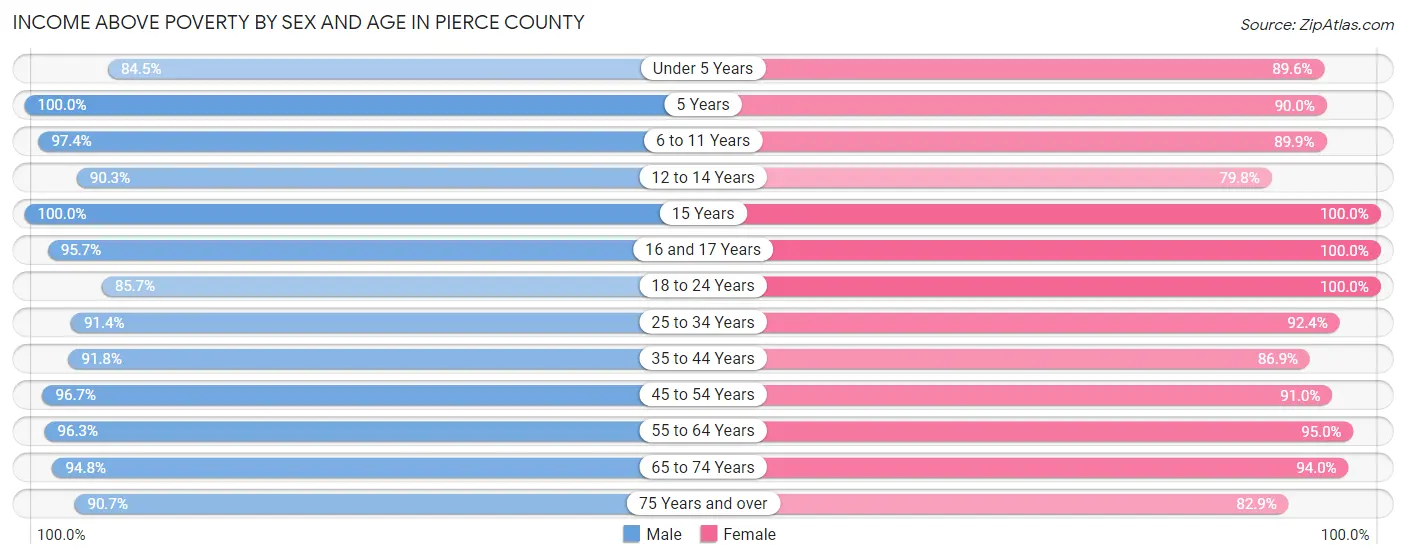
| Age Bracket | Male | Female |
| Under 5 Years | 202 (84.5%) | 258 (89.6%) |
| 5 Years | 22 (100.0%) | 36 (90.0%) |
| 6 to 11 Years | 340 (97.4%) | 250 (89.9%) |
| 12 to 14 Years | 93 (90.3%) | 134 (79.8%) |
| 15 Years | 47 (100.0%) | 41 (100.0%) |
| 16 and 17 Years | 111 (95.7%) | 126 (100.0%) |
| 18 to 24 Years | 245 (85.7%) | 232 (100.0%) |
| 25 to 34 Years | 359 (91.3%) | 316 (92.4%) |
| 35 to 44 Years | 439 (91.8%) | 358 (86.9%) |
| 45 to 54 Years | 375 (96.7%) | 366 (91.0%) |
| 55 to 64 Years | 544 (96.3%) | 490 (95.0%) |
| 65 to 74 Years | 364 (94.8%) | 347 (94.0%) |
| 75 Years and over | 225 (90.7%) | 277 (82.9%) |
| Total | 3,366 (93.0%) | 3,231 (91.1%) |
Income Below Poverty Among Married-Couple Families in Pierce County
The poverty statistics for married-couple families in Pierce County show that 3.9% or 66 of the total 1,711 families live below the poverty line. Families with 1 or 2 children have the highest poverty rate of 4.5%, comprising of 21 families. On the other hand, families with 5 or more children have the lowest poverty rate of 0.0%, which includes 0 families.
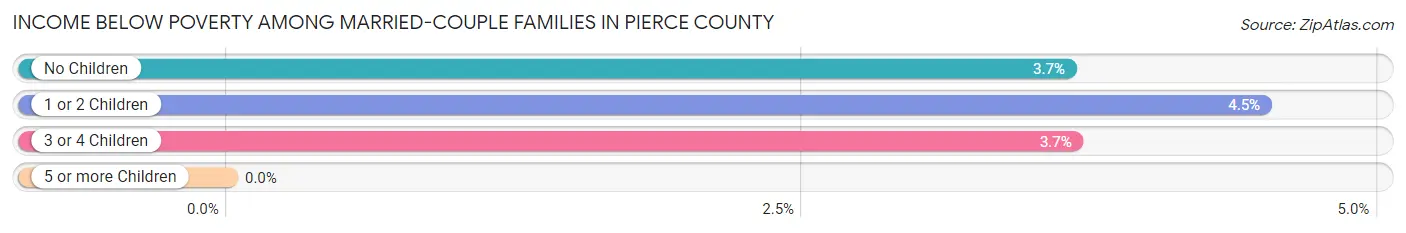
| Children | Above Poverty | Below Poverty |
| No Children | 1,030 (96.4%) | 39 (3.6%) |
| 1 or 2 Children | 446 (95.5%) | 21 (4.5%) |
| 3 or 4 Children | 157 (96.3%) | 6 (3.7%) |
| 5 or more Children | 12 (100.0%) | 0 (0.0%) |
| Total | 1,645 (96.1%) | 66 (3.9%) |
Income Below Poverty Among Single-Parent Households in Pierce County
According to the poverty data in Pierce County, 10.0% or 7 single-father households and 21.0% or 38 single-mother households are living below the poverty line. Among single-father households, those with 1 or 2 children have the highest poverty rate, with 6 households (17.1%) experiencing poverty. Likewise, among single-mother households, those with 5 or more children have the highest poverty rate, with 8 households (100.0%) falling below the poverty line.
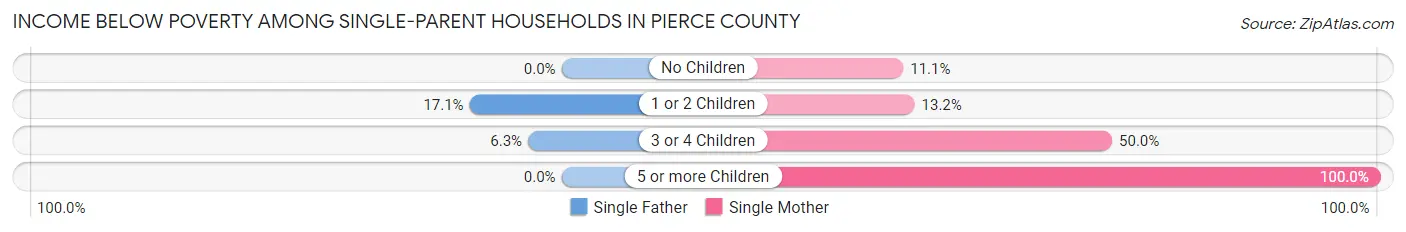
| Children | Single Father | Single Mother |
| No Children | 0 (0.0%) | 5 (11.1%) |
| 1 or 2 Children | 6 (17.1%) | 14 (13.2%) |
| 3 or 4 Children | 1 (6.2%) | 11 (50.0%) |
| 5 or more Children | 0 (0.0%) | 8 (100.0%) |
| Total | 7 (10.0%) | 38 (21.0%) |
Income Below Poverty Among Married-Couple vs Single-Parent Households in Pierce County
The poverty data for Pierce County shows that 66 of the married-couple family households (3.9%) and 45 of the single-parent households (17.9%) are living below the poverty level. Within the married-couple family households, those with 1 or 2 children have the highest poverty rate, with 21 households (4.5%) falling below the poverty line. Among the single-parent households, those with 5 or more children have the highest poverty rate, with 8 household (100.0%) living below poverty.
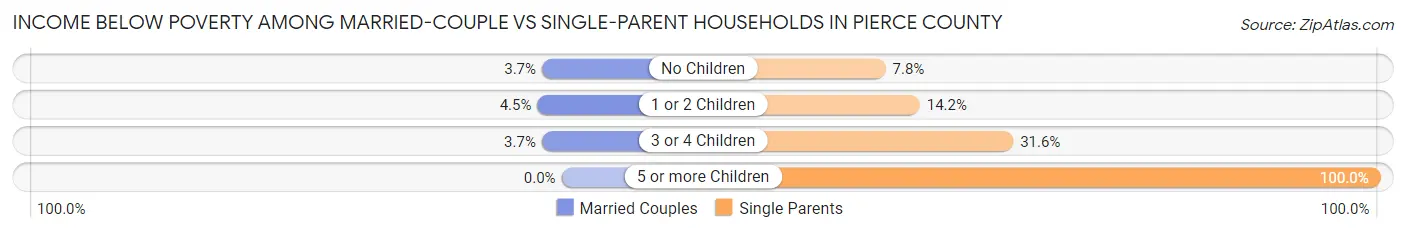
| Children | Married-Couple Families | Single-Parent Households |
| No Children | 39 (3.6%) | 5 (7.8%) |
| 1 or 2 Children | 21 (4.5%) | 20 (14.2%) |
| 3 or 4 Children | 6 (3.7%) | 12 (31.6%) |
| 5 or more Children | 0 (0.0%) | 8 (100.0%) |
| Total | 66 (3.9%) | 45 (17.9%) |
Race in Pierce County
The most populous races in Pierce County are White / Caucasian (7,022 | 96.2%), Two or more Races (215 | 2.9%), and Hispanic or Latino (167 | 2.3%).
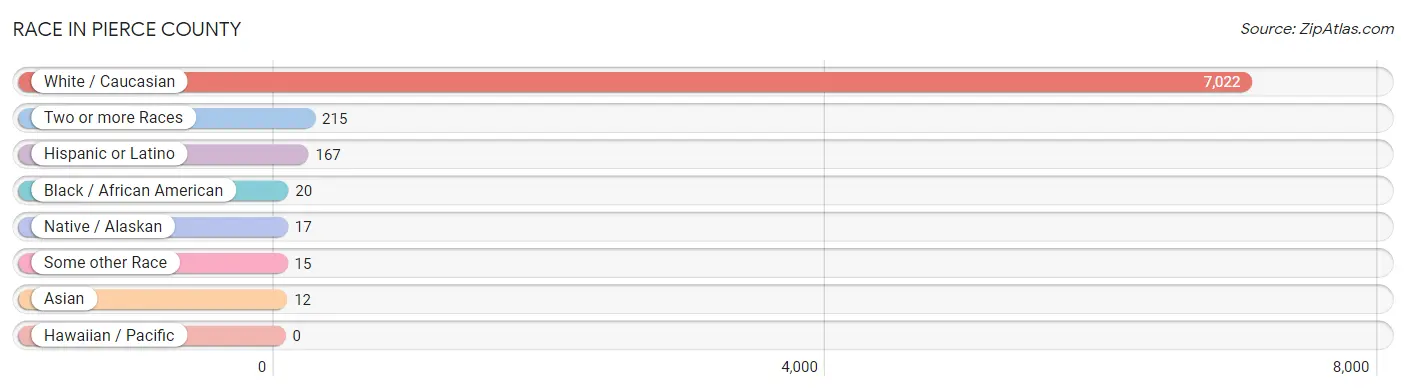
| Race | # Population | % Population |
| Asian | 12 | 0.2% |
| Black / African American | 20 | 0.3% |
| Hawaiian / Pacific | 0 | 0.0% |
| Hispanic or Latino | 167 | 2.3% |
| Native / Alaskan | 17 | 0.2% |
| White / Caucasian | 7,022 | 96.2% |
| Two or more Races | 215 | 2.9% |
| Some other Race | 15 | 0.2% |
| Total | 7,301 | 100.0% |
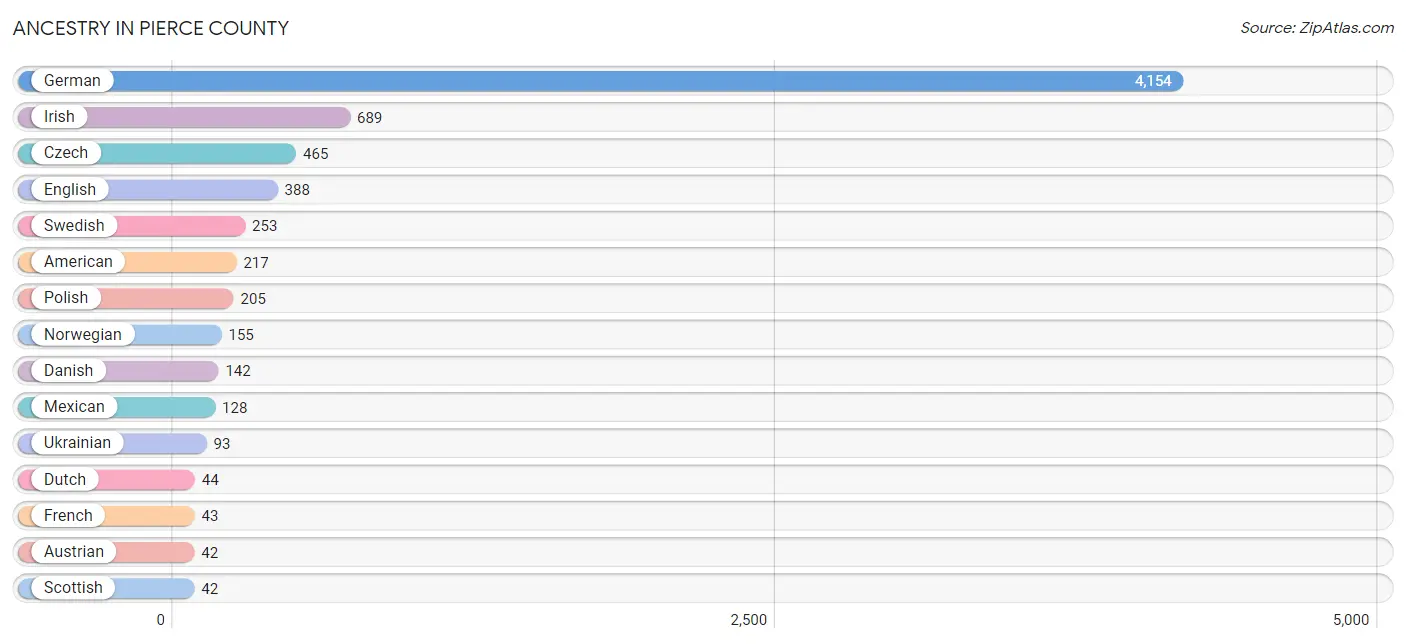
Ancestry in Pierce County
The most populous ancestries reported in Pierce County are German (4,154 | 56.9%), Irish (689 | 9.4%), Czech (465 | 6.4%), English (388 | 5.3%), and Swedish (253 | 3.5%), together accounting for 81.5% of all Pierce County residents.
| Ancestry | # Population | % Population |
| American | 217 | 3.0% |
| Austrian | 42 | 0.6% |
| Bangladeshi | 5 | 0.1% |
| Belgian | 4 | 0.1% |
| British | 34 | 0.5% |
| Canadian | 36 | 0.5% |
| Choctaw | 6 | 0.1% |
| Cuban | 21 | 0.3% |
| Czech | 465 | 6.4% |
| Czechoslovakian | 12 | 0.2% |
| Danish | 142 | 1.9% |
| Dutch | 44 | 0.6% |
| English | 388 | 5.3% |
| European | 40 | 0.5% |
| French | 43 | 0.6% |
| French Canadian | 3 | 0.0% |
| German | 4,154 | 56.9% |
| Icelander | 2 | 0.0% |
| Indian (Asian) | 4 | 0.1% |
| Irish | 689 | 9.4% |
| Italian | 28 | 0.4% |
| Mexican | 128 | 1.8% |
| Northern European | 30 | 0.4% |
| Norwegian | 155 | 2.1% |
| Pakistani | 5 | 0.1% |
| Polish | 205 | 2.8% |
| Puerto Rican | 4 | 0.1% |
| Russian | 3 | 0.0% |
| Scandinavian | 8 | 0.1% |
| Scotch-Irish | 38 | 0.5% |
| Scottish | 42 | 0.6% |
| Sioux | 19 | 0.3% |
| Swedish | 253 | 3.5% |
| Swiss | 20 | 0.3% |
| Ukrainian | 93 | 1.3% |
| Welsh | 20 | 0.3% | View All 36 Rows |
Immigrants in Pierce County
The most numerous immigrant groups reported in Pierce County came from Latin America (76 | 1.0%), Central America (71 | 1.0%), Mexico (70 | 1.0%), Canada (7 | 0.1%), and Europe (6 | 0.1%), together accounting for 3.2% of all Pierce County residents.
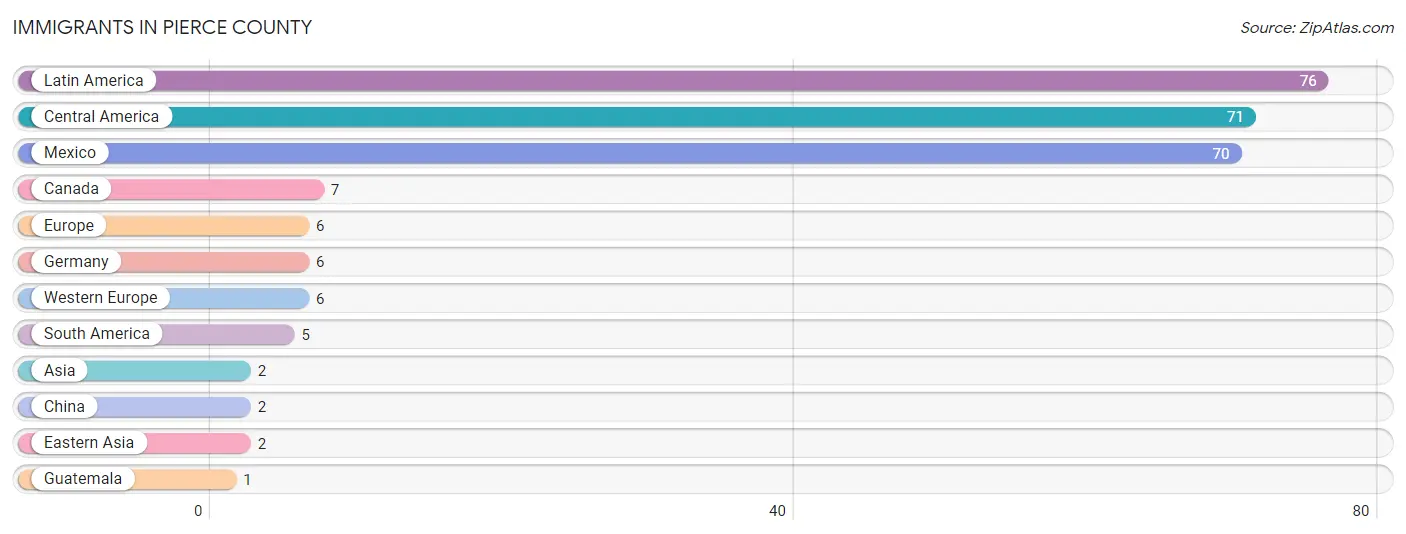
| Immigration Origin | # Population | % Population |
| Asia | 2 | 0.0% |
| Canada | 7 | 0.1% |
| Central America | 71 | 1.0% |
| China | 2 | 0.0% |
| Eastern Asia | 2 | 0.0% |
| Europe | 6 | 0.1% |
| Germany | 6 | 0.1% |
| Guatemala | 1 | 0.0% |
| Latin America | 76 | 1.0% |
| Mexico | 70 | 1.0% |
| South America | 5 | 0.1% |
| Western Europe | 6 | 0.1% | View All 12 Rows |
Sex and Age in Pierce County
Sex and Age in Pierce County
The most populous age groups in Pierce County are 55 to 59 Years (331 | 9.0%) for men and 35 to 39 Years (289 | 8.0%) for women.
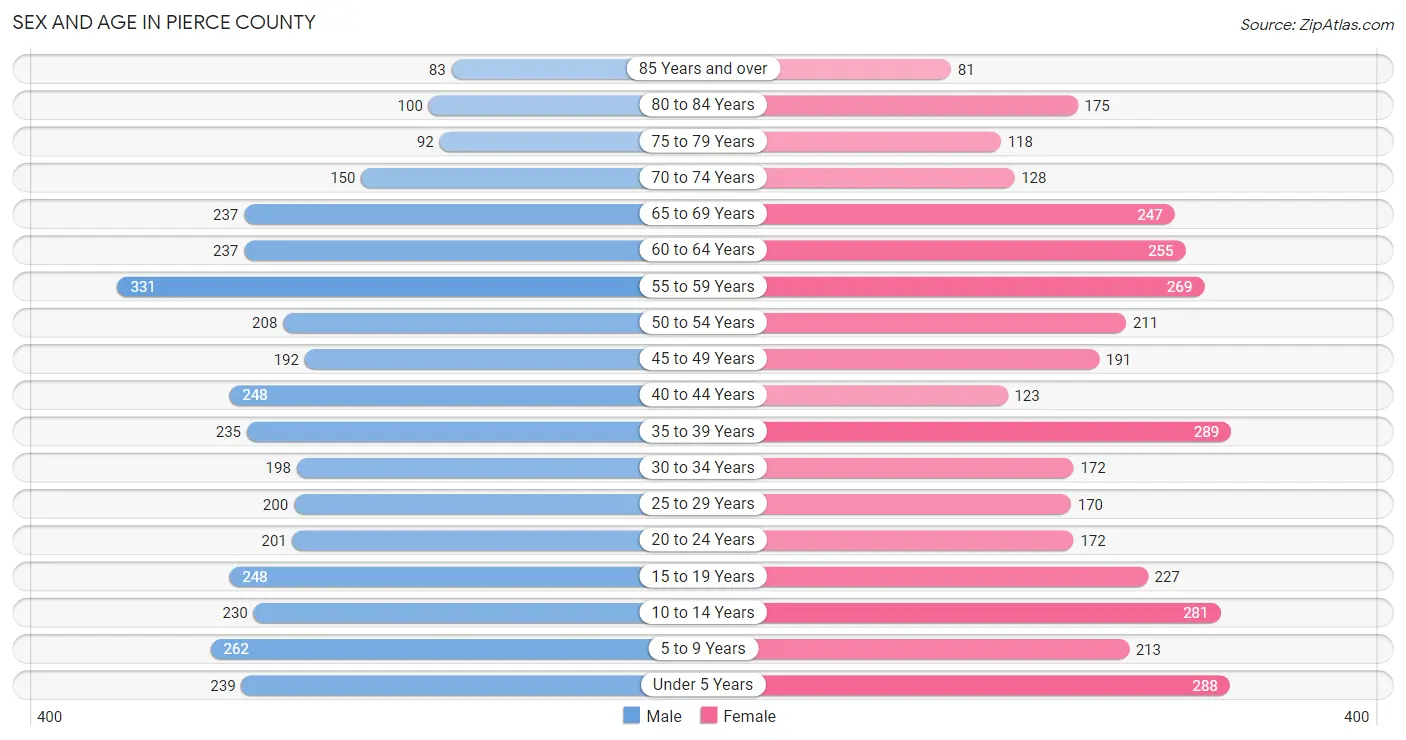
| Age Bracket | Male | Female |
| Under 5 Years | 239 (6.5%) | 288 (8.0%) |
| 5 to 9 Years | 262 (7.1%) | 213 (5.9%) |
| 10 to 14 Years | 230 (6.2%) | 281 (7.8%) |
| 15 to 19 Years | 248 (6.7%) | 227 (6.3%) |
| 20 to 24 Years | 201 (5.4%) | 172 (4.8%) |
| 25 to 29 Years | 200 (5.4%) | 170 (4.7%) |
| 30 to 34 Years | 198 (5.4%) | 172 (4.8%) |
| 35 to 39 Years | 235 (6.4%) | 289 (8.0%) |
| 40 to 44 Years | 248 (6.7%) | 123 (3.4%) |
| 45 to 49 Years | 192 (5.2%) | 191 (5.3%) |
| 50 to 54 Years | 208 (5.6%) | 211 (5.8%) |
| 55 to 59 Years | 331 (9.0%) | 269 (7.4%) |
| 60 to 64 Years | 237 (6.4%) | 255 (7.1%) |
| 65 to 69 Years | 237 (6.4%) | 247 (6.8%) |
| 70 to 74 Years | 150 (4.1%) | 128 (3.5%) |
| 75 to 79 Years | 92 (2.5%) | 118 (3.3%) |
| 80 to 84 Years | 100 (2.7%) | 175 (4.9%) |
| 85 Years and over | 83 (2.2%) | 81 (2.2%) |
| Total | 3,691 (100.0%) | 3,610 (100.0%) |
Families and Households in Pierce County
Median Family Size in Pierce County
The median family size in Pierce County is 3.09 persons per family, with single female/mother families (181 | 9.2%) accounting for the largest median family size of 3.43 persons per family. On the other hand, single male/father families (70 | 3.6%) represent the smallest median family size with 2.81 persons per family.
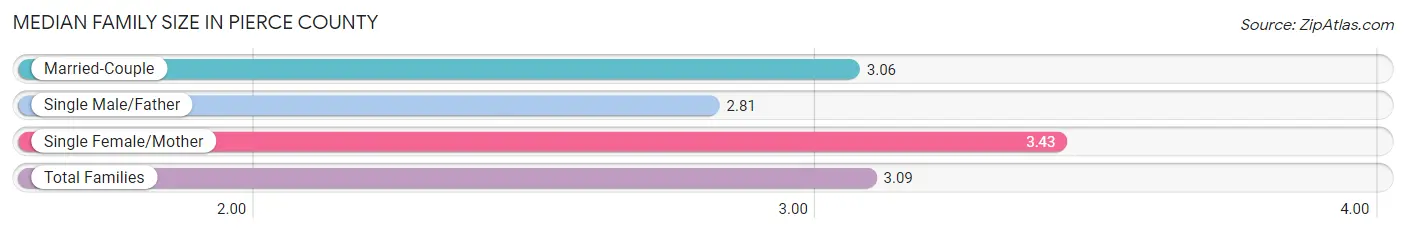
| Family Type | # Families | Family Size |
| Married-Couple | 1,711 (87.2%) | 3.06 |
| Single Male/Father | 70 (3.6%) | 2.81 |
| Single Female/Mother | 181 (9.2%) | 3.43 |
| Total Families | 1,962 (100.0%) | 3.09 |
Median Household Size in Pierce County
The median household size in Pierce County is 2.50 persons per household, with single male/father households (70 | 2.4%) accounting for the largest median household size of 3.57 persons per household. non-family households (914 | 31.8%) represent the smallest median household size with 1.14 persons per household.
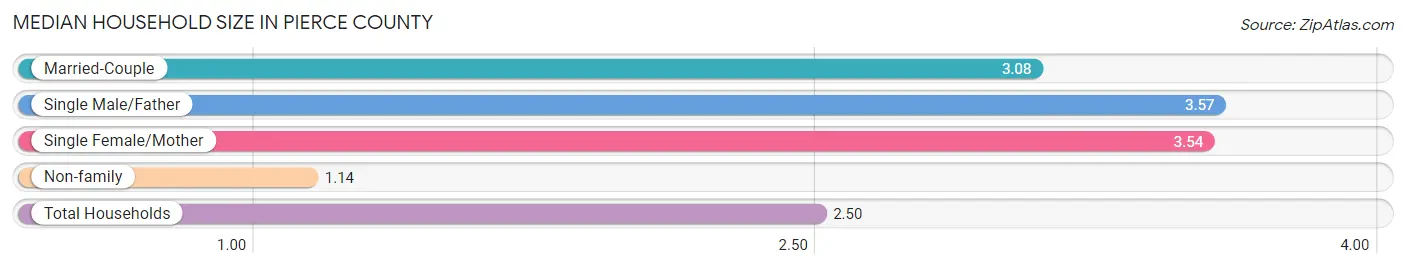
| Household Type | # Households | Household Size |
| Married-Couple | 1,711 (59.5%) | 3.08 |
| Single Male/Father | 70 (2.4%) | 3.57 |
| Single Female/Mother | 181 (6.3%) | 3.54 |
| Non-family | 914 (31.8%) | 1.14 |
| Total Households | 2,876 (100.0%) | 2.50 |
Household Size by Marriage Status in Pierce County
Out of a total of 2,876 households in Pierce County, 1,962 (68.2%) are family households, while 914 (31.8%) are nonfamily households. The most numerous type of family households are 2-person households, comprising 1,003, and the most common type of nonfamily households are 1-person households, comprising 802.
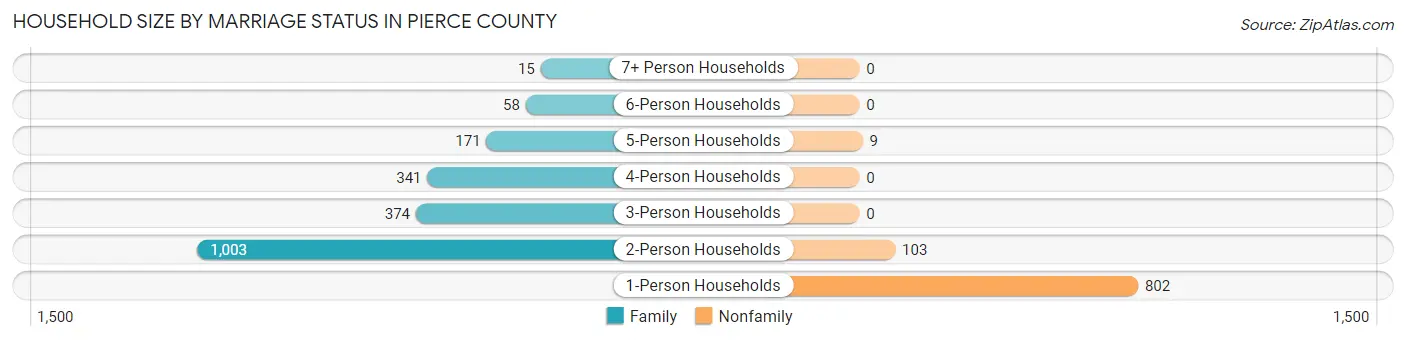
| Household Size | Family Households | Nonfamily Households |
| 1-Person Households | - | 802 (27.9%) |
| 2-Person Households | 1,003 (34.9%) | 103 (3.6%) |
| 3-Person Households | 374 (13.0%) | 0 (0.0%) |
| 4-Person Households | 341 (11.9%) | 0 (0.0%) |
| 5-Person Households | 171 (5.9%) | 9 (0.3%) |
| 6-Person Households | 58 (2.0%) | 0 (0.0%) |
| 7+ Person Households | 15 (0.5%) | 0 (0.0%) |
| Total | 1,962 (68.2%) | 914 (31.8%) |
Female Fertility in Pierce County
Fertility by Age in Pierce County
Average fertility rate in Pierce County is 78.0 births per 1,000 women. Women in the age bracket of 20 to 34 years have the highest fertility rate with 179.0 births per 1,000 women. Women in the age bracket of 20 to 34 years acount for 86.0% of all women with births.
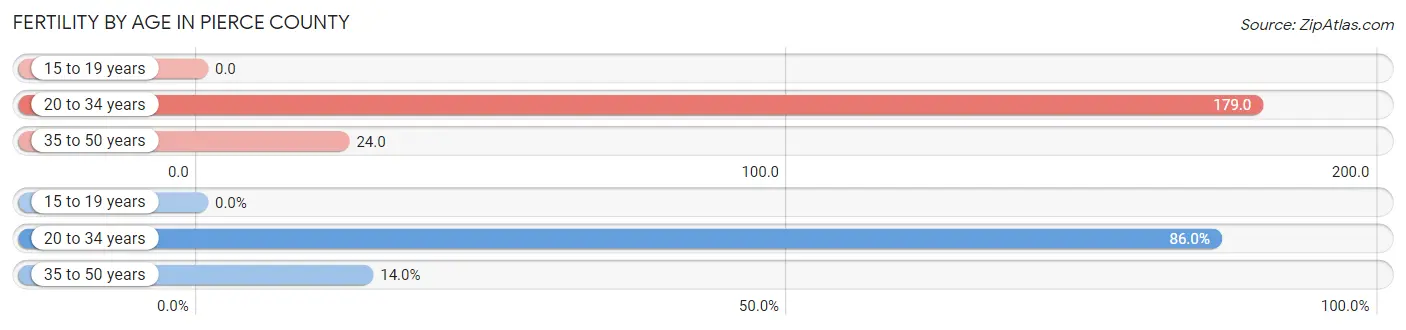
| Age Bracket | Women with Births | Births / 1,000 Women |
| 15 to 19 years | 0 (0.0%) | 0.0 |
| 20 to 34 years | 92 (86.0%) | 179.0 |
| 35 to 50 years | 15 (14.0%) | 24.0 |
| Total | 107 (100.0%) | 78.0 |
Fertility by Age by Marriage Status in Pierce County
71.0% of women with births (107) in Pierce County are married. The highest percentage of unmarried women with births falls into 35 to 50 years age bracket with 100.0% of them unmarried at the time of birth, while the lowest percentage of unmarried women with births belong to 20 to 34 years age bracket with 17.4% of them unmarried.
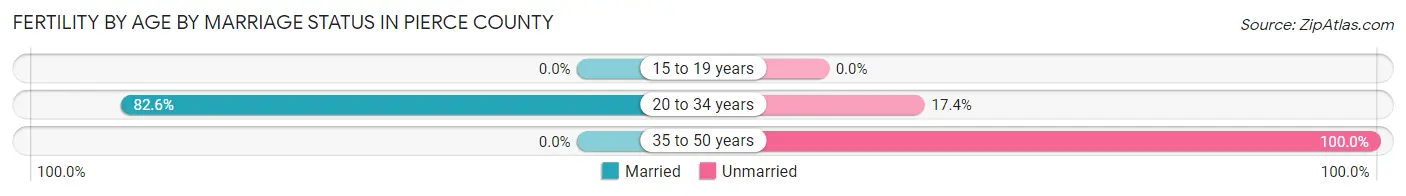
| Age Bracket | Married | Unmarried |
| 15 to 19 years | 0 (0.0%) | 0 (0.0%) |
| 20 to 34 years | 76 (82.6%) | 16 (17.4%) |
| 35 to 50 years | 0 (0.0%) | 15 (100.0%) |
| Total | 76 (71.0%) | 31 (29.0%) |
Fertility by Education in Pierce County
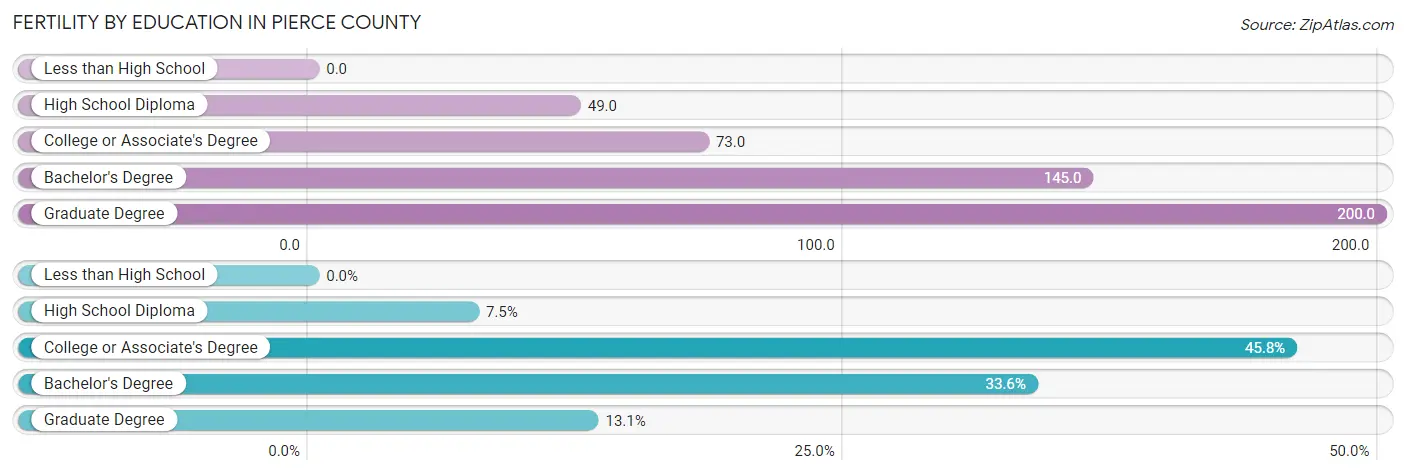
| Educational Attainment | Women with Births | Births / 1,000 Women |
| Less than High School | 0 (0.0%) | 0.0 |
| High School Diploma | 8 (7.5%) | 49.0 |
| College or Associate's Degree | 49 (45.8%) | 73.0 |
| Bachelor's Degree | 36 (33.6%) | 145.0 |
| Graduate Degree | 14 (13.1%) | 200.0 |
| Total | 107 (100.0%) | 78.0 |
Fertility by Education by Marriage Status in Pierce County
29.0% of women with births in Pierce County are unmarried. Women with the educational attainment of graduate degree are most likely to be married with 100.0% of them married at childbirth, while women with the educational attainment of high school diploma are least likely to be married with 100.0% of them unmarried at childbirth.
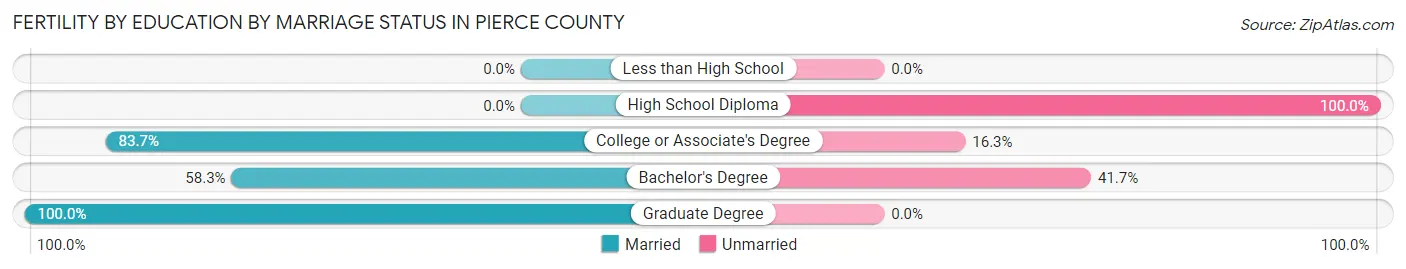
| Educational Attainment | Married | Unmarried |
| Less than High School | 0 (0.0%) | 0 (0.0%) |
| High School Diploma | 0 (0.0%) | 8 (100.0%) |
| College or Associate's Degree | 41 (83.7%) | 8 (16.3%) |
| Bachelor's Degree | 21 (58.3%) | 15 (41.7%) |
| Graduate Degree | 14 (100.0%) | 0 (0.0%) |
| Total | 76 (71.0%) | 31 (29.0%) |
Employment Characteristics in Pierce County
Employment by Class of Employer in Pierce County
Among the 3,685 employed individuals in Pierce County, private company employees (2,147 | 58.3%), self-employed (not incorporated) (511 | 13.9%), and local government employees (333 | 9.0%) make up the most common classes of employment.
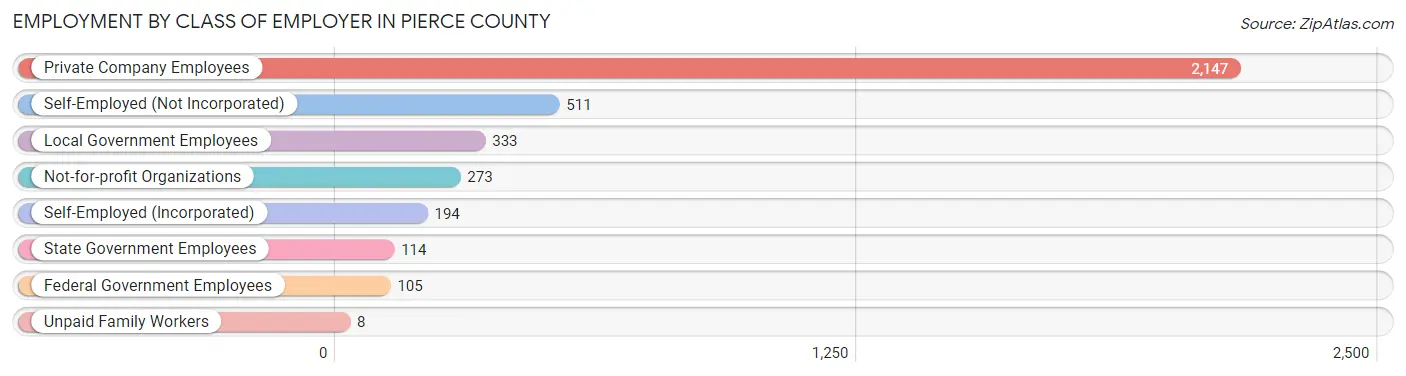
| Employer Class | # Employees | % Employees |
| Private Company Employees | 2,147 | 58.3% |
| Self-Employed (Incorporated) | 194 | 5.3% |
| Self-Employed (Not Incorporated) | 511 | 13.9% |
| Not-for-profit Organizations | 273 | 7.4% |
| Local Government Employees | 333 | 9.0% |
| State Government Employees | 114 | 3.1% |
| Federal Government Employees | 105 | 2.9% |
| Unpaid Family Workers | 8 | 0.2% |
| Total | 3,685 | 100.0% |
Employment Status by Age in Pierce County
According to the labor force statistics for Pierce County, out of the total population over 16 years of age (5,700), 68.0% or 3,876 individuals are in the labor force, with 2.4% or 93 of them unemployed. The age group with the highest labor force participation rate is 30 to 34 years, with 94.6% or 350 individuals in the labor force. Within the labor force, the 20 to 24 years age range has the highest percentage of unemployed individuals, with 9.0% or 29 of them being unemployed.
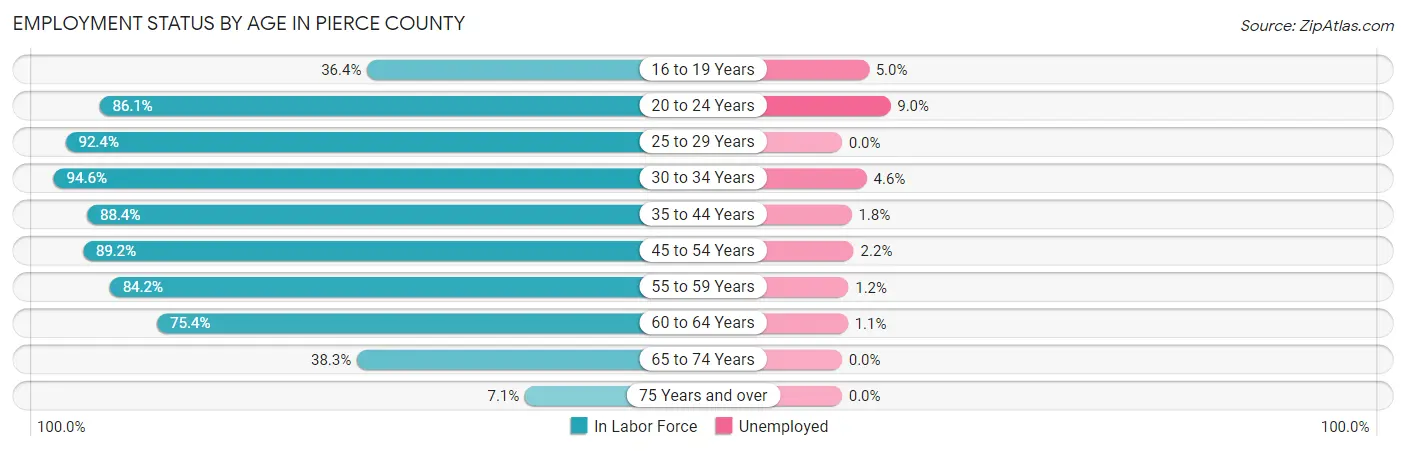
| Age Bracket | In Labor Force | Unemployed |
| 16 to 19 Years | 141 (36.4%) | 7 (5.0%) |
| 20 to 24 Years | 321 (86.1%) | 29 (9.0%) |
| 25 to 29 Years | 342 (92.4%) | 0 (0.0%) |
| 30 to 34 Years | 350 (94.6%) | 16 (4.6%) |
| 35 to 44 Years | 791 (88.4%) | 14 (1.8%) |
| 45 to 54 Years | 715 (89.2%) | 16 (2.2%) |
| 55 to 59 Years | 505 (84.2%) | 6 (1.2%) |
| 60 to 64 Years | 371 (75.4%) | 4 (1.1%) |
| 65 to 74 Years | 292 (38.3%) | 0 (0.0%) |
| 75 Years and over | 46 (7.1%) | 0 (0.0%) |
| Total | 3,876 (68.0%) | 93 (2.4%) |
Employment Status by Educational Attainment in Pierce County
According to labor force statistics for Pierce County, 87.1% of individuals (3,074) out of the total population between 25 and 64 years of age (3,529) are in the labor force, with 1.8% or 55 of them being unemployed. The group with the highest labor force participation rate are those with the educational attainment of college / associate degree, with 90.9% or 1,454 individuals in the labor force. Within the labor force, individuals with college / associate degree education have the highest percentage of unemployment, with 2.3% or 33 of them being unemployed.
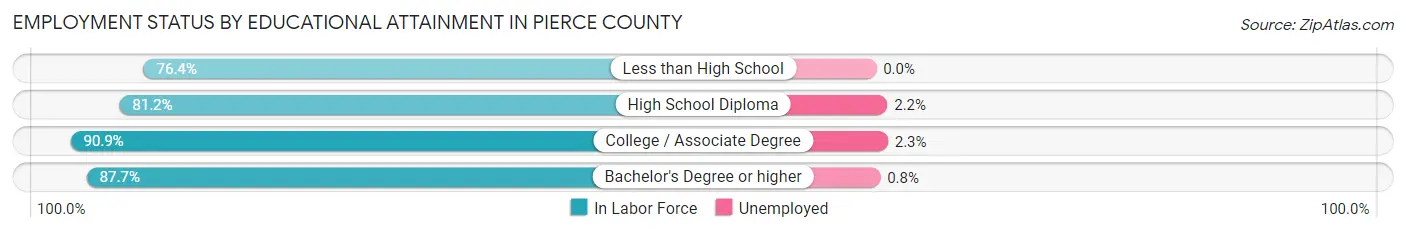
| Educational Attainment | In Labor Force | Unemployed |
| Less than High School | 68 (76.4%) | 0 (0.0%) |
| High School Diploma | 775 (81.2%) | 21 (2.2%) |
| College / Associate Degree | 1,454 (90.9%) | 37 (2.3%) |
| Bachelor's Degree or higher | 776 (87.7%) | 7 (0.8%) |
| Total | 3,074 (87.1%) | 64 (1.8%) |
Employment Occupations by Sex in Pierce County
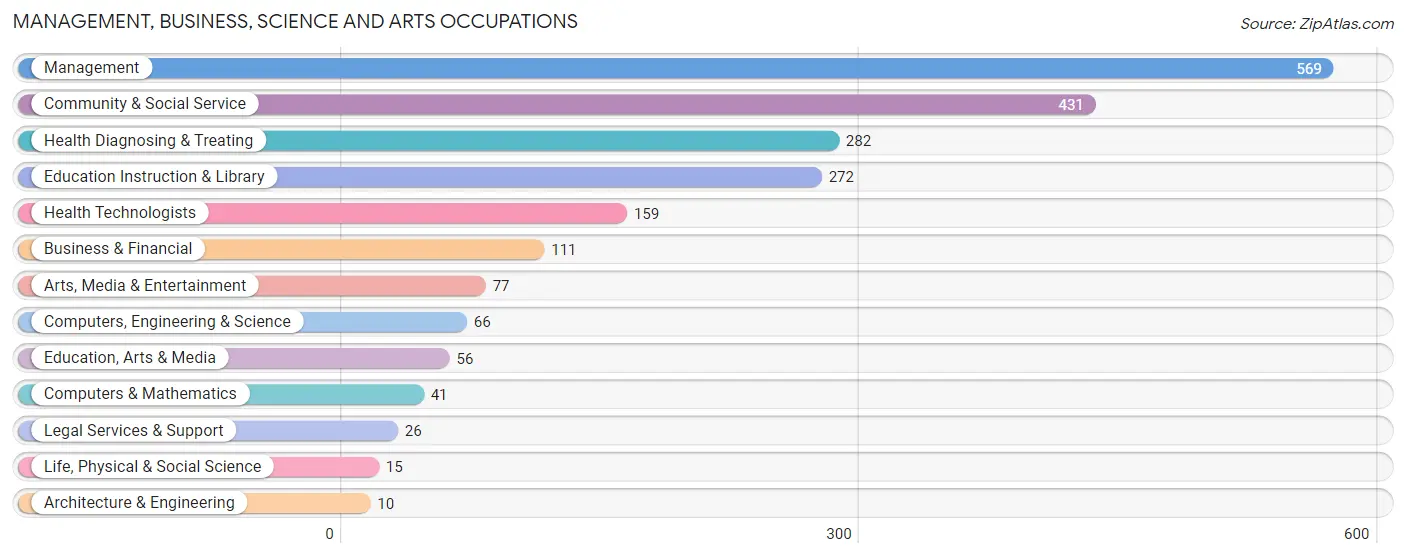
Management, Business, Science and Arts Occupations
The most common Management, Business, Science and Arts occupations in Pierce County are Management (569 | 15.0%), Community & Social Service (431 | 11.4%), Health Diagnosing & Treating (282 | 7.5%), Education Instruction & Library (272 | 7.2%), and Health Technologists (159 | 4.2%).
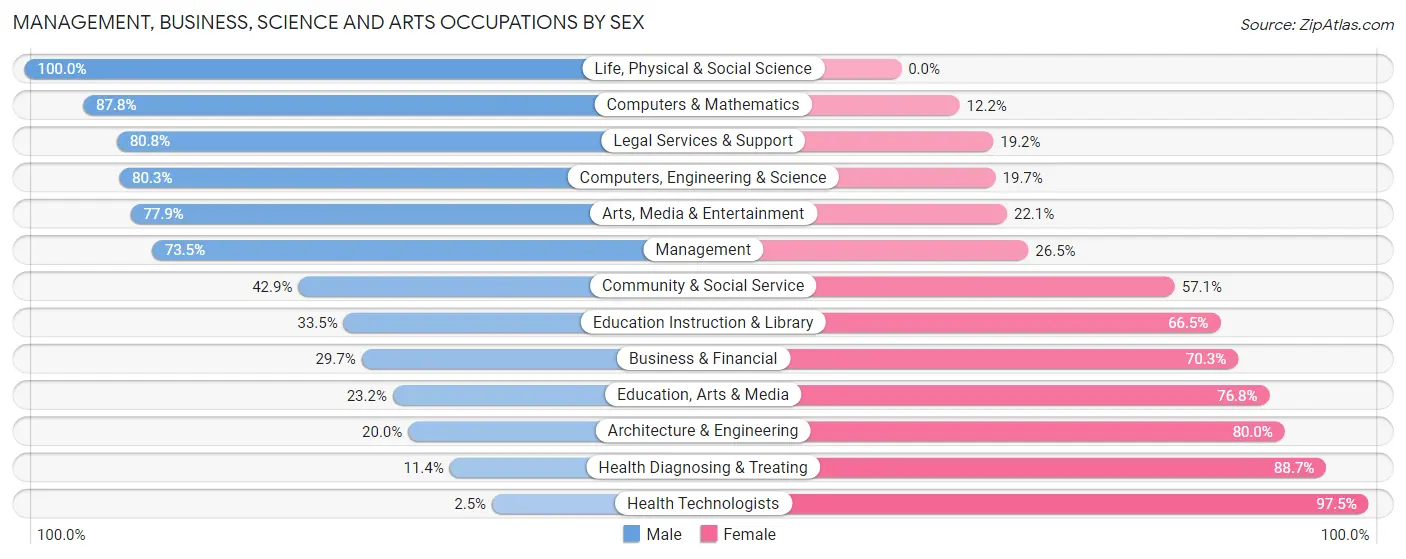
Management, Business, Science and Arts Occupations by Sex
Within the Management, Business, Science and Arts occupations in Pierce County, the most male-oriented occupations are Life, Physical & Social Science (100.0%), Computers & Mathematics (87.8%), and Legal Services & Support (80.8%), while the most female-oriented occupations are Health Technologists (97.5%), Health Diagnosing & Treating (88.6%), and Architecture & Engineering (80.0%).
| Occupation | Male | Female |
| Management | 418 (73.5%) | 151 (26.5%) |
| Business & Financial | 33 (29.7%) | 78 (70.3%) |
| Computers, Engineering & Science | 53 (80.3%) | 13 (19.7%) |
| Computers & Mathematics | 36 (87.8%) | 5 (12.2%) |
| Architecture & Engineering | 2 (20.0%) | 8 (80.0%) |
| Life, Physical & Social Science | 15 (100.0%) | 0 (0.0%) |
| Community & Social Service | 185 (42.9%) | 246 (57.1%) |
| Education, Arts & Media | 13 (23.2%) | 43 (76.8%) |
| Legal Services & Support | 21 (80.8%) | 5 (19.2%) |
| Education Instruction & Library | 91 (33.5%) | 181 (66.5%) |
| Arts, Media & Entertainment | 60 (77.9%) | 17 (22.1%) |
| Health Diagnosing & Treating | 32 (11.4%) | 250 (88.6%) |
| Health Technologists | 4 (2.5%) | 155 (97.5%) |
| Total (Category) | 721 (49.4%) | 738 (50.6%) |
| Total (Overall) | 2,078 (54.9%) | 1,704 (45.1%) |
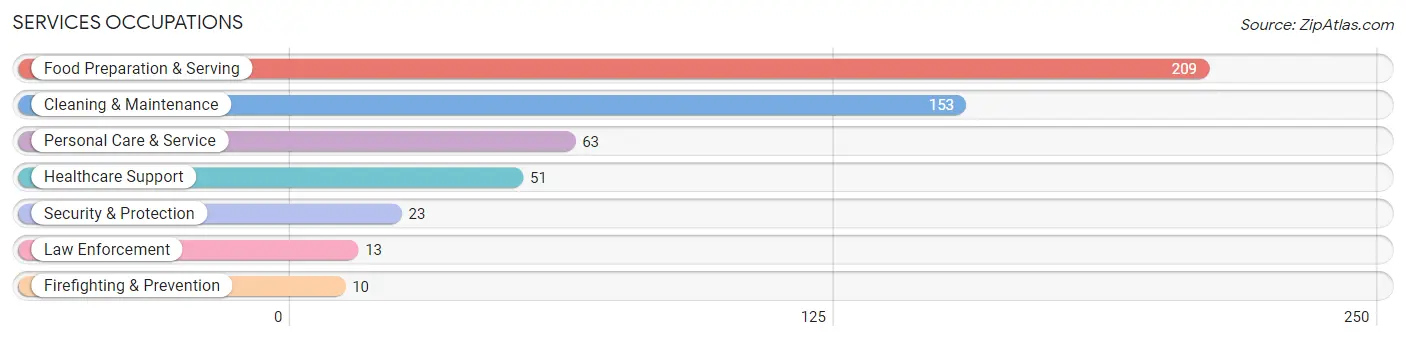
Services Occupations
The most common Services occupations in Pierce County are Food Preparation & Serving (209 | 5.5%), Cleaning & Maintenance (153 | 4.1%), Personal Care & Service (63 | 1.7%), Healthcare Support (51 | 1.3%), and Security & Protection (23 | 0.6%).
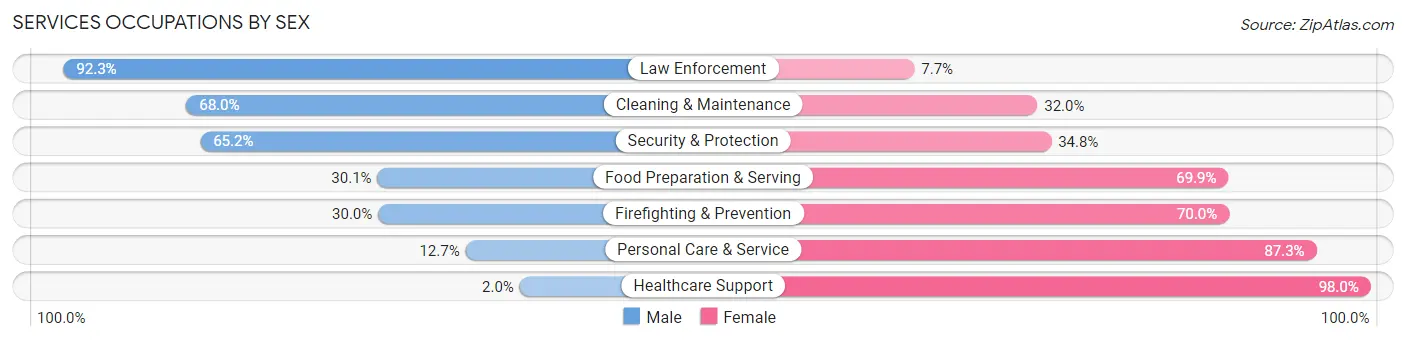
Services Occupations by Sex
Within the Services occupations in Pierce County, the most male-oriented occupations are Law Enforcement (92.3%), Cleaning & Maintenance (68.0%), and Security & Protection (65.2%), while the most female-oriented occupations are Healthcare Support (98.0%), Personal Care & Service (87.3%), and Firefighting & Prevention (70.0%).
| Occupation | Male | Female |
| Healthcare Support | 1 (2.0%) | 50 (98.0%) |
| Security & Protection | 15 (65.2%) | 8 (34.8%) |
| Firefighting & Prevention | 3 (30.0%) | 7 (70.0%) |
| Law Enforcement | 12 (92.3%) | 1 (7.7%) |
| Food Preparation & Serving | 63 (30.1%) | 146 (69.9%) |
| Cleaning & Maintenance | 104 (68.0%) | 49 (32.0%) |
| Personal Care & Service | 8 (12.7%) | 55 (87.3%) |
| Total (Category) | 191 (38.3%) | 308 (61.7%) |
| Total (Overall) | 2,078 (54.9%) | 1,704 (45.1%) |
Sales and Office Occupations
The most common Sales and Office occupations in Pierce County are Office & Administration (459 | 12.1%), and Sales & Related (244 | 6.5%).
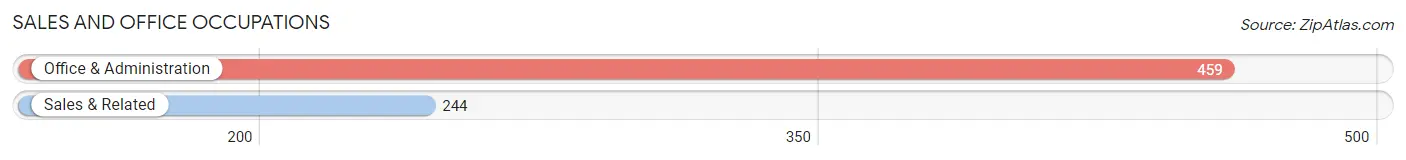
Sales and Office Occupations by Sex
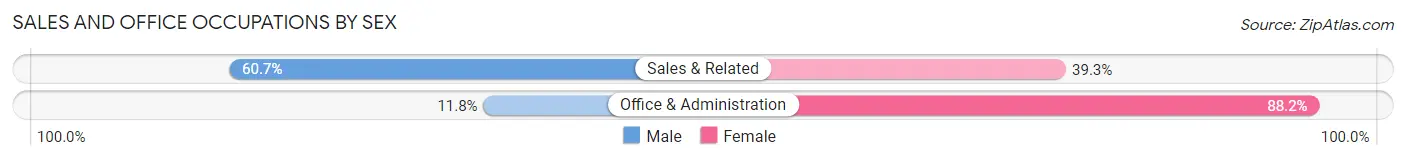
| Occupation | Male | Female |
| Sales & Related | 148 (60.7%) | 96 (39.3%) |
| Office & Administration | 54 (11.8%) | 405 (88.2%) |
| Total (Category) | 202 (28.7%) | 501 (71.3%) |
| Total (Overall) | 2,078 (54.9%) | 1,704 (45.1%) |
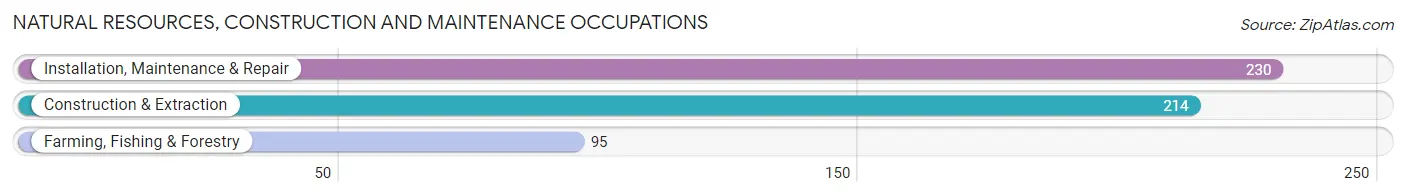
Natural Resources, Construction and Maintenance Occupations
The most common Natural Resources, Construction and Maintenance occupations in Pierce County are Installation, Maintenance & Repair (230 | 6.1%), Construction & Extraction (214 | 5.7%), and Farming, Fishing & Forestry (95 | 2.5%).
Natural Resources, Construction and Maintenance Occupations by Sex
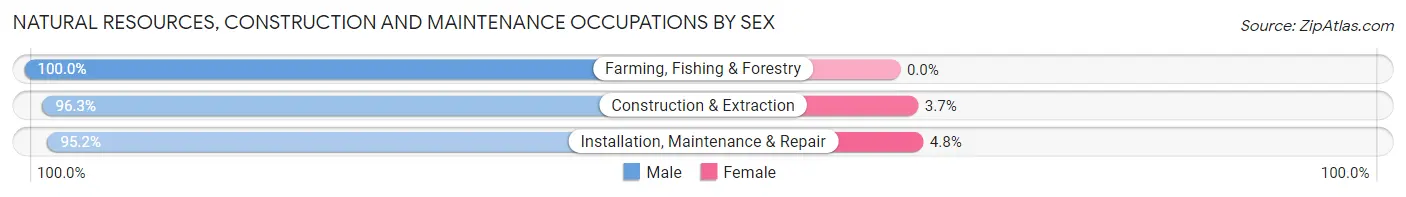
| Occupation | Male | Female |
| Farming, Fishing & Forestry | 95 (100.0%) | 0 (0.0%) |
| Construction & Extraction | 206 (96.3%) | 8 (3.7%) |
| Installation, Maintenance & Repair | 219 (95.2%) | 11 (4.8%) |
| Total (Category) | 520 (96.5%) | 19 (3.5%) |
| Total (Overall) | 2,078 (54.9%) | 1,704 (45.1%) |
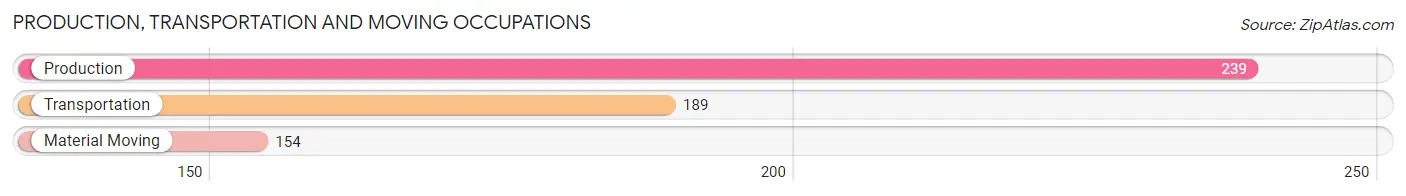
Production, Transportation and Moving Occupations
The most common Production, Transportation and Moving occupations in Pierce County are Production (239 | 6.3%), Transportation (189 | 5.0%), and Material Moving (154 | 4.1%).
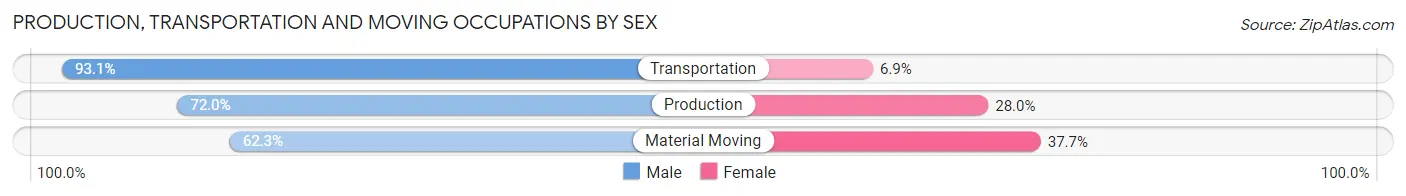
Production, Transportation and Moving Occupations by Sex
| Occupation | Male | Female |
| Production | 172 (72.0%) | 67 (28.0%) |
| Transportation | 176 (93.1%) | 13 (6.9%) |
| Material Moving | 96 (62.3%) | 58 (37.7%) |
| Total (Category) | 444 (76.3%) | 138 (23.7%) |
| Total (Overall) | 2,078 (54.9%) | 1,704 (45.1%) |
Employment Industries by Sex in Pierce County
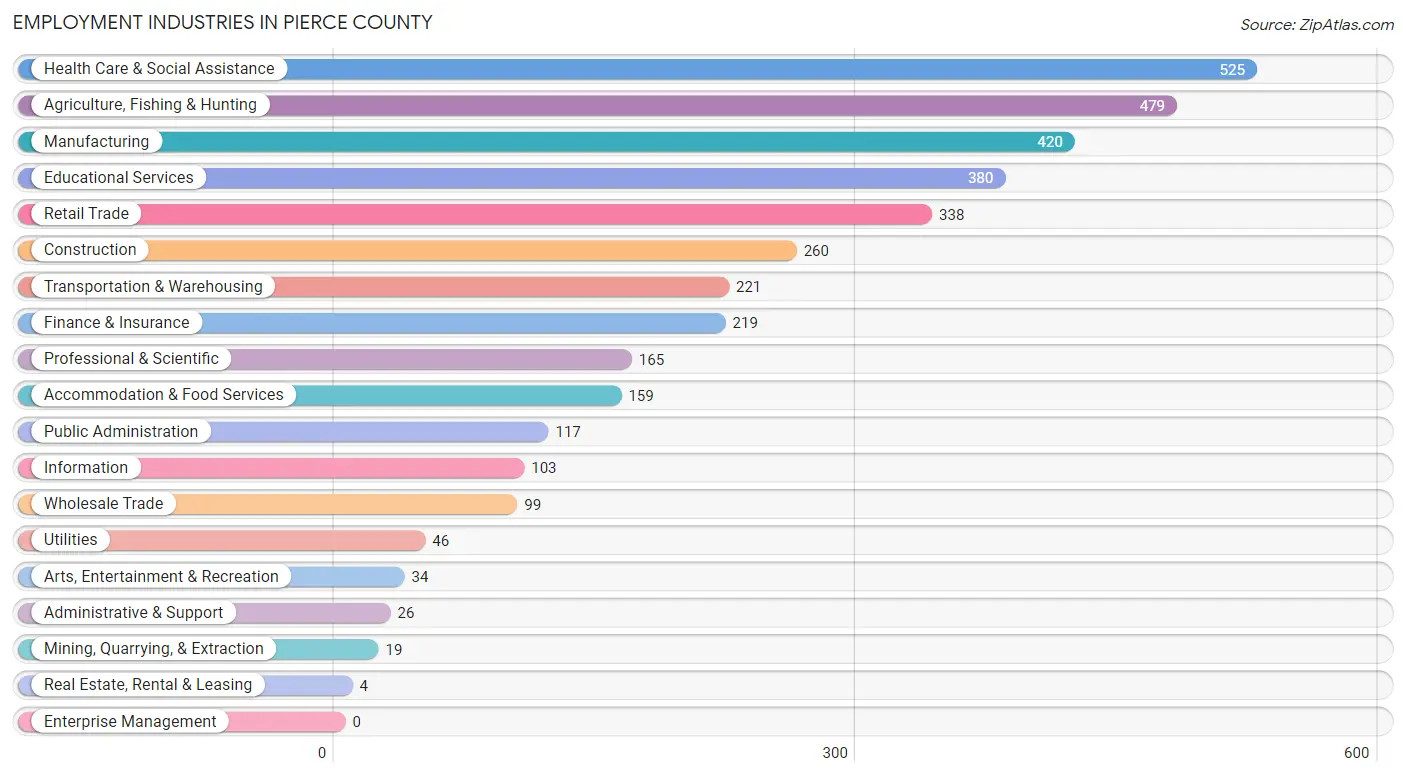
Employment Industries in Pierce County
The major employment industries in Pierce County include Health Care & Social Assistance (525 | 13.9%), Agriculture, Fishing & Hunting (479 | 12.7%), Manufacturing (420 | 11.1%), Educational Services (380 | 10.1%), and Retail Trade (338 | 8.9%).
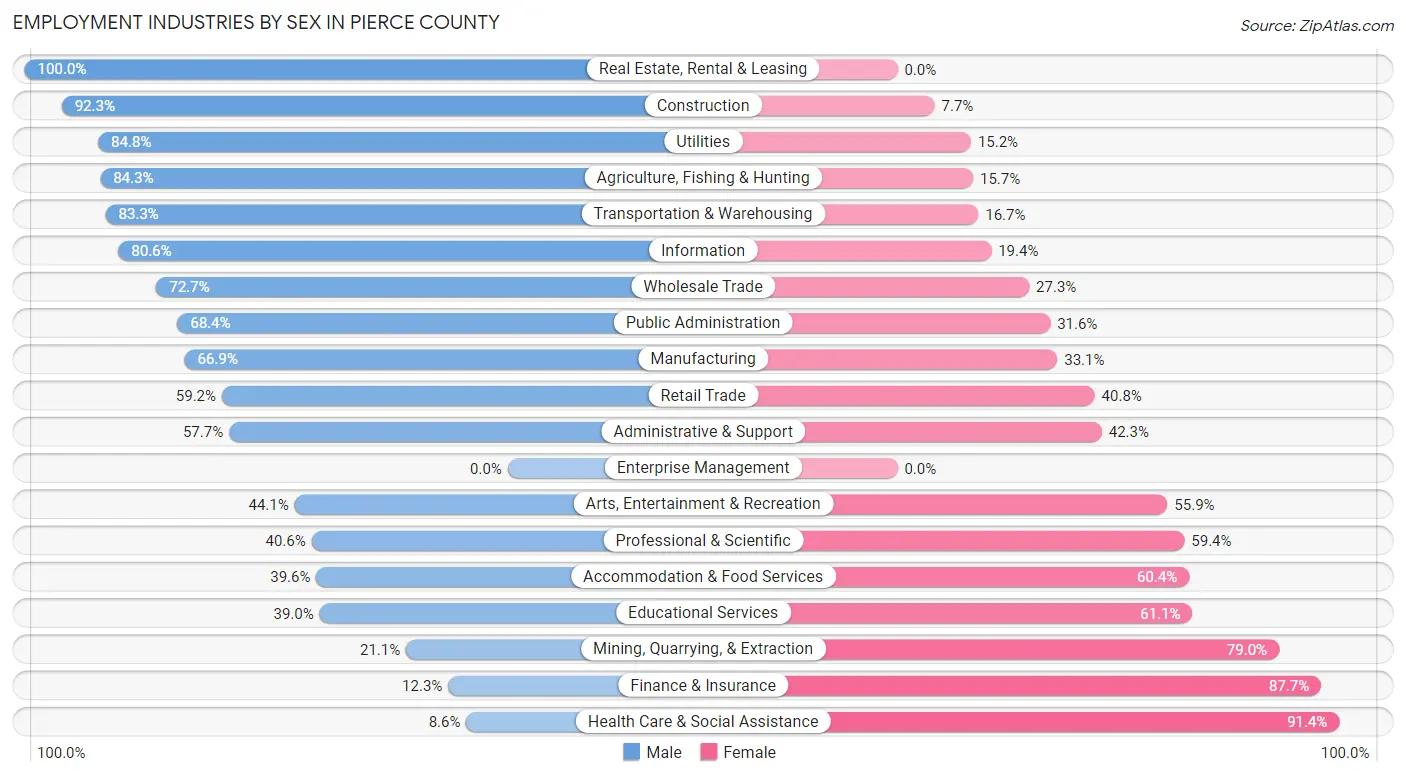
Employment Industries by Sex in Pierce County
The Pierce County industries that see more men than women are Real Estate, Rental & Leasing (100.0%), Construction (92.3%), and Utilities (84.8%), whereas the industries that tend to have a higher number of women are Health Care & Social Assistance (91.4%), Finance & Insurance (87.7%), and Mining, Quarrying, & Extraction (78.9%).
| Industry | Male | Female |
| Agriculture, Fishing & Hunting | 404 (84.3%) | 75 (15.7%) |
| Mining, Quarrying, & Extraction | 4 (21.0%) | 15 (78.9%) |
| Construction | 240 (92.3%) | 20 (7.7%) |
| Manufacturing | 281 (66.9%) | 139 (33.1%) |
| Wholesale Trade | 72 (72.7%) | 27 (27.3%) |
| Retail Trade | 200 (59.2%) | 138 (40.8%) |
| Transportation & Warehousing | 184 (83.3%) | 37 (16.7%) |
| Utilities | 39 (84.8%) | 7 (15.2%) |
| Information | 83 (80.6%) | 20 (19.4%) |
| Finance & Insurance | 27 (12.3%) | 192 (87.7%) |
| Real Estate, Rental & Leasing | 4 (100.0%) | 0 (0.0%) |
| Professional & Scientific | 67 (40.6%) | 98 (59.4%) |
| Enterprise Management | 0 (0.0%) | 0 (0.0%) |
| Administrative & Support | 15 (57.7%) | 11 (42.3%) |
| Educational Services | 148 (39.0%) | 232 (61.1%) |
| Health Care & Social Assistance | 45 (8.6%) | 480 (91.4%) |
| Arts, Entertainment & Recreation | 15 (44.1%) | 19 (55.9%) |
| Accommodation & Food Services | 63 (39.6%) | 96 (60.4%) |
| Public Administration | 80 (68.4%) | 37 (31.6%) |
| Total | 2,078 (54.9%) | 1,704 (45.1%) |
Education in Pierce County
School Enrollment in Pierce County
The most common levels of schooling among the 1,628 students in Pierce County are elementary school (447 | 27.5%), high school (441 | 27.1%), and middle school (406 | 24.9%).
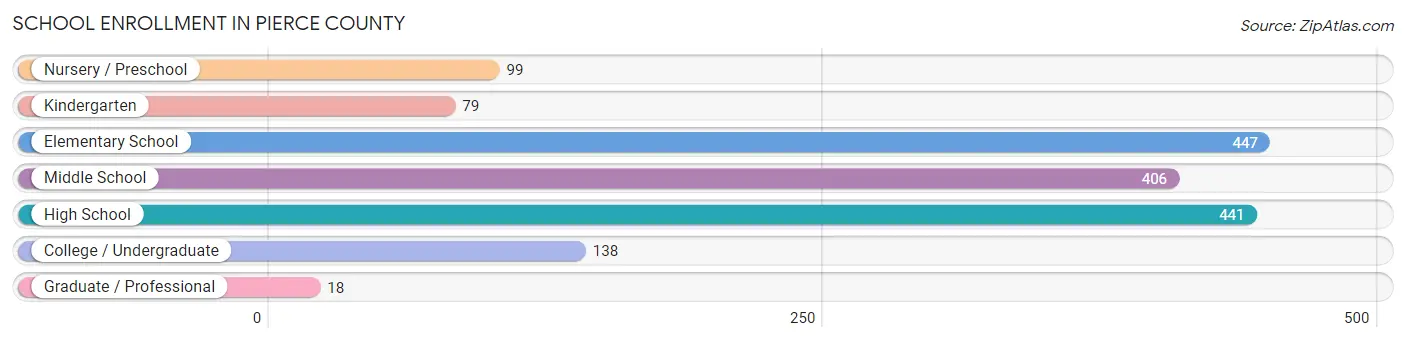
| School Level | # Students | % Students |
| Nursery / Preschool | 99 | 6.1% |
| Kindergarten | 79 | 4.9% |
| Elementary School | 447 | 27.5% |
| Middle School | 406 | 24.9% |
| High School | 441 | 27.1% |
| College / Undergraduate | 138 | 8.5% |
| Graduate / Professional | 18 | 1.1% |
| Total | 1,628 | 100.0% |
School Enrollment by Age by Funding Source in Pierce County
Out of a total of 1,628 students who are enrolled in schools in Pierce County, 169 (10.4%) attend a private institution, while the remaining 1,459 (89.6%) are enrolled in public schools. The age group of 3 to 4 year olds has the highest likelihood of being enrolled in private schools, with 50 (69.4% in the age bracket) enrolled. Conversely, the age group of 20 to 24 year olds has the lowest likelihood of being enrolled in a private school, with 57 (100.0% in the age bracket) attending a public institution.
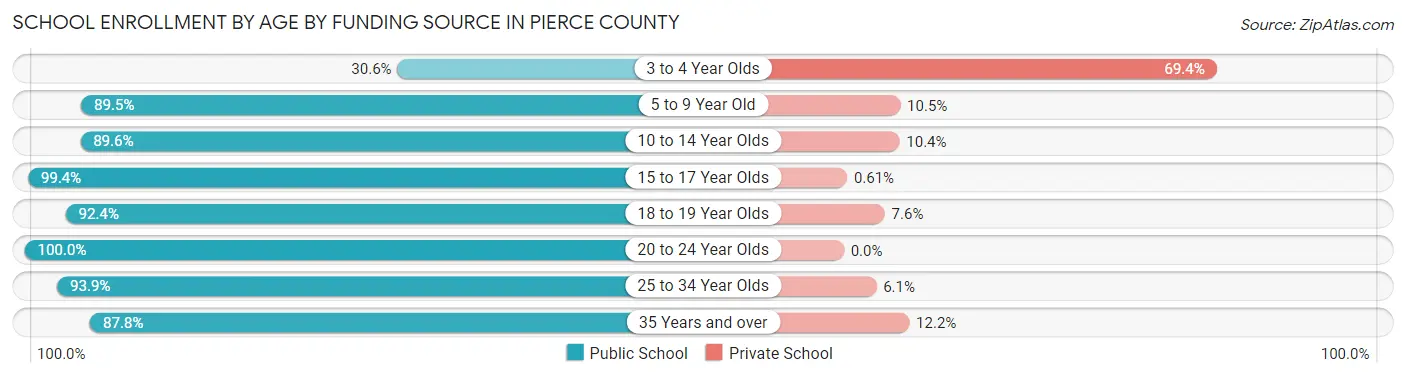
| Age Bracket | Public School | Private School |
| 3 to 4 Year Olds | 22 (30.6%) | 50 (69.4%) |
| 5 to 9 Year Old | 417 (89.5%) | 49 (10.5%) |
| 10 to 14 Year Olds | 458 (89.6%) | 53 (10.4%) |
| 15 to 17 Year Olds | 328 (99.4%) | 2 (0.6%) |
| 18 to 19 Year Olds | 109 (92.4%) | 9 (7.6%) |
| 20 to 24 Year Olds | 57 (100.0%) | 0 (0.0%) |
| 25 to 34 Year Olds | 31 (93.9%) | 2 (6.1%) |
| 35 Years and over | 36 (87.8%) | 5 (12.2%) |
| Total | 1,459 (89.6%) | 169 (10.4%) |
Educational Attainment by Field of Study in Pierce County
Education (287 | 24.1%), business (210 | 17.6%), science & technology (204 | 17.1%), bio, nature & agricultural (138 | 11.6%), and arts & humanities (89 | 7.5%) are the most common fields of study among 1,193 individuals in Pierce County who have obtained a bachelor's degree or higher.
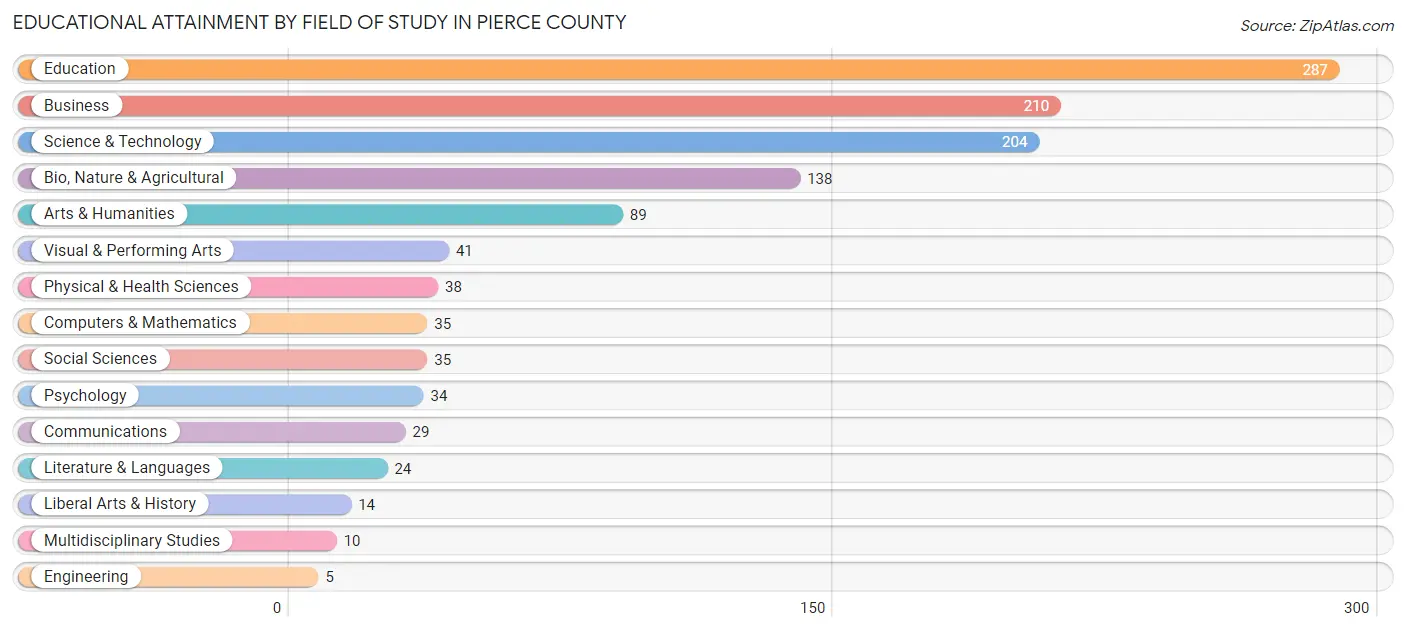
| Field of Study | # Graduates | % Graduates |
| Computers & Mathematics | 35 | 2.9% |
| Bio, Nature & Agricultural | 138 | 11.6% |
| Physical & Health Sciences | 38 | 3.2% |
| Psychology | 34 | 2.9% |
| Social Sciences | 35 | 2.9% |
| Engineering | 5 | 0.4% |
| Multidisciplinary Studies | 10 | 0.8% |
| Science & Technology | 204 | 17.1% |
| Business | 210 | 17.6% |
| Education | 287 | 24.1% |
| Literature & Languages | 24 | 2.0% |
| Liberal Arts & History | 14 | 1.2% |
| Visual & Performing Arts | 41 | 3.4% |
| Communications | 29 | 2.4% |
| Arts & Humanities | 89 | 7.5% |
| Total | 1,193 | 100.0% |
Transportation & Commute in Pierce County
Vehicle Availability by Sex in Pierce County
The most prevalent vehicle ownership categories in Pierce County are males with 2 vehicles (721, accounting for 35.5%) and females with 2 vehicles (599, making up 43.5%).
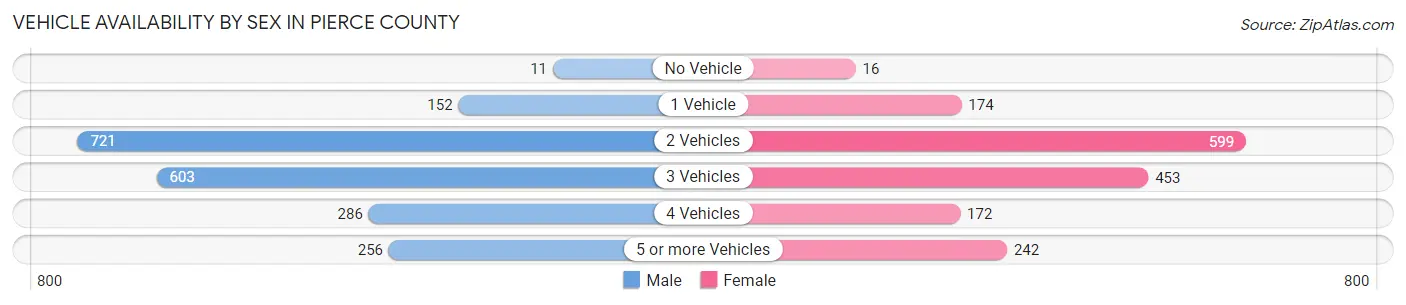
| Vehicles Available | Male | Female |
| No Vehicle | 11 (0.5%) | 16 (1.0%) |
| 1 Vehicle | 152 (7.5%) | 174 (10.5%) |
| 2 Vehicles | 721 (35.5%) | 599 (36.2%) |
| 3 Vehicles | 603 (29.7%) | 453 (27.4%) |
| 4 Vehicles | 286 (14.1%) | 172 (10.4%) |
| 5 or more Vehicles | 256 (12.6%) | 242 (14.6%) |
| Total | 2,029 (100.0%) | 1,656 (100.0%) |
Commute Time in Pierce County
The most frequently occuring commute durations in Pierce County are less than 5 minutes (532 commuters, 16.0%), 30 to 34 minutes (468 commuters, 14.1%), and 20 to 24 minutes (432 commuters, 13.0%).
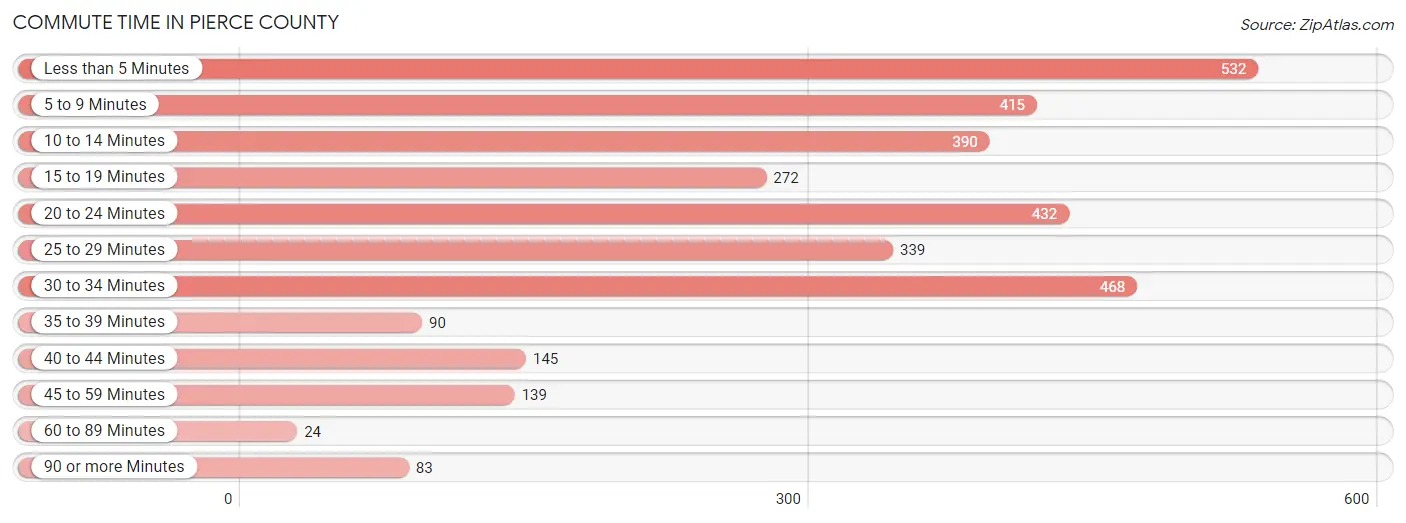
| Commute Time | # Commuters | % Commuters |
| Less than 5 Minutes | 532 | 16.0% |
| 5 to 9 Minutes | 415 | 12.5% |
| 10 to 14 Minutes | 390 | 11.7% |
| 15 to 19 Minutes | 272 | 8.2% |
| 20 to 24 Minutes | 432 | 13.0% |
| 25 to 29 Minutes | 339 | 10.2% |
| 30 to 34 Minutes | 468 | 14.1% |
| 35 to 39 Minutes | 90 | 2.7% |
| 40 to 44 Minutes | 145 | 4.4% |
| 45 to 59 Minutes | 139 | 4.2% |
| 60 to 89 Minutes | 24 | 0.7% |
| 90 or more Minutes | 83 | 2.5% |
Commute Time by Sex in Pierce County
The most common commute times in Pierce County are less than 5 minutes (377 commuters, 20.1%) for males and 25 to 29 minutes (219 commuters, 15.1%) for females.
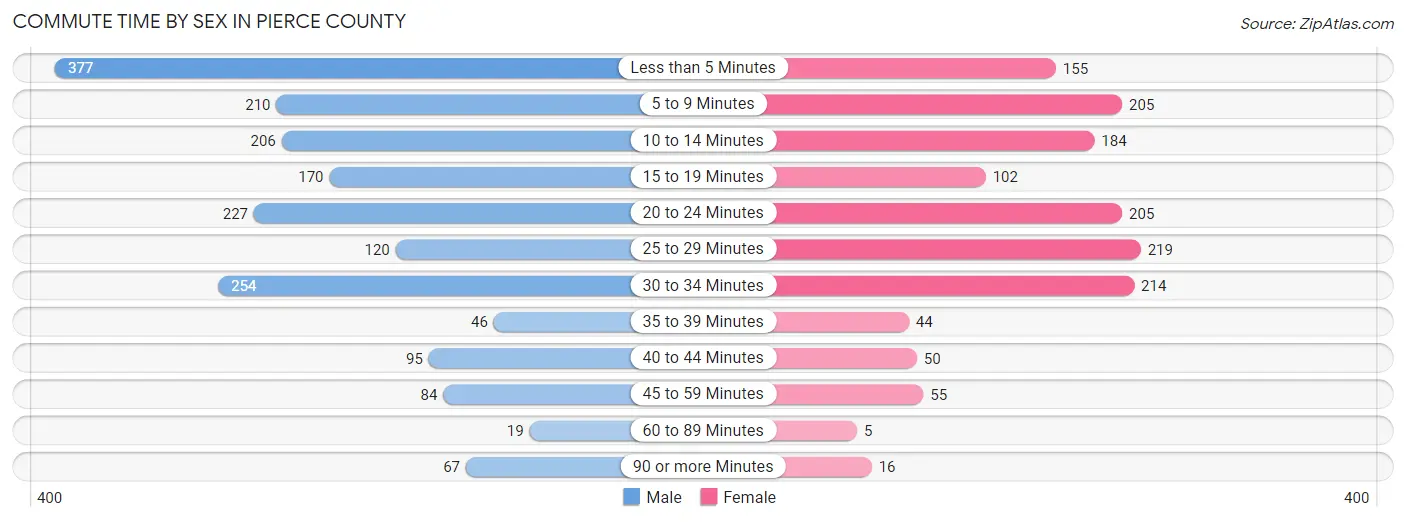
| Commute Time | Male | Female |
| Less than 5 Minutes | 377 (20.1%) | 155 (10.7%) |
| 5 to 9 Minutes | 210 (11.2%) | 205 (14.1%) |
| 10 to 14 Minutes | 206 (11.0%) | 184 (12.7%) |
| 15 to 19 Minutes | 170 (9.1%) | 102 (7.0%) |
| 20 to 24 Minutes | 227 (12.1%) | 205 (14.1%) |
| 25 to 29 Minutes | 120 (6.4%) | 219 (15.1%) |
| 30 to 34 Minutes | 254 (13.6%) | 214 (14.7%) |
| 35 to 39 Minutes | 46 (2.5%) | 44 (3.0%) |
| 40 to 44 Minutes | 95 (5.1%) | 50 (3.4%) |
| 45 to 59 Minutes | 84 (4.5%) | 55 (3.8%) |
| 60 to 89 Minutes | 19 (1.0%) | 5 (0.3%) |
| 90 or more Minutes | 67 (3.6%) | 16 (1.1%) |
Time of Departure to Work by Sex in Pierce County
The most frequent times of departure to work in Pierce County are 7:00 AM to 7:29 AM (307, 16.4%) for males and 7:30 AM to 7:59 AM (349, 24.0%) for females.
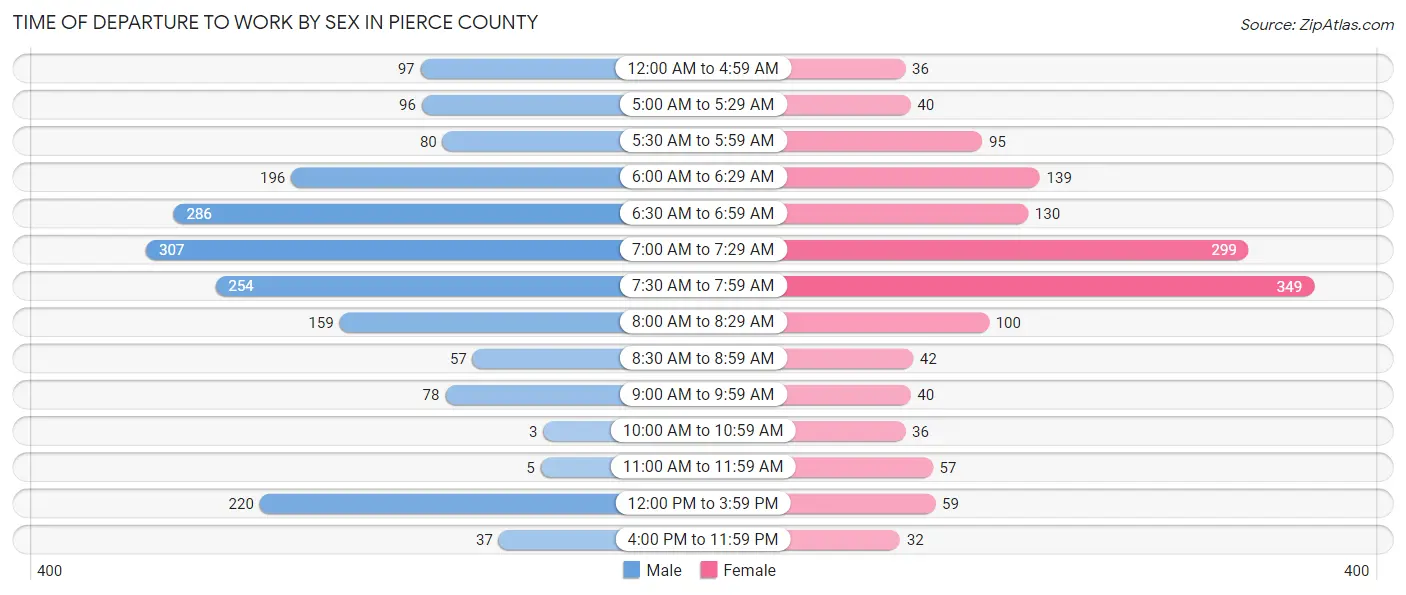
| Time of Departure | Male | Female |
| 12:00 AM to 4:59 AM | 97 (5.2%) | 36 (2.5%) |
| 5:00 AM to 5:29 AM | 96 (5.1%) | 40 (2.8%) |
| 5:30 AM to 5:59 AM | 80 (4.3%) | 95 (6.5%) |
| 6:00 AM to 6:29 AM | 196 (10.4%) | 139 (9.6%) |
| 6:30 AM to 6:59 AM | 286 (15.2%) | 130 (8.9%) |
| 7:00 AM to 7:29 AM | 307 (16.4%) | 299 (20.6%) |
| 7:30 AM to 7:59 AM | 254 (13.6%) | 349 (24.0%) |
| 8:00 AM to 8:29 AM | 159 (8.5%) | 100 (6.9%) |
| 8:30 AM to 8:59 AM | 57 (3.0%) | 42 (2.9%) |
| 9:00 AM to 9:59 AM | 78 (4.2%) | 40 (2.8%) |
| 10:00 AM to 10:59 AM | 3 (0.2%) | 36 (2.5%) |
| 11:00 AM to 11:59 AM | 5 (0.3%) | 57 (3.9%) |
| 12:00 PM to 3:59 PM | 220 (11.7%) | 59 (4.1%) |
| 4:00 PM to 11:59 PM | 37 (2.0%) | 32 (2.2%) |
| Total | 1,875 (100.0%) | 1,454 (100.0%) |
Housing Occupancy in Pierce County
Occupancy by Ownership in Pierce County
Of the total 2,876 dwellings in Pierce County, owner-occupied units account for 2,245 (78.1%), while renter-occupied units make up 631 (21.9%).
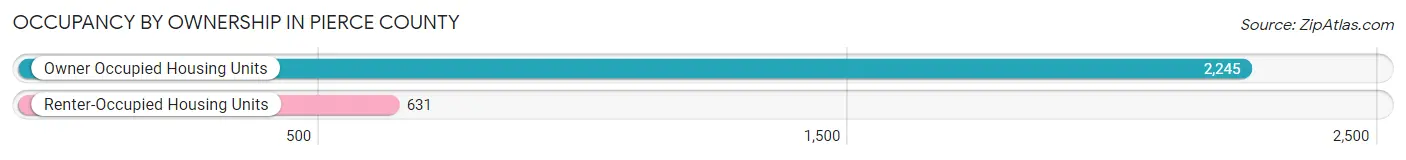
| Occupancy | # Housing Units | % Housing Units |
| Owner Occupied Housing Units | 2,245 | 78.1% |
| Renter-Occupied Housing Units | 631 | 21.9% |
| Total Occupied Housing Units | 2,876 | 100.0% |
Occupancy by Household Size in Pierce County
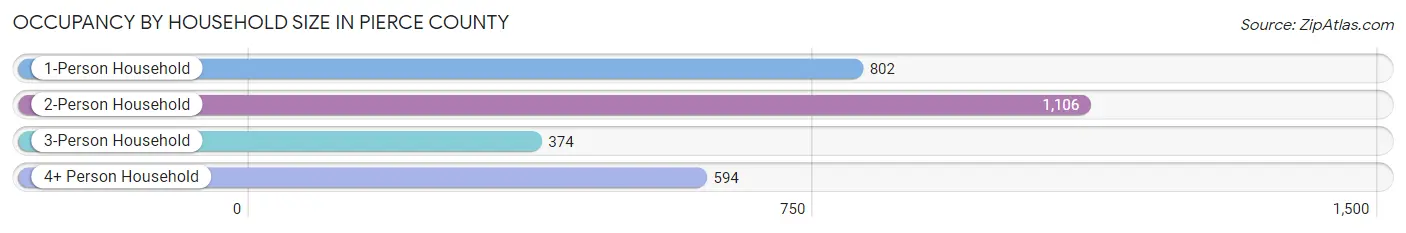
| Household Size | # Housing Units | % Housing Units |
| 1-Person Household | 802 | 27.9% |
| 2-Person Household | 1,106 | 38.5% |
| 3-Person Household | 374 | 13.0% |
| 4+ Person Household | 594 | 20.6% |
| Total Housing Units | 2,876 | 100.0% |
Occupancy by Ownership by Household Size in Pierce County
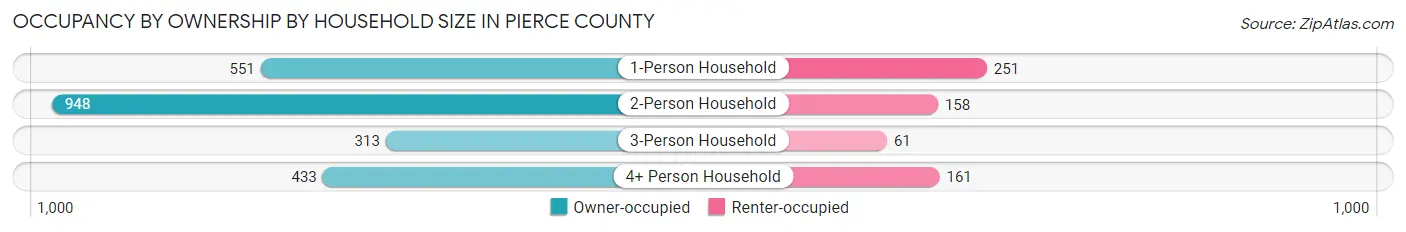
| Household Size | Owner-occupied | Renter-occupied |
| 1-Person Household | 551 (68.7%) | 251 (31.3%) |
| 2-Person Household | 948 (85.7%) | 158 (14.3%) |
| 3-Person Household | 313 (83.7%) | 61 (16.3%) |
| 4+ Person Household | 433 (72.9%) | 161 (27.1%) |
| Total Housing Units | 2,245 (78.1%) | 631 (21.9%) |
Occupancy by Educational Attainment in Pierce County
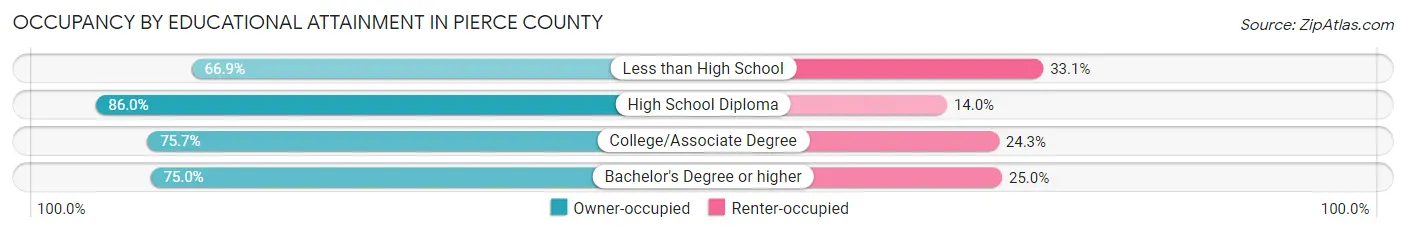
| Household Size | Owner-occupied | Renter-occupied |
| Less than High School | 107 (66.9%) | 53 (33.1%) |
| High School Diploma | 723 (86.0%) | 118 (14.0%) |
| College/Associate Degree | 943 (75.7%) | 303 (24.3%) |
| Bachelor's Degree or higher | 472 (75.0%) | 157 (25.0%) |
Occupancy by Age of Householder in Pierce County
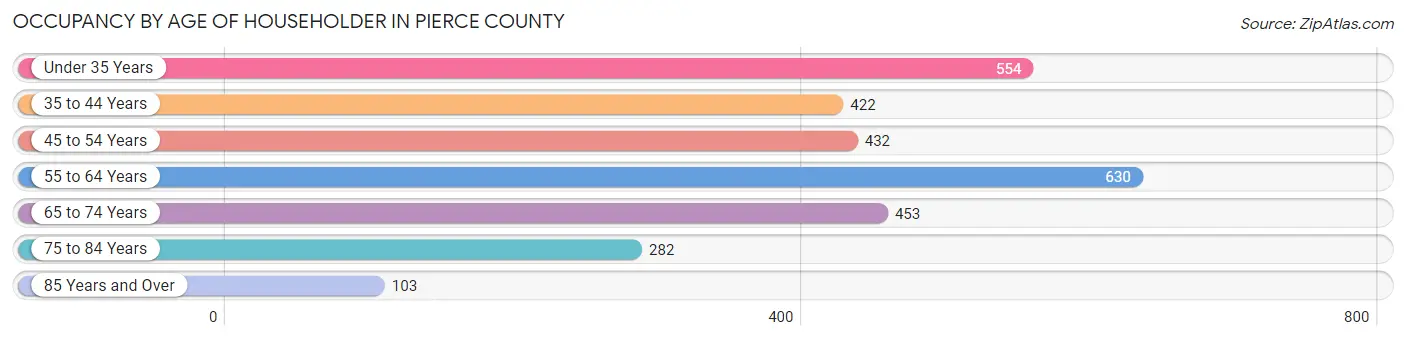
| Age Bracket | # Households | % Households |
| Under 35 Years | 554 | 19.3% |
| 35 to 44 Years | 422 | 14.7% |
| 45 to 54 Years | 432 | 15.0% |
| 55 to 64 Years | 630 | 21.9% |
| 65 to 74 Years | 453 | 15.8% |
| 75 to 84 Years | 282 | 9.8% |
| 85 Years and Over | 103 | 3.6% |
| Total | 2,876 | 100.0% |
Housing Finances in Pierce County
Median Income by Occupancy in Pierce County
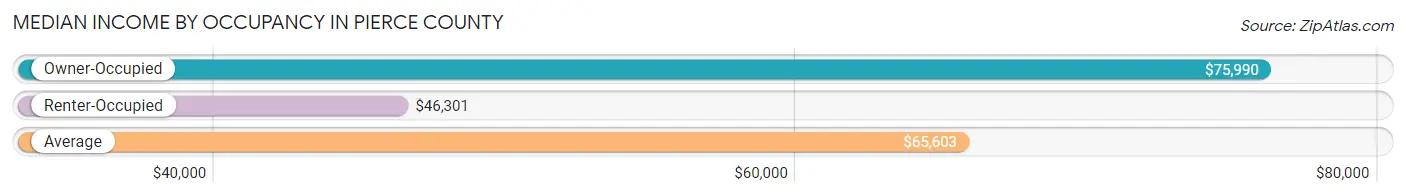
| Occupancy Type | # Households | Median Income |
| Owner-Occupied | 2,245 (78.1%) | $75,990 |
| Renter-Occupied | 631 (21.9%) | $46,301 |
| Average | 2,876 (100.0%) | $65,603 |
Occupancy by Householder Income Bracket in Pierce County
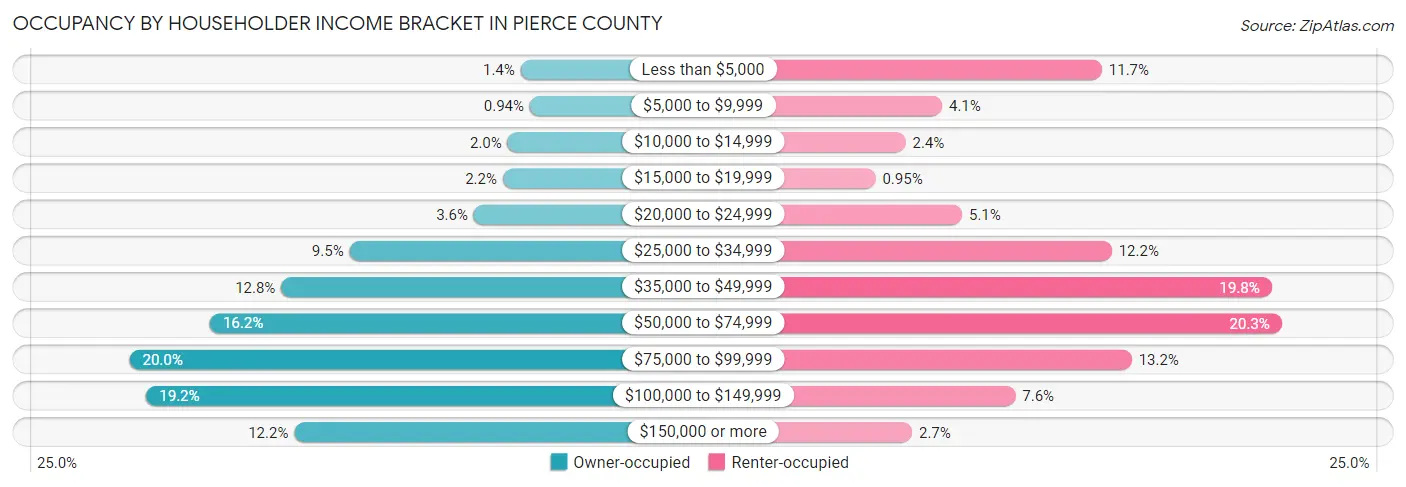
| Income Bracket | Owner-occupied | Renter-occupied |
| Less than $5,000 | 31 (1.4%) | 74 (11.7%) |
| $5,000 to $9,999 | 21 (0.9%) | 26 (4.1%) |
| $10,000 to $14,999 | 45 (2.0%) | 15 (2.4%) |
| $15,000 to $19,999 | 50 (2.2%) | 6 (0.9%) |
| $20,000 to $24,999 | 81 (3.6%) | 32 (5.1%) |
| $25,000 to $34,999 | 214 (9.5%) | 77 (12.2%) |
| $35,000 to $49,999 | 287 (12.8%) | 125 (19.8%) |
| $50,000 to $74,999 | 363 (16.2%) | 128 (20.3%) |
| $75,000 to $99,999 | 449 (20.0%) | 83 (13.2%) |
| $100,000 to $149,999 | 431 (19.2%) | 48 (7.6%) |
| $150,000 or more | 273 (12.2%) | 17 (2.7%) |
| Total | 2,245 (100.0%) | 631 (100.0%) |
Monthly Housing Cost Tiers in Pierce County
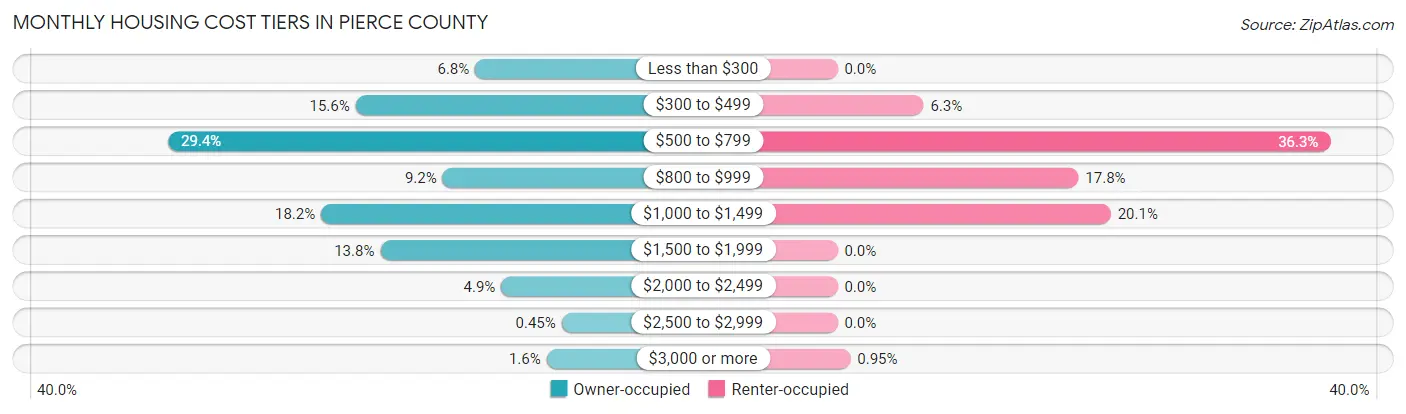
| Monthly Cost | Owner-occupied | Renter-occupied |
| Less than $300 | 153 (6.8%) | 0 (0.0%) |
| $300 to $499 | 351 (15.6%) | 40 (6.3%) |
| $500 to $799 | 661 (29.4%) | 229 (36.3%) |
| $800 to $999 | 207 (9.2%) | 112 (17.7%) |
| $1,000 to $1,499 | 408 (18.2%) | 127 (20.1%) |
| $1,500 to $1,999 | 310 (13.8%) | 0 (0.0%) |
| $2,000 to $2,499 | 110 (4.9%) | 0 (0.0%) |
| $2,500 to $2,999 | 10 (0.4%) | 0 (0.0%) |
| $3,000 or more | 35 (1.6%) | 6 (0.9%) |
| Total | 2,245 (100.0%) | 631 (100.0%) |
Physical Housing Characteristics in Pierce County
Housing Structures in Pierce County
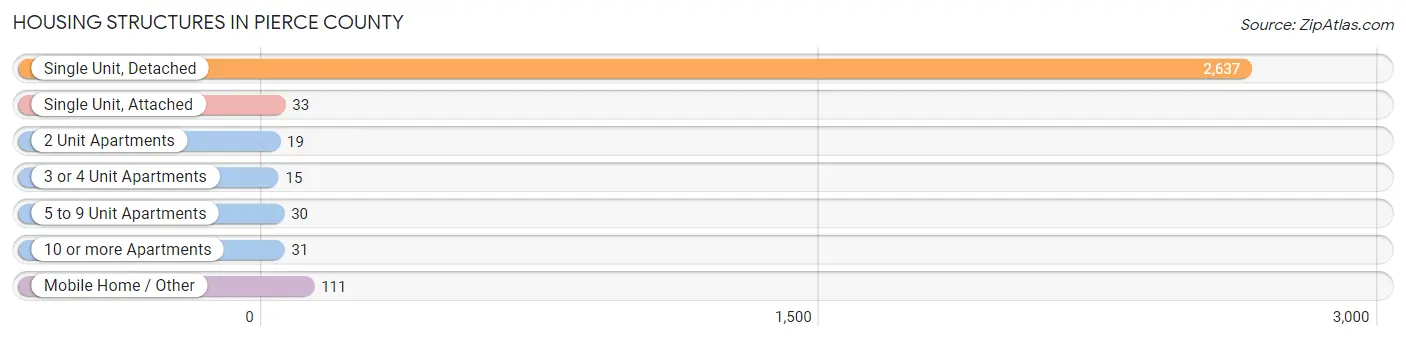
| Structure Type | # Housing Units | % Housing Units |
| Single Unit, Detached | 2,637 | 91.7% |
| Single Unit, Attached | 33 | 1.1% |
| 2 Unit Apartments | 19 | 0.7% |
| 3 or 4 Unit Apartments | 15 | 0.5% |
| 5 to 9 Unit Apartments | 30 | 1.0% |
| 10 or more Apartments | 31 | 1.1% |
| Mobile Home / Other | 111 | 3.9% |
| Total | 2,876 | 100.0% |
Housing Structures by Occupancy in Pierce County
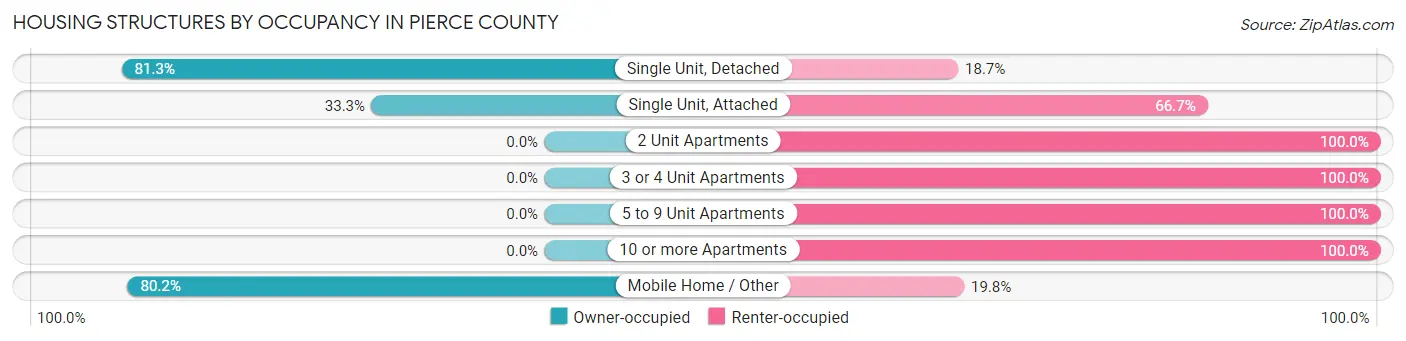
| Structure Type | Owner-occupied | Renter-occupied |
| Single Unit, Detached | 2,145 (81.3%) | 492 (18.7%) |
| Single Unit, Attached | 11 (33.3%) | 22 (66.7%) |
| 2 Unit Apartments | 0 (0.0%) | 19 (100.0%) |
| 3 or 4 Unit Apartments | 0 (0.0%) | 15 (100.0%) |
| 5 to 9 Unit Apartments | 0 (0.0%) | 30 (100.0%) |
| 10 or more Apartments | 0 (0.0%) | 31 (100.0%) |
| Mobile Home / Other | 89 (80.2%) | 22 (19.8%) |
| Total | 2,245 (78.1%) | 631 (21.9%) |
Housing Structures by Number of Rooms in Pierce County
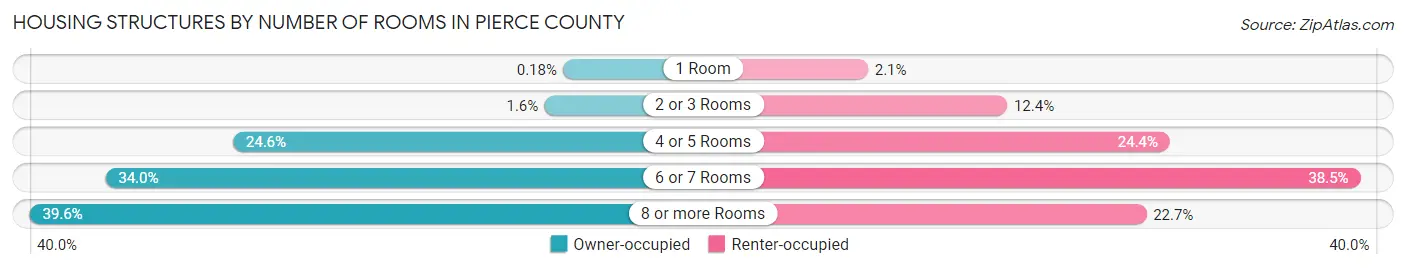
| Number of Rooms | Owner-occupied | Renter-occupied |
| 1 Room | 4 (0.2%) | 13 (2.1%) |
| 2 or 3 Rooms | 35 (1.6%) | 78 (12.4%) |
| 4 or 5 Rooms | 552 (24.6%) | 154 (24.4%) |
| 6 or 7 Rooms | 764 (34.0%) | 243 (38.5%) |
| 8 or more Rooms | 890 (39.6%) | 143 (22.7%) |
| Total | 2,245 (100.0%) | 631 (100.0%) |
Housing Structure by Heating Type in Pierce County
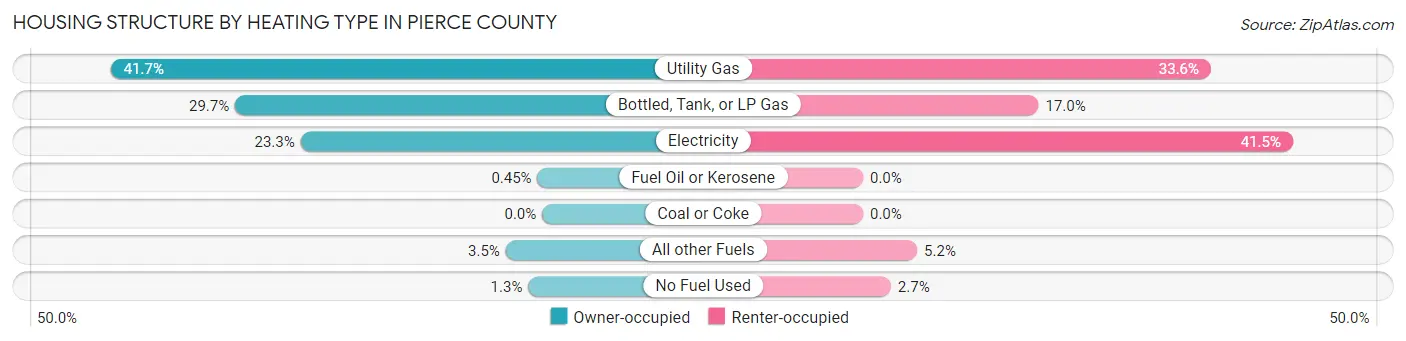
| Heating Type | Owner-occupied | Renter-occupied |
| Utility Gas | 936 (41.7%) | 212 (33.6%) |
| Bottled, Tank, or LP Gas | 666 (29.7%) | 107 (17.0%) |
| Electricity | 524 (23.3%) | 262 (41.5%) |
| Fuel Oil or Kerosene | 10 (0.4%) | 0 (0.0%) |
| Coal or Coke | 0 (0.0%) | 0 (0.0%) |
| All other Fuels | 79 (3.5%) | 33 (5.2%) |
| No Fuel Used | 30 (1.3%) | 17 (2.7%) |
| Total | 2,245 (100.0%) | 631 (100.0%) |
Household Vehicle Usage in Pierce County
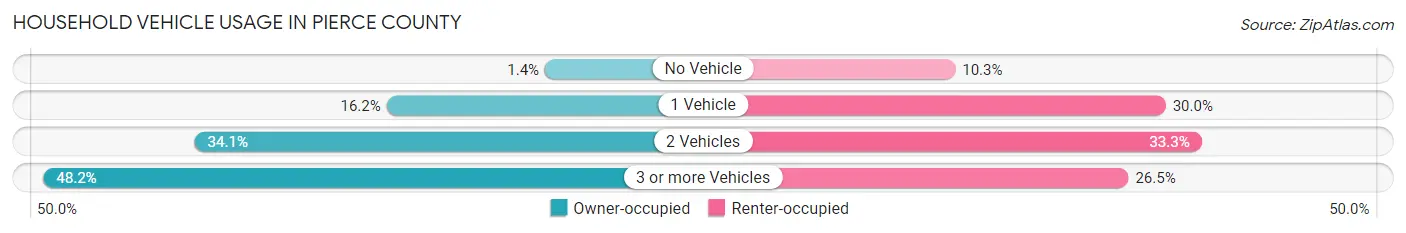
| Vehicles per Household | Owner-occupied | Renter-occupied |
| No Vehicle | 32 (1.4%) | 65 (10.3%) |
| 1 Vehicle | 364 (16.2%) | 189 (29.9%) |
| 2 Vehicles | 766 (34.1%) | 210 (33.3%) |
| 3 or more Vehicles | 1,083 (48.2%) | 167 (26.5%) |
| Total | 2,245 (100.0%) | 631 (100.0%) |
Real Estate & Mortgages in Pierce County
Real Estate and Mortgage Overview in Pierce County
| Characteristic | Without Mortgage | With Mortgage |
| Housing Units | 1,213 | 1,032 |
| Median Property Value | $137,500 | $198,600 |
| Median Household Income | $62,454 | $177 |
| Monthly Housing Costs | $543 | $32 |
| Real Estate Taxes | $1,796 | $15 |
Property Value by Mortgage Status in Pierce County
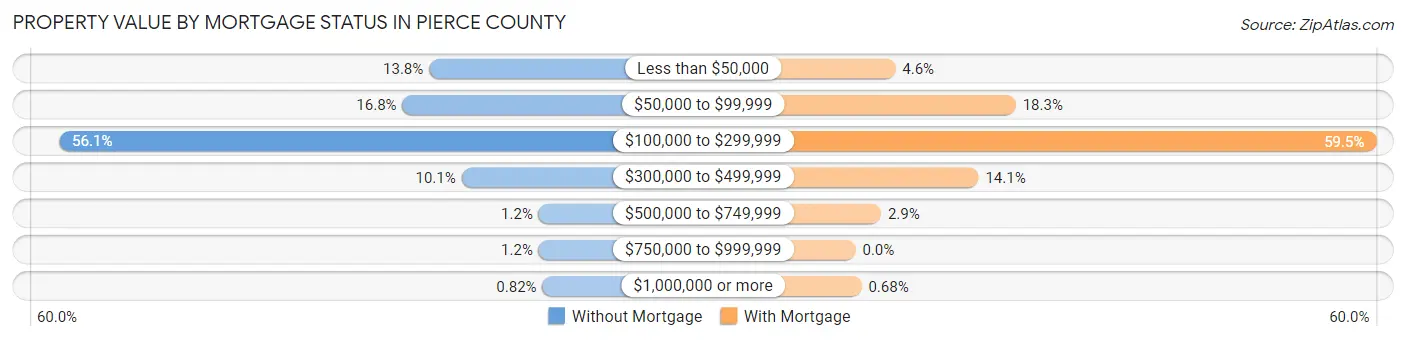
| Property Value | Without Mortgage | With Mortgage |
| Less than $50,000 | 167 (13.8%) | 47 (4.5%) |
| $50,000 to $99,999 | 204 (16.8%) | 189 (18.3%) |
| $100,000 to $299,999 | 680 (56.1%) | 614 (59.5%) |
| $300,000 to $499,999 | 122 (10.1%) | 145 (14.1%) |
| $500,000 to $749,999 | 15 (1.2%) | 30 (2.9%) |
| $750,000 to $999,999 | 15 (1.2%) | 0 (0.0%) |
| $1,000,000 or more | 10 (0.8%) | 7 (0.7%) |
| Total | 1,213 (100.0%) | 1,032 (100.0%) |
Household Income by Mortgage Status in Pierce County
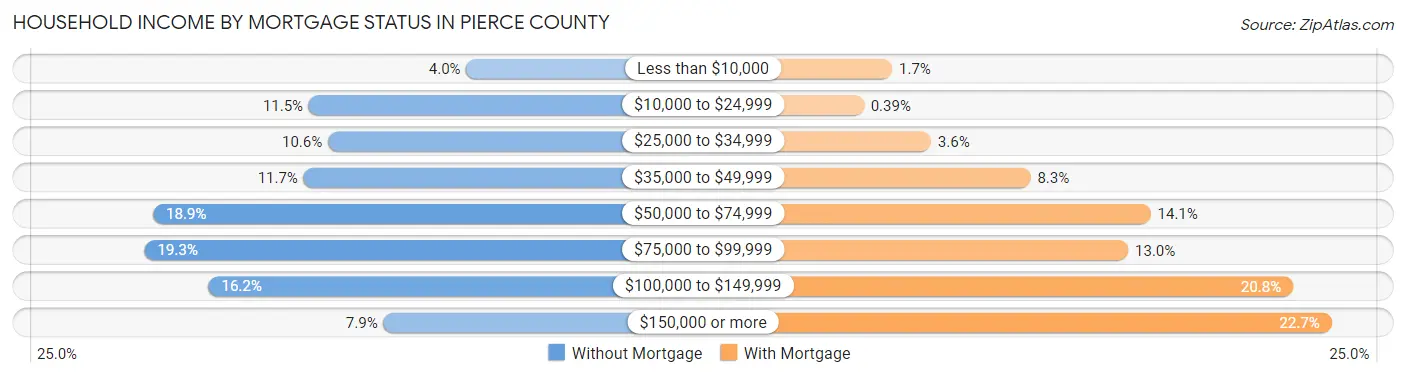
| Household Income | Without Mortgage | With Mortgage |
| Less than $10,000 | 48 (4.0%) | 18 (1.7%) |
| $10,000 to $24,999 | 139 (11.5%) | 4 (0.4%) |
| $25,000 to $34,999 | 128 (10.5%) | 37 (3.6%) |
| $35,000 to $49,999 | 142 (11.7%) | 86 (8.3%) |
| $50,000 to $74,999 | 229 (18.9%) | 145 (14.1%) |
| $75,000 to $99,999 | 234 (19.3%) | 134 (13.0%) |
| $100,000 to $149,999 | 197 (16.2%) | 215 (20.8%) |
| $150,000 or more | 96 (7.9%) | 234 (22.7%) |
| Total | 1,213 (100.0%) | 1,032 (100.0%) |
Property Value to Household Income Ratio in Pierce County
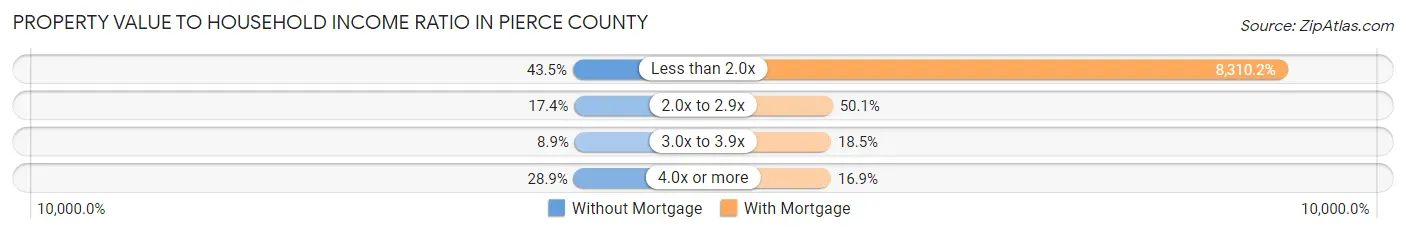
| Value-to-Income Ratio | Without Mortgage | With Mortgage |
| Less than 2.0x | 528 (43.5%) | 85,761 (8,310.2%) |
| 2.0x to 2.9x | 211 (17.4%) | 517 (50.1%) |
| 3.0x to 3.9x | 108 (8.9%) | 191 (18.5%) |
| 4.0x or more | 350 (28.8%) | 174 (16.9%) |
| Total | 1,213 (100.0%) | 1,032 (100.0%) |
Real Estate Taxes by Mortgage Status in Pierce County
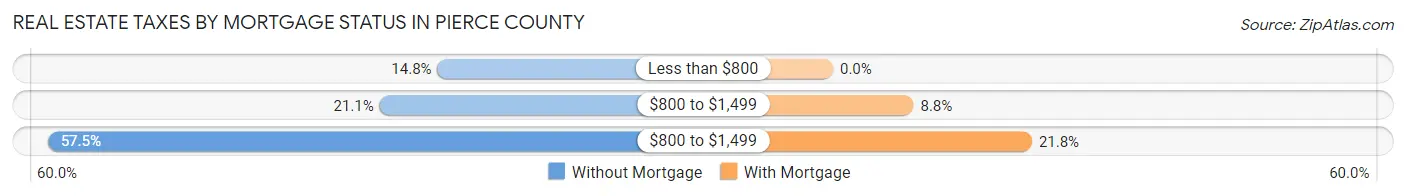
| Property Taxes | Without Mortgage | With Mortgage |
| Less than $800 | 179 (14.8%) | 0 (0.0%) |
| $800 to $1,499 | 256 (21.1%) | 91 (8.8%) |
| $800 to $1,499 | 697 (57.5%) | 225 (21.8%) |
| Total | 1,213 (100.0%) | 1,032 (100.0%) |
Health & Disability in Pierce County
Health Insurance Coverage by Age in Pierce County
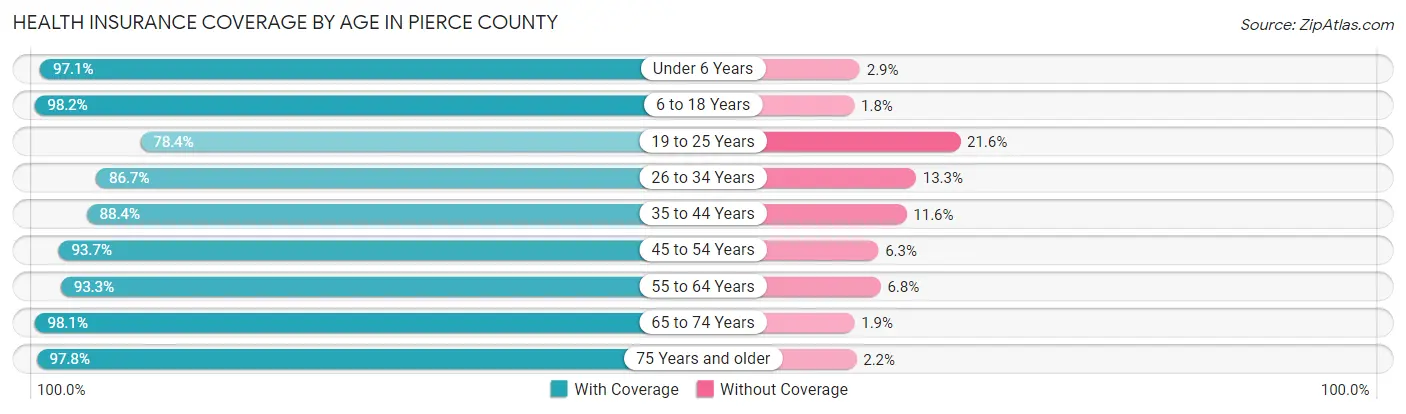
| Age Bracket | With Coverage | Without Coverage |
| Under 6 Years | 572 (97.1%) | 17 (2.9%) |
| 6 to 18 Years | 1,339 (98.2%) | 25 (1.8%) |
| 19 to 25 Years | 385 (78.4%) | 106 (21.6%) |
| 26 to 34 Years | 565 (86.7%) | 87 (13.3%) |
| 35 to 44 Years | 787 (88.4%) | 103 (11.6%) |
| 45 to 54 Years | 740 (93.7%) | 50 (6.3%) |
| 55 to 64 Years | 1,008 (93.2%) | 73 (6.8%) |
| 65 to 74 Years | 739 (98.1%) | 14 (1.9%) |
| 75 Years and older | 569 (97.8%) | 13 (2.2%) |
| Total | 6,704 (93.2%) | 488 (6.8%) |
Health Insurance Coverage by Citizenship Status in Pierce County
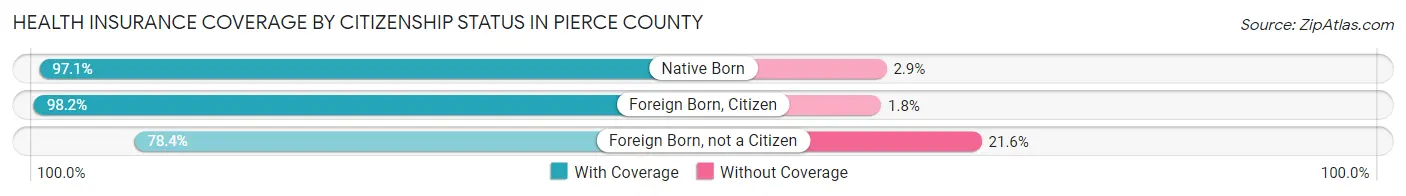
| Citizenship Status | With Coverage | Without Coverage |
| Native Born | 572 (97.1%) | 17 (2.9%) |
| Foreign Born, Citizen | 1,339 (98.2%) | 25 (1.8%) |
| Foreign Born, not a Citizen | 385 (78.4%) | 106 (21.6%) |
Health Insurance Coverage by Household Income in Pierce County
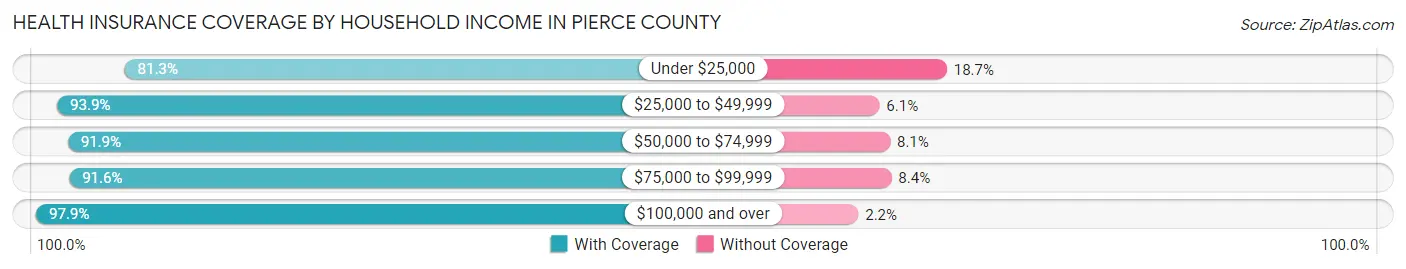
| Household Income | With Coverage | Without Coverage |
| Under $25,000 | 568 (81.3%) | 131 (18.7%) |
| $25,000 to $49,999 | 1,229 (93.9%) | 80 (6.1%) |
| $50,000 to $74,999 | 1,078 (91.9%) | 95 (8.1%) |
| $75,000 to $99,999 | 1,414 (91.6%) | 129 (8.4%) |
| $100,000 and over | 2,415 (97.9%) | 53 (2.1%) |
Public vs Private Health Insurance Coverage by Age in Pierce County
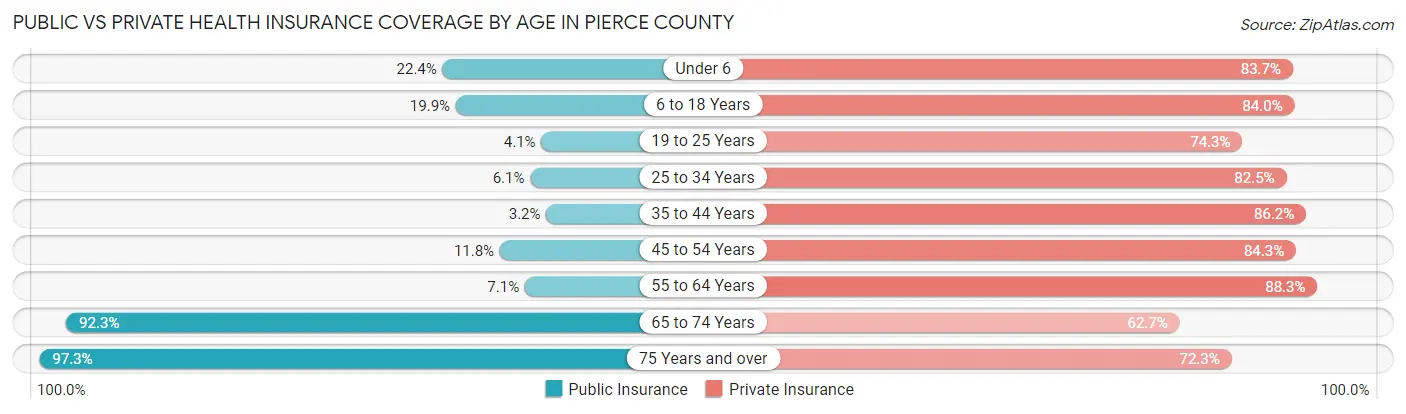
| Age Bracket | Public Insurance | Private Insurance |
| Under 6 | 132 (22.4%) | 493 (83.7%) |
| 6 to 18 Years | 272 (19.9%) | 1,146 (84.0%) |
| 19 to 25 Years | 20 (4.1%) | 365 (74.3%) |
| 25 to 34 Years | 40 (6.1%) | 538 (82.5%) |
| 35 to 44 Years | 28 (3.2%) | 767 (86.2%) |
| 45 to 54 Years | 93 (11.8%) | 666 (84.3%) |
| 55 to 64 Years | 77 (7.1%) | 954 (88.2%) |
| 65 to 74 Years | 695 (92.3%) | 472 (62.7%) |
| 75 Years and over | 566 (97.3%) | 421 (72.3%) |
| Total | 1,923 (26.7%) | 5,822 (80.9%) |
Disability Status by Sex by Age in Pierce County
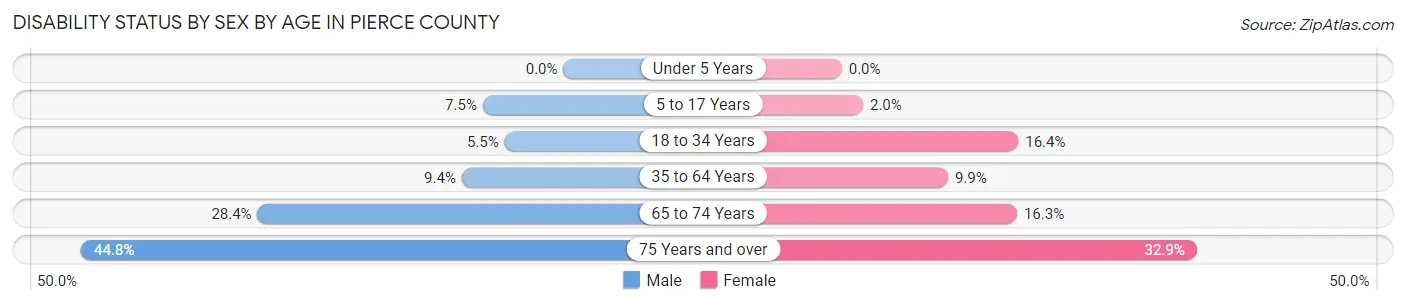
| Age Bracket | Male | Female |
| Under 5 Years | 0 (0.0%) | 0 (0.0%) |
| 5 to 17 Years | 49 (7.5%) | 13 (2.0%) |
| 18 to 34 Years | 37 (5.4%) | 94 (16.4%) |
| 35 to 64 Years | 135 (9.4%) | 131 (9.9%) |
| 65 to 74 Years | 109 (28.4%) | 60 (16.3%) |
| 75 Years and over | 111 (44.8%) | 110 (32.9%) |
Disability Class by Sex by Age in Pierce County
Disability Class: Hearing Difficulty
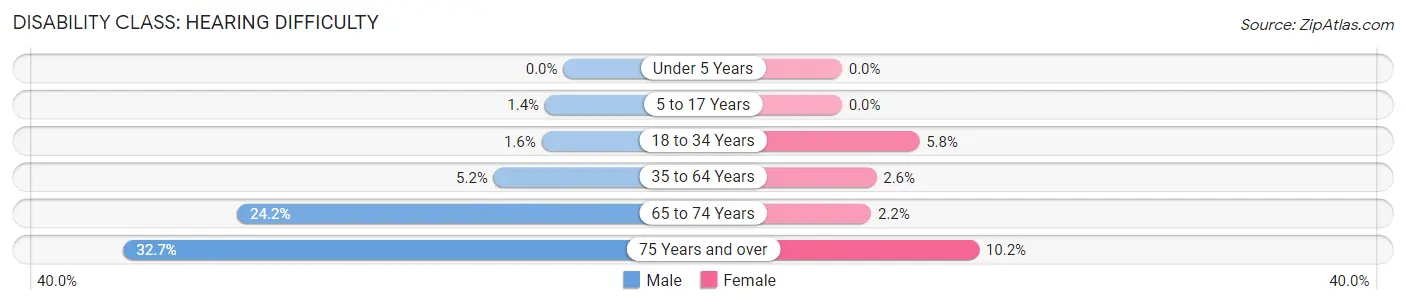
| Age Bracket | Male | Female |
| Under 5 Years | 0 (0.0%) | 0 (0.0%) |
| 5 to 17 Years | 9 (1.4%) | 0 (0.0%) |
| 18 to 34 Years | 11 (1.6%) | 33 (5.8%) |
| 35 to 64 Years | 74 (5.2%) | 34 (2.6%) |
| 65 to 74 Years | 93 (24.2%) | 8 (2.2%) |
| 75 Years and over | 81 (32.7%) | 34 (10.2%) |
Disability Class: Vision Difficulty
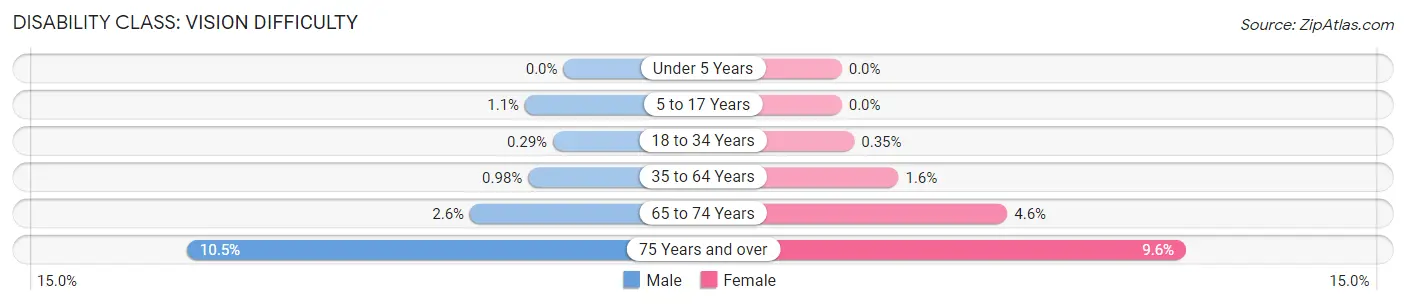
| Age Bracket | Male | Female |
| Under 5 Years | 0 (0.0%) | 0 (0.0%) |
| 5 to 17 Years | 7 (1.1%) | 0 (0.0%) |
| 18 to 34 Years | 2 (0.3%) | 2 (0.4%) |
| 35 to 64 Years | 14 (1.0%) | 21 (1.6%) |
| 65 to 74 Years | 10 (2.6%) | 17 (4.6%) |
| 75 Years and over | 26 (10.5%) | 32 (9.6%) |
Disability Class: Cognitive Difficulty
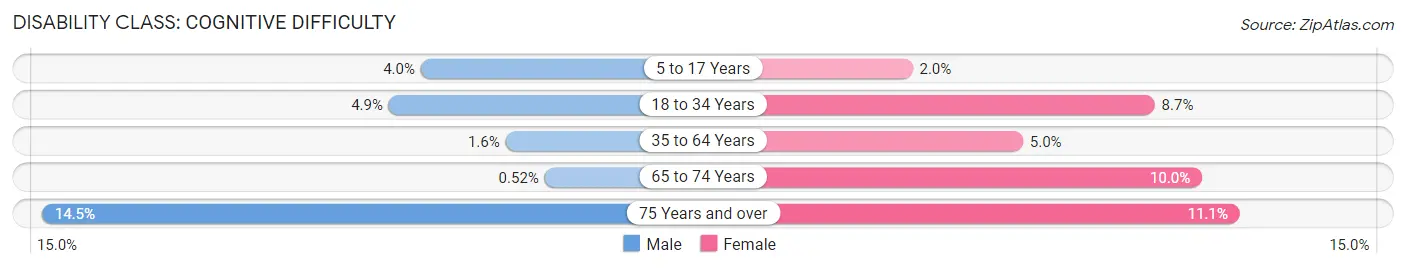
| Age Bracket | Male | Female |
| 5 to 17 Years | 26 (4.0%) | 13 (2.0%) |
| 18 to 34 Years | 33 (4.9%) | 50 (8.7%) |
| 35 to 64 Years | 23 (1.6%) | 67 (5.0%) |
| 65 to 74 Years | 2 (0.5%) | 37 (10.0%) |
| 75 Years and over | 36 (14.5%) | 37 (11.1%) |
Disability Class: Ambulatory Difficulty
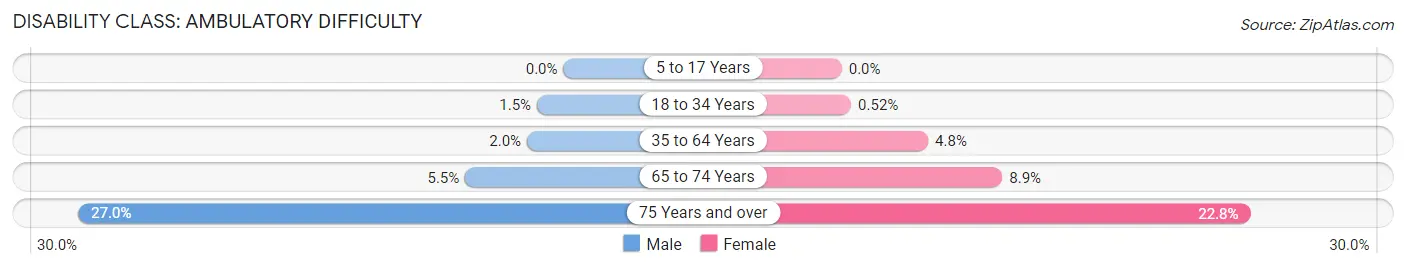
| Age Bracket | Male | Female |
| 5 to 17 Years | 0 (0.0%) | 0 (0.0%) |
| 18 to 34 Years | 10 (1.5%) | 3 (0.5%) |
| 35 to 64 Years | 29 (2.0%) | 64 (4.8%) |
| 65 to 74 Years | 21 (5.5%) | 33 (8.9%) |
| 75 Years and over | 67 (27.0%) | 76 (22.8%) |
Disability Class: Self-Care Difficulty
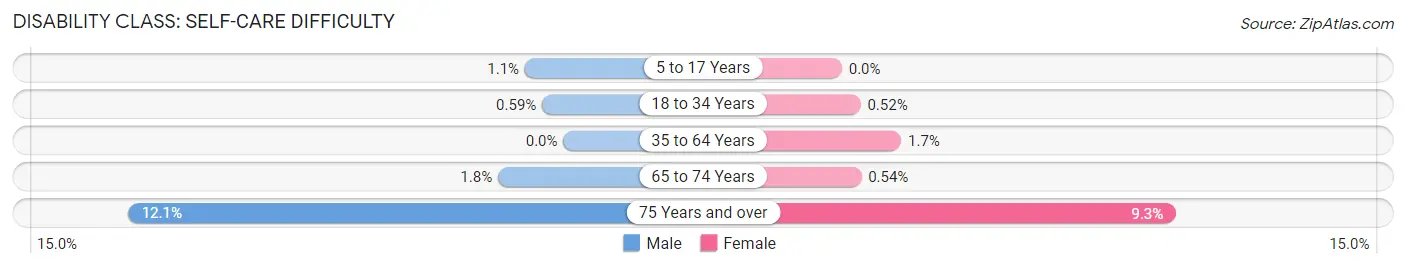
| Age Bracket | Male | Female |
| 5 to 17 Years | 7 (1.1%) | 0 (0.0%) |
| 18 to 34 Years | 4 (0.6%) | 3 (0.5%) |
| 35 to 64 Years | 0 (0.0%) | 22 (1.7%) |
| 65 to 74 Years | 7 (1.8%) | 2 (0.5%) |
| 75 Years and over | 30 (12.1%) | 31 (9.3%) |
Technology Access in Pierce County
Computing Device Access in Pierce County
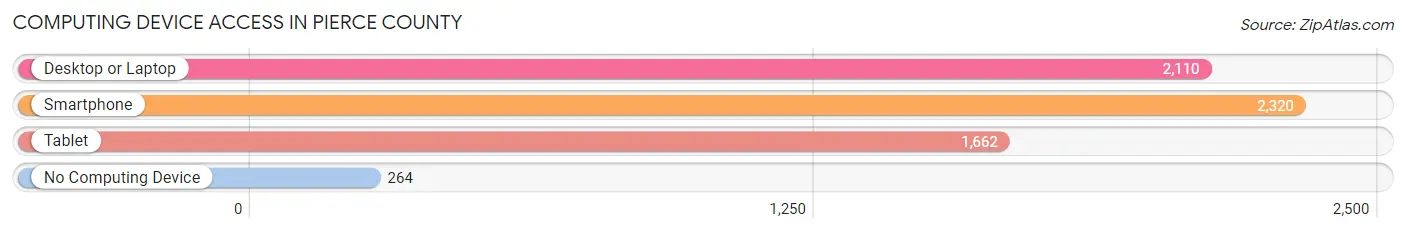
| Device Type | # Households | % Households |
| Desktop or Laptop | 2,110 | 73.4% |
| Smartphone | 2,320 | 80.7% |
| Tablet | 1,662 | 57.8% |
| No Computing Device | 264 | 9.2% |
| Total | 2,876 | 100.0% |
Internet Access in Pierce County
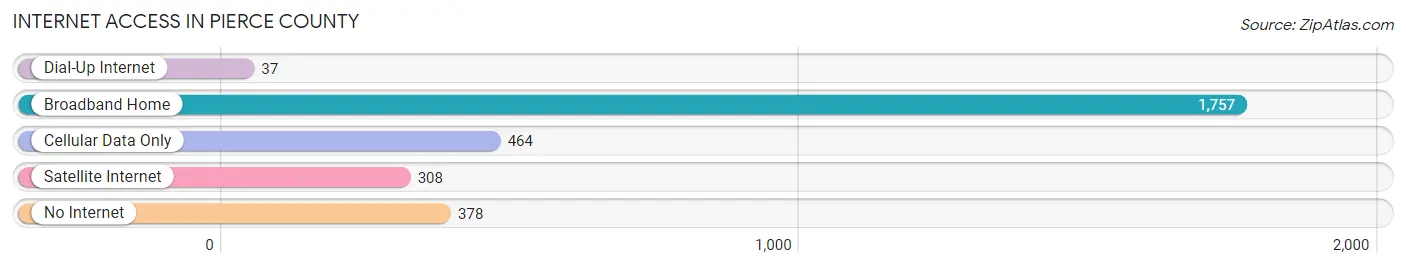
| Internet Type | # Households | % Households |
| Dial-Up Internet | 37 | 1.3% |
| Broadband Home | 1,757 | 61.1% |
| Cellular Data Only | 464 | 16.1% |
| Satellite Internet | 308 | 10.7% |
| No Internet | 378 | 13.1% |
| Total | 2,876 | 100.0% |
Pierce County Summary
Pierce County is located in the northeastern corner of Nebraska, and is bordered by South Dakota to the north, Cedar County to the east, Wayne County to the south, and Antelope County to the west. The county seat is Pierce, and the county has a total area of 576 square miles. As of the 2010 census, the population was 7,737, making it the second least populous county in Nebraska.
Geography
Pierce County is located in the rolling hills of the Loess Hills region of Nebraska. The county is mostly rural, with small towns and villages scattered throughout. The terrain is mostly flat, with some rolling hills and ravines. The county is drained by the Niobrara River, which flows through the county from north to south. The county is also home to several small lakes, including Lake Alice, Lake Henry, and Lake Obert.
Climate
Pierce County has a humid continental climate, with cold winters and hot, humid summers. The average annual temperature is around 50°F, with average highs in the summer reaching into the mid-80s and lows in the winter dipping into the single digits. The average annual precipitation is around 25 inches, with most of it falling in the spring and summer months.
Demographics
As of the 2010 census, there were 7,737 people, 2,945 households, and 2,072 families residing in the county. The population density was 13.5 people per square mile. The racial makeup of the county was 97.2% White, 0.3% African American, 0.3% Native American, 0.2% Asian, 0.1% Pacific Islander, 0.7% from other races, and 1.2% from two or more races. Hispanic or Latino of any race were 2.2% of the population.
The median income for a household in the county was $41,945, and the median income for a family was $50,945. The per capita income for the county was $20,845. About 8.2% of families and 10.2% of the population were below the poverty line, including 13.2% of those under age 18 and 8.2% of those age 65 or over.
Economy
The economy of Pierce County is largely based on agriculture. The county is home to several large farms, as well as smaller family-owned operations. The county is also home to several small businesses, including restaurants, retail stores, and service providers. The county is also home to several manufacturing companies, including a large meat processing plant.
The county is also home to several tourist attractions, including the Niobrara National Scenic River, the Niobrara State Park, and the Fort Niobrara National Wildlife Refuge. These attractions bring in visitors from all over the region, providing a boost to the local economy.
Conclusion
Pierce County is a rural county located in the northeastern corner of Nebraska. The county is home to a diverse population, with a strong agricultural economy. The county is also home to several tourist attractions, providing a boost to the local economy. With its rolling hills, small towns, and scenic attractions, Pierce County is a great place to live and visit.
Common Questions
What is Per Capita Income in Pierce County?
Per Capita income in Pierce County is $33,513.
What is the Median Family Income in Pierce County?
Median Family Income in Pierce County is $78,912.
What is the Median Household income in Pierce County?
Median Household Income in Pierce County is $65,603.
What is Income or Wage Gap in Pierce County?
Income or Wage Gap in Pierce County is 30.8%.
Women in Pierce County earn 69.2 cents for every dollar earned by a man.
What is Inequality or Gini Index in Pierce County?
Inequality or Gini Index in Pierce County is 0.41.
What is the Total Population of Pierce County?
Total Population of Pierce County is 7,301.
What is the Total Male Population of Pierce County?
Total Male Population of Pierce County is 3,691.
What is the Total Female Population of Pierce County?
Total Female Population of Pierce County is 3,610.
What is the Ratio of Males per 100 Females in Pierce County?
There are 102.24 Males per 100 Females in Pierce County.
What is the Ratio of Females per 100 Males in Pierce County?
There are 97.81 Females per 100 Males in Pierce County.
What is the Median Population Age in Pierce County?
Median Population Age in Pierce County is 40.2 Years.
What is the Average Family Size in Pierce County
Average Family Size in Pierce County is 3.1 People.
What is the Average Household Size in Pierce County
Average Household Size in Pierce County is 2.5 People.
How Large is the Labor Force in Pierce County?
There are 3,876 People in the Labor Forcein in Pierce County.
What is the Percentage of People in the Labor Force in Pierce County?
68.0% of People are in the Labor Force in Pierce County.
What is the Unemployment Rate in Pierce County?
Unemployment Rate in Pierce County is 2.4%.