Keith County, NE Map & Demographics
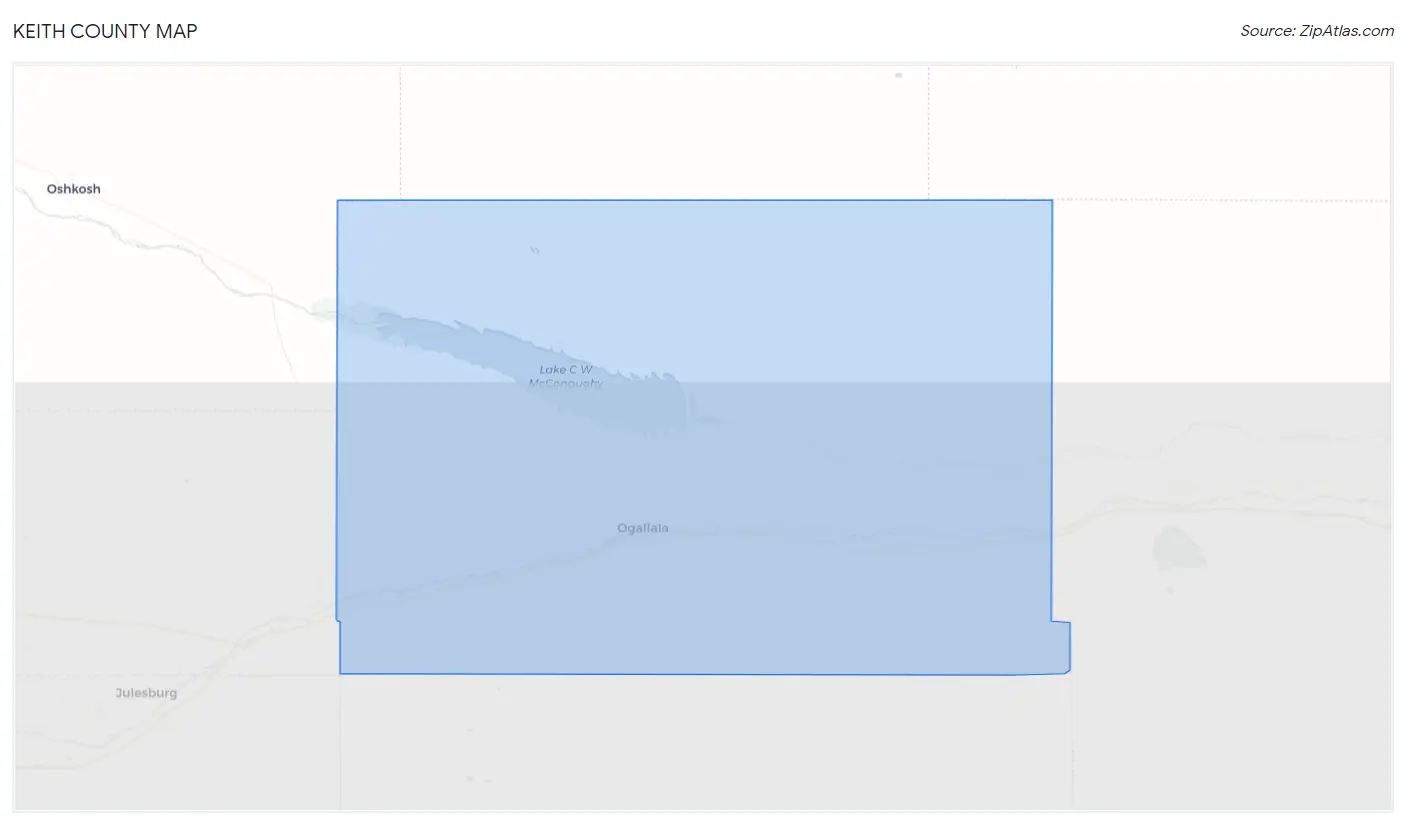
Keith County Map
Keith County Overview
$34,905
PER CAPITA INCOME
$76,777
AVG FAMILY INCOME
$59,511
AVG HOUSEHOLD INCOME
43.1%
WAGE / INCOME GAP [ % ]
56.9¢/ $1
WAGE / INCOME GAP [ $ ]
$8,535
FAMILY INCOME DEFICIT
0.43
INEQUALITY / GINI INDEX
8,303
TOTAL POPULATION
4,218
MALE POPULATION
4,085
FEMALE POPULATION
103.26
MALES / 100 FEMALES
96.85
FEMALES / 100 MALES
49.1
MEDIAN AGE
2.8
AVG FAMILY SIZE
2.2
AVG HOUSEHOLD SIZE
4,167
LABOR FORCE [ PEOPLE ]
60.9%
PERCENT IN LABOR FORCE
2.6%
UNEMPLOYMENT RATE
Keith County Area Codes
Income in Keith County
Income Overview in Keith County
Per Capita Income in Keith County is $34,905, while median incomes of families and households are $76,777 and $59,511 respectively.
| Characteristic | Number | Measure |
| Per Capita Income | 8,303 | $34,905 |
| Median Family Income | 2,217 | $76,777 |
| Mean Family Income | 2,217 | $97,694 |
| Median Household Income | 3,781 | $59,511 |
| Mean Household Income | 3,781 | $76,018 |
| Income Deficit | 2,217 | $8,535 |
| Wage / Income Gap (%) | 8,303 | 43.14% |
| Wage / Income Gap ($) | 8,303 | 56.86¢ per $1 |
| Gini / Inequality Index | 8,303 | 0.43 |
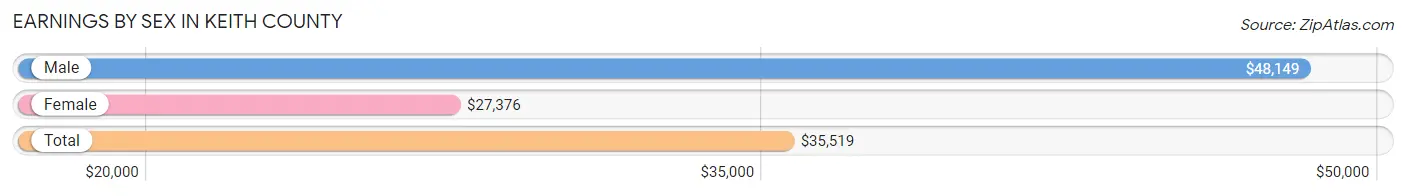
Earnings by Sex in Keith County
Average Earnings in Keith County are $35,519, $48,149 for men and $27,376 for women, a difference of 43.1%.
| Sex | Number | Average Earnings |
| Male | 2,412 (54.2%) | $48,149 |
| Female | 2,040 (45.8%) | $27,376 |
| Total | 4,452 (100.0%) | $35,519 |
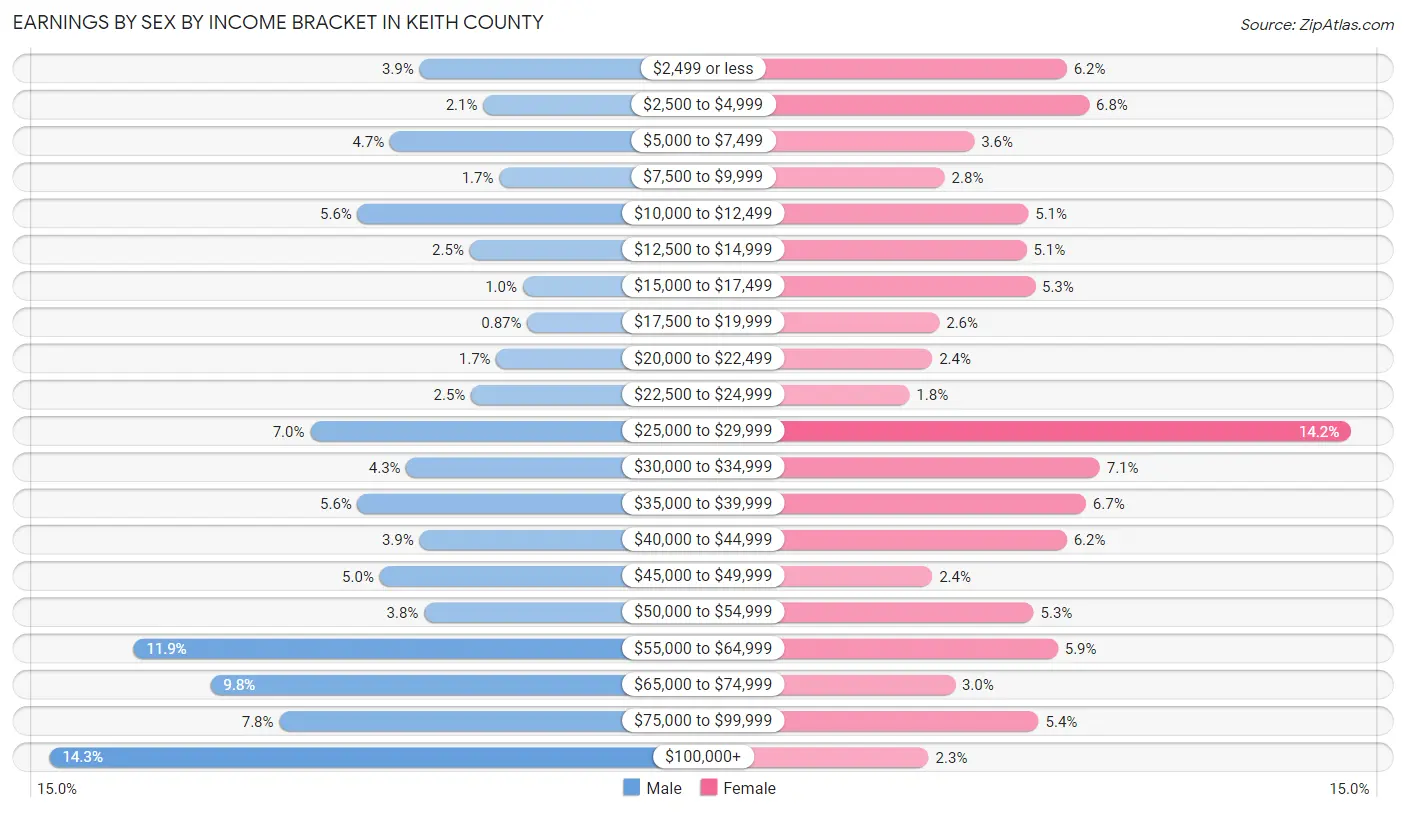
Earnings by Sex by Income Bracket in Keith County
The most common earnings brackets in Keith County are $100,000+ for men (345 | 14.3%) and $25,000 to $29,999 for women (289 | 14.2%).
| Income | Male | Female |
| $2,499 or less | 94 (3.9%) | 126 (6.2%) |
| $2,500 to $4,999 | 51 (2.1%) | 139 (6.8%) |
| $5,000 to $7,499 | 114 (4.7%) | 73 (3.6%) |
| $7,500 to $9,999 | 40 (1.7%) | 56 (2.8%) |
| $10,000 to $12,499 | 136 (5.6%) | 104 (5.1%) |
| $12,500 to $14,999 | 60 (2.5%) | 103 (5.1%) |
| $15,000 to $17,499 | 24 (1.0%) | 108 (5.3%) |
| $17,500 to $19,999 | 21 (0.9%) | 53 (2.6%) |
| $20,000 to $22,499 | 42 (1.7%) | 49 (2.4%) |
| $22,500 to $24,999 | 59 (2.5%) | 36 (1.8%) |
| $25,000 to $29,999 | 168 (7.0%) | 289 (14.2%) |
| $30,000 to $34,999 | 103 (4.3%) | 145 (7.1%) |
| $35,000 to $39,999 | 136 (5.6%) | 137 (6.7%) |
| $40,000 to $44,999 | 94 (3.9%) | 126 (6.2%) |
| $45,000 to $49,999 | 121 (5.0%) | 49 (2.4%) |
| $50,000 to $54,999 | 91 (3.8%) | 107 (5.2%) |
| $55,000 to $64,999 | 288 (11.9%) | 121 (5.9%) |
| $65,000 to $74,999 | 236 (9.8%) | 62 (3.0%) |
| $75,000 to $99,999 | 189 (7.8%) | 110 (5.4%) |
| $100,000+ | 345 (14.3%) | 47 (2.3%) |
| Total | 2,412 (100.0%) | 2,040 (100.0%) |
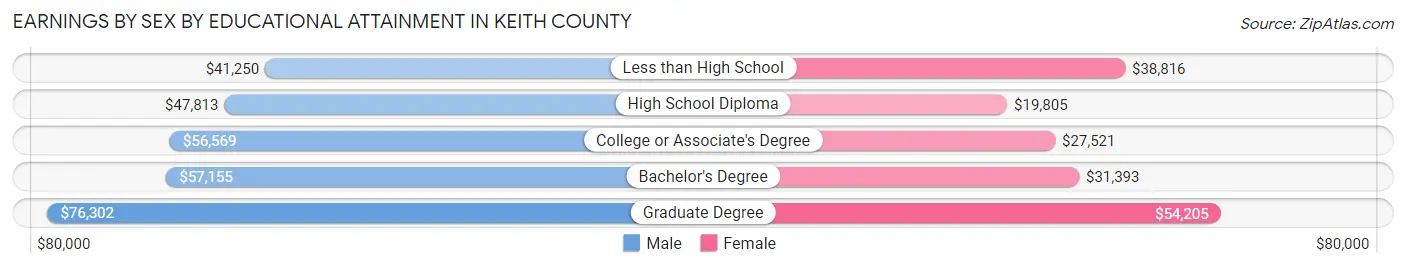
Earnings by Sex by Educational Attainment in Keith County
Average earnings in Keith County are $55,000 for men and $28,109 for women, a difference of 48.9%. Men with an educational attainment of graduate degree enjoy the highest average annual earnings of $76,302, while those with less than high school education earn the least with $41,250. Women with an educational attainment of graduate degree earn the most with the average annual earnings of $54,205, while those with high school diploma education have the smallest earnings of $19,805.
| Educational Attainment | Male Income | Female Income |
| Less than High School | $41,250 | $38,816 |
| High School Diploma | $47,813 | $19,805 |
| College or Associate's Degree | $56,569 | $27,521 |
| Bachelor's Degree | $57,155 | $31,393 |
| Graduate Degree | $76,302 | $54,205 |
| Total | $55,000 | $28,109 |
Family Income in Keith County
Family Income Brackets in Keith County
According to the Keith County family income data, there are 457 families falling into the $50,000 to $74,999 income range, which is the most common income bracket and makes up 20.6% of all families. Conversely, the $10,000 to $14,999 income bracket is the least frequent group with only 24 families (1.1%) belonging to this category.
| Income Bracket | # Families | % Families |
| Less than $10,000 | 42 | 1.9% |
| $10,000 to $14,999 | 24 | 1.1% |
| $15,000 to $24,999 | 58 | 2.6% |
| $25,000 to $34,999 | 186 | 8.4% |
| $35,000 to $49,999 | 293 | 13.2% |
| $50,000 to $74,999 | 457 | 20.6% |
| $75,000 to $99,999 | 350 | 15.8% |
| $100,000 to $149,999 | 406 | 18.3% |
| $150,000 to $199,999 | 233 | 10.5% |
| $200,000+ | 166 | 7.5% |
Family Income by Famaliy Size in Keith County
5-person families (178 | 8.0%) account for the highest median family income in Keith County with $120,000 per family, while 2-person families (1,502 | 67.7%) have the highest median income of $36,298 per family member.
| Income Bracket | # Families | Median Income |
| 2-Person Families | 1,502 (67.7%) | $72,596 |
| 3-Person Families | 317 (14.3%) | $82,723 |
| 4-Person Families | 168 (7.6%) | $94,167 |
| 5-Person Families | 178 (8.0%) | $120,000 |
| 6-Person Families | 39 (1.8%) | $0 |
| 7+ Person Families | 13 (0.6%) | $91,250 |
| Total | 2,217 (100.0%) | $76,777 |
Family Income by Number of Earners in Keith County
The median family income in Keith County is $76,777, with families comprising 3+ earners (162) having the highest median family income of $124,375, while families with no earners (386) have the lowest median family income of $55,000, accounting for 7.3% and 17.4% of families, respectively.
| Number of Earners | # Families | Median Income |
| No Earners | 386 (17.4%) | $55,000 |
| 1 Earner | 662 (29.9%) | $66,250 |
| 2 Earners | 1,007 (45.4%) | $90,568 |
| 3+ Earners | 162 (7.3%) | $124,375 |
| Total | 2,217 (100.0%) | $76,777 |
Household Income in Keith County
Household Income Brackets in Keith County
With 820 households falling in the category, the $50,000 to $74,999 income range is the most frequent in Keith County, accounting for 21.7% of all households. In contrast, only 174 households (4.6%) fall into the $200,000+ income bracket, making it the least populous group.
| Income Bracket | # Households | % Households |
| Less than $10,000 | 231 | 6.1% |
| $10,000 to $14,999 | 219 | 5.8% |
| $15,000 to $24,999 | 253 | 6.7% |
| $25,000 to $34,999 | 318 | 8.4% |
| $35,000 to $49,999 | 526 | 13.9% |
| $50,000 to $74,999 | 820 | 21.7% |
| $75,000 to $99,999 | 507 | 13.4% |
| $100,000 to $149,999 | 476 | 12.6% |
| $150,000 to $199,999 | 257 | 6.8% |
| $200,000+ | 174 | 4.6% |
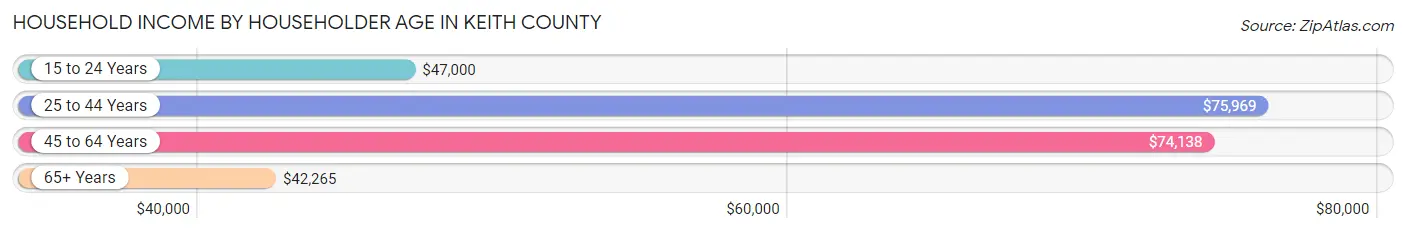
Household Income by Householder Age in Keith County
The median household income in Keith County is $59,511, with the highest median household income of $75,969 found in the 25 to 44 years age bracket for the primary householder. A total of 869 households (23.0%) fall into this category. Meanwhile, the 65+ years age bracket for the primary householder has the lowest median household income of $42,265, with 1,530 households (40.5%) in this group.
| Income Bracket | # Households | Median Income |
| 15 to 24 Years | 136 (3.6%) | $47,000 |
| 25 to 44 Years | 869 (23.0%) | $75,969 |
| 45 to 64 Years | 1,246 (33.0%) | $74,138 |
| 65+ Years | 1,530 (40.5%) | $42,265 |
| Total | 3,781 (100.0%) | $59,511 |
Poverty in Keith County
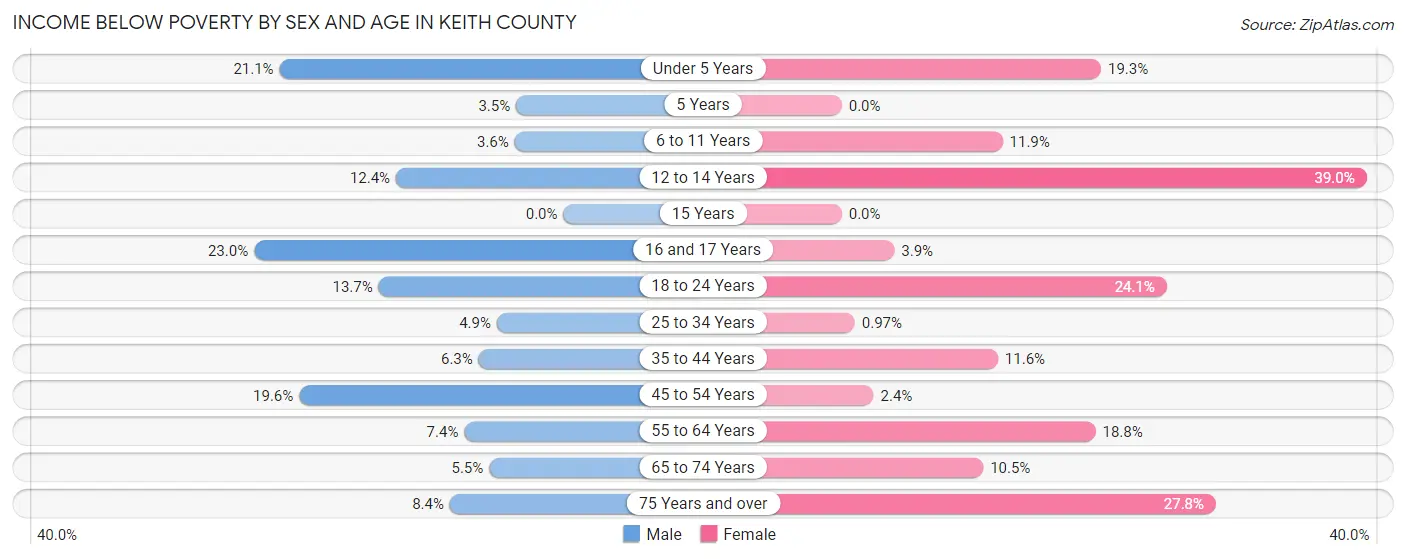
Income Below Poverty by Sex and Age in Keith County
With 9.9% poverty level for males and 14.1% for females among the residents of Keith County, 16 and 17 year old males and 12 to 14 year old females are the most vulnerable to poverty, with 34 males (23.0%) and 30 females (39.0%) in their respective age groups living below the poverty level.
| Age Bracket | Male | Female |
| Under 5 Years | 39 (21.1%) | 36 (19.3%) |
| 5 Years | 2 (3.5%) | 0 (0.0%) |
| 6 to 11 Years | 10 (3.6%) | 43 (11.9%) |
| 12 to 14 Years | 22 (12.4%) | 30 (39.0%) |
| 15 Years | 0 (0.0%) | 0 (0.0%) |
| 16 and 17 Years | 34 (23.0%) | 3 (3.9%) |
| 18 to 24 Years | 38 (13.7%) | 48 (24.1%) |
| 25 to 34 Years | 17 (4.9%) | 4 (1.0%) |
| 35 to 44 Years | 29 (6.3%) | 48 (11.6%) |
| 45 to 54 Years | 103 (19.6%) | 10 (2.4%) |
| 55 to 64 Years | 48 (7.4%) | 114 (18.8%) |
| 65 to 74 Years | 32 (5.5%) | 63 (10.5%) |
| 75 Years and over | 37 (8.4%) | 168 (27.8%) |
| Total | 411 (9.9%) | 567 (14.1%) |
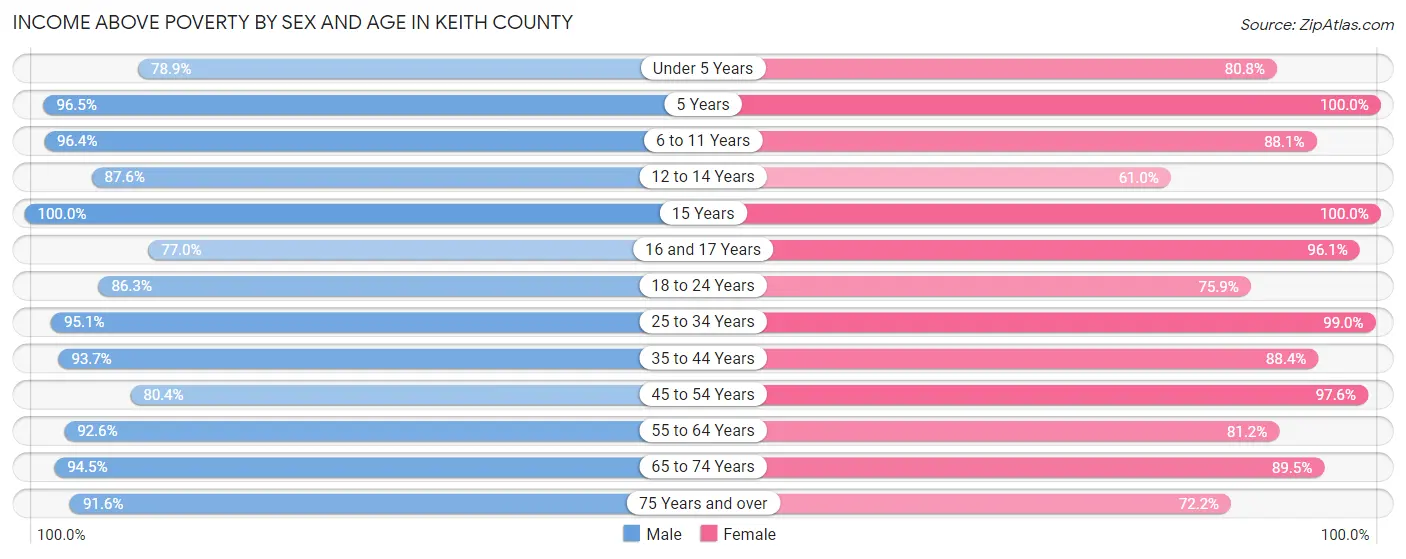
Income Above Poverty by Sex and Age in Keith County
According to the poverty statistics in Keith County, males aged 15 years and females aged 5 years are the age groups that are most secure financially, with 100.0% of males and 100.0% of females in these age groups living above the poverty line.
| Age Bracket | Male | Female |
| Under 5 Years | 146 (78.9%) | 151 (80.7%) |
| 5 Years | 55 (96.5%) | 20 (100.0%) |
| 6 to 11 Years | 266 (96.4%) | 317 (88.1%) |
| 12 to 14 Years | 155 (87.6%) | 47 (61.0%) |
| 15 Years | 43 (100.0%) | 52 (100.0%) |
| 16 and 17 Years | 114 (77.0%) | 74 (96.1%) |
| 18 to 24 Years | 239 (86.3%) | 151 (75.9%) |
| 25 to 34 Years | 327 (95.1%) | 408 (99.0%) |
| 35 to 44 Years | 432 (93.7%) | 366 (88.4%) |
| 45 to 54 Years | 422 (80.4%) | 414 (97.6%) |
| 55 to 64 Years | 604 (92.6%) | 491 (81.2%) |
| 65 to 74 Years | 549 (94.5%) | 537 (89.5%) |
| 75 Years and over | 402 (91.6%) | 437 (72.2%) |
| Total | 3,754 (90.1%) | 3,465 (85.9%) |
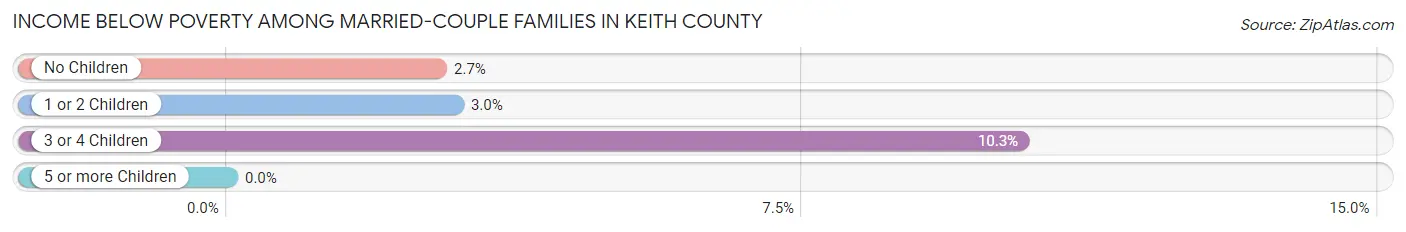
Income Below Poverty Among Married-Couple Families in Keith County
The poverty statistics for married-couple families in Keith County show that 3.4% or 66 of the total 1,919 families live below the poverty line. Families with 3 or 4 children have the highest poverty rate of 10.3%, comprising of 18 families. On the other hand, families with 5 or more children have the lowest poverty rate of 0.0%, which includes 0 families.
| Children | Above Poverty | Below Poverty |
| No Children | 1,389 (97.3%) | 39 (2.7%) |
| 1 or 2 Children | 296 (97.1%) | 9 (2.9%) |
| 3 or 4 Children | 156 (89.7%) | 18 (10.3%) |
| 5 or more Children | 12 (100.0%) | 0 (0.0%) |
| Total | 1,853 (96.6%) | 66 (3.4%) |
Income Below Poverty Among Single-Parent Households in Keith County
According to the poverty data in Keith County, 12.9% or 9 single-father households and 27.2% or 62 single-mother households are living below the poverty line. Among single-father households, those with 3 or 4 children have the highest poverty rate, with 7 households (63.6%) experiencing poverty. Likewise, among single-mother households, those with 3 or 4 children have the highest poverty rate, with 1 households (100.0%) falling below the poverty line.
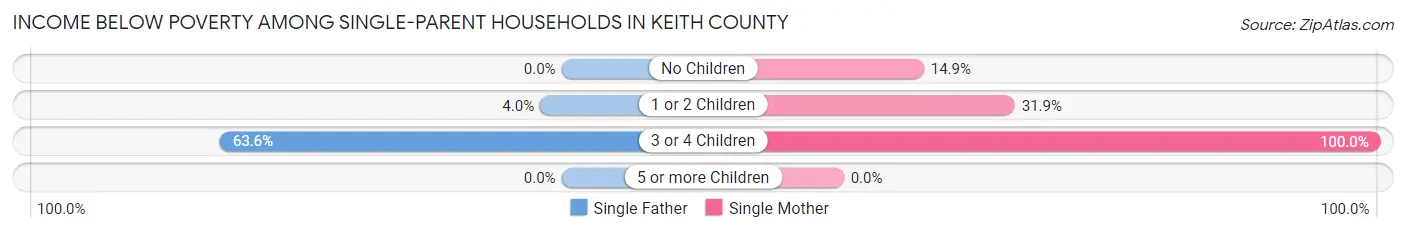
| Children | Single Father | Single Mother |
| No Children | 0 (0.0%) | 10 (14.9%) |
| 1 or 2 Children | 2 (4.0%) | 51 (31.9%) |
| 3 or 4 Children | 7 (63.6%) | 1 (100.0%) |
| 5 or more Children | 0 (0.0%) | 0 (0.0%) |
| Total | 9 (12.9%) | 62 (27.2%) |
Income Below Poverty Among Married-Couple vs Single-Parent Households in Keith County
The poverty data for Keith County shows that 66 of the married-couple family households (3.4%) and 71 of the single-parent households (23.8%) are living below the poverty level. Within the married-couple family households, those with 3 or 4 children have the highest poverty rate, with 18 households (10.3%) falling below the poverty line. Among the single-parent households, those with 3 or 4 children have the highest poverty rate, with 8 household (66.7%) living below poverty.
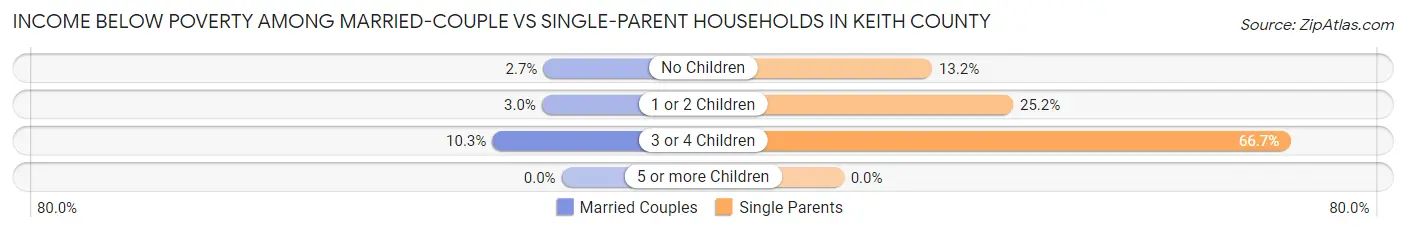
| Children | Married-Couple Families | Single-Parent Households |
| No Children | 39 (2.7%) | 10 (13.2%) |
| 1 or 2 Children | 9 (2.9%) | 53 (25.2%) |
| 3 or 4 Children | 18 (10.3%) | 8 (66.7%) |
| 5 or more Children | 0 (0.0%) | 0 (0.0%) |
| Total | 66 (3.4%) | 71 (23.8%) |
Race in Keith County
The most populous races in Keith County are White / Caucasian (7,568 | 91.1%), Hispanic or Latino (641 | 7.7%), and Two or more Races (347 | 4.2%).
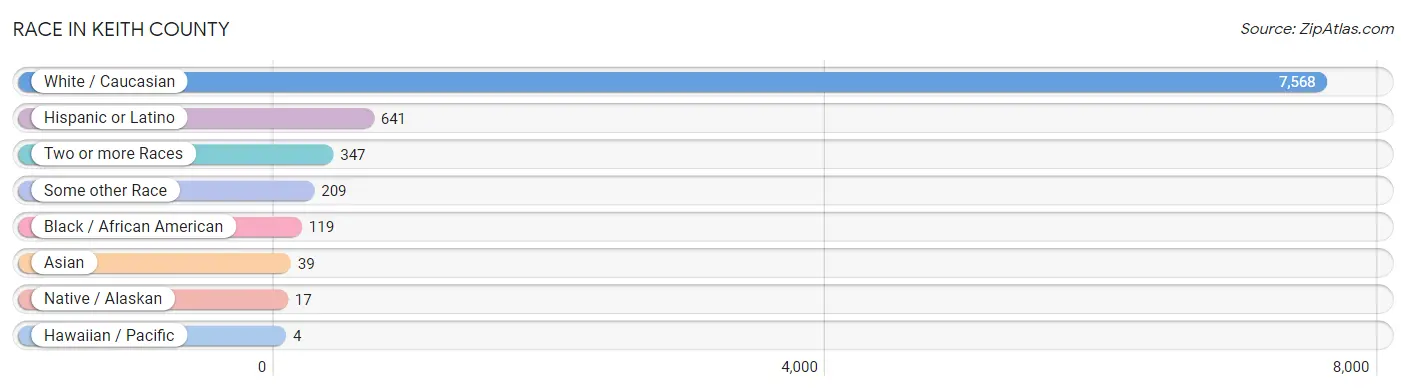
| Race | # Population | % Population |
| Asian | 39 | 0.5% |
| Black / African American | 119 | 1.4% |
| Hawaiian / Pacific | 4 | 0.1% |
| Hispanic or Latino | 641 | 7.7% |
| Native / Alaskan | 17 | 0.2% |
| White / Caucasian | 7,568 | 91.1% |
| Two or more Races | 347 | 4.2% |
| Some other Race | 209 | 2.5% |
| Total | 8,303 | 100.0% |
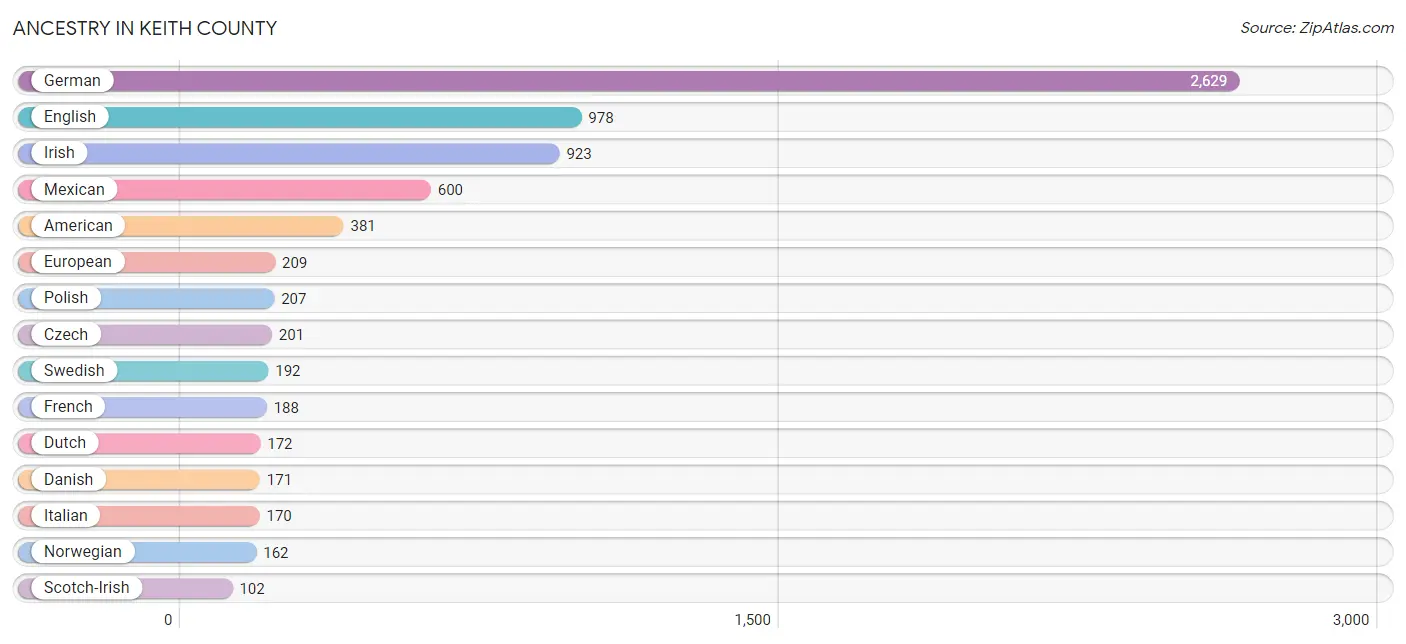
Ancestry in Keith County
The most populous ancestries reported in Keith County are German (2,629 | 31.7%), English (978 | 11.8%), Irish (923 | 11.1%), Mexican (600 | 7.2%), and American (381 | 4.6%), together accounting for 66.4% of all Keith County residents.
| Ancestry | # Population | % Population |
| American | 381 | 4.6% |
| Austrian | 44 | 0.5% |
| Belgian | 39 | 0.5% |
| Bhutanese | 15 | 0.2% |
| British | 22 | 0.3% |
| Burmese | 14 | 0.2% |
| Canadian | 9 | 0.1% |
| Central American | 6 | 0.1% |
| Chippewa | 7 | 0.1% |
| Cuban | 4 | 0.1% |
| Czech | 201 | 2.4% |
| Czechoslovakian | 16 | 0.2% |
| Danish | 171 | 2.1% |
| Delaware | 12 | 0.1% |
| Dutch | 172 | 2.1% |
| English | 978 | 11.8% |
| European | 209 | 2.5% |
| French | 188 | 2.3% |
| French Canadian | 6 | 0.1% |
| German | 2,629 | 31.7% |
| German Russian | 2 | 0.0% |
| Greek | 17 | 0.2% |
| Guatemalan | 6 | 0.1% |
| Hmong | 4 | 0.1% |
| Hungarian | 1 | 0.0% |
| Indian (Asian) | 4 | 0.1% |
| Irish | 923 | 11.1% |
| Italian | 170 | 2.1% |
| Korean | 18 | 0.2% |
| Mexican | 600 | 7.2% |
| Mexican American Indian | 50 | 0.6% |
| Norwegian | 162 | 1.9% |
| Pennsylvania German | 10 | 0.1% |
| Polish | 207 | 2.5% |
| Portuguese | 17 | 0.2% |
| Russian | 51 | 0.6% |
| Samoan | 4 | 0.1% |
| Scandinavian | 31 | 0.4% |
| Scotch-Irish | 102 | 1.2% |
| Scottish | 85 | 1.0% |
| Sioux | 8 | 0.1% |
| Slavic | 4 | 0.1% |
| Spaniard | 10 | 0.1% |
| Spanish | 4 | 0.1% |
| Sri Lankan | 16 | 0.2% |
| Subsaharan African | 1 | 0.0% |
| Sudanese | 1 | 0.0% |
| Swedish | 192 | 2.3% |
| Swiss | 43 | 0.5% |
| Thai | 1 | 0.0% |
| Ukrainian | 9 | 0.1% |
| Welsh | 31 | 0.4% | View All 52 Rows |
Immigrants in Keith County
The most numerous immigrant groups reported in Keith County came from Central America (110 | 1.3%), Latin America (110 | 1.3%), Mexico (106 | 1.3%), Europe (61 | 0.7%), and Czechoslovakia (29 | 0.4%), together accounting for 5.0% of all Keith County residents.
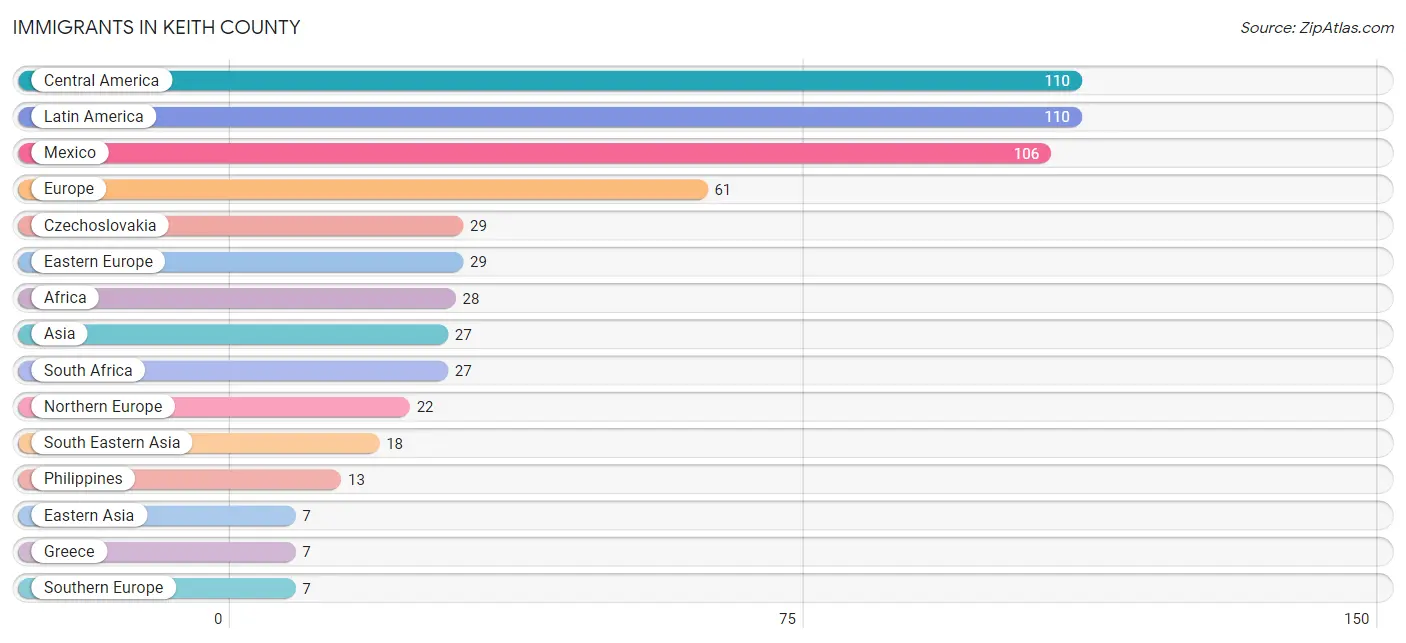
| Immigration Origin | # Population | % Population |
| Africa | 28 | 0.3% |
| Asia | 27 | 0.3% |
| Central America | 110 | 1.3% |
| China | 1 | 0.0% |
| Czechoslovakia | 29 | 0.4% |
| Eastern Africa | 1 | 0.0% |
| Eastern Asia | 7 | 0.1% |
| Eastern Europe | 29 | 0.4% |
| El Salvador | 1 | 0.0% |
| Ethiopia | 1 | 0.0% |
| Europe | 61 | 0.7% |
| Germany | 3 | 0.0% |
| Greece | 7 | 0.1% |
| Guatemala | 3 | 0.0% |
| India | 2 | 0.0% |
| Korea | 6 | 0.1% |
| Latin America | 110 | 1.3% |
| Mexico | 106 | 1.3% |
| Northern Europe | 22 | 0.3% |
| Philippines | 13 | 0.2% |
| South Africa | 27 | 0.3% |
| South Central Asia | 2 | 0.0% |
| South Eastern Asia | 18 | 0.2% |
| Southern Europe | 7 | 0.1% |
| Vietnam | 5 | 0.1% |
| Western Europe | 3 | 0.0% | View All 26 Rows |
Sex and Age in Keith County
Sex and Age in Keith County
The most populous age groups in Keith County are 60 to 64 Years (380 | 9.0%) for men and 65 to 69 Years (365 | 8.9%) for women.
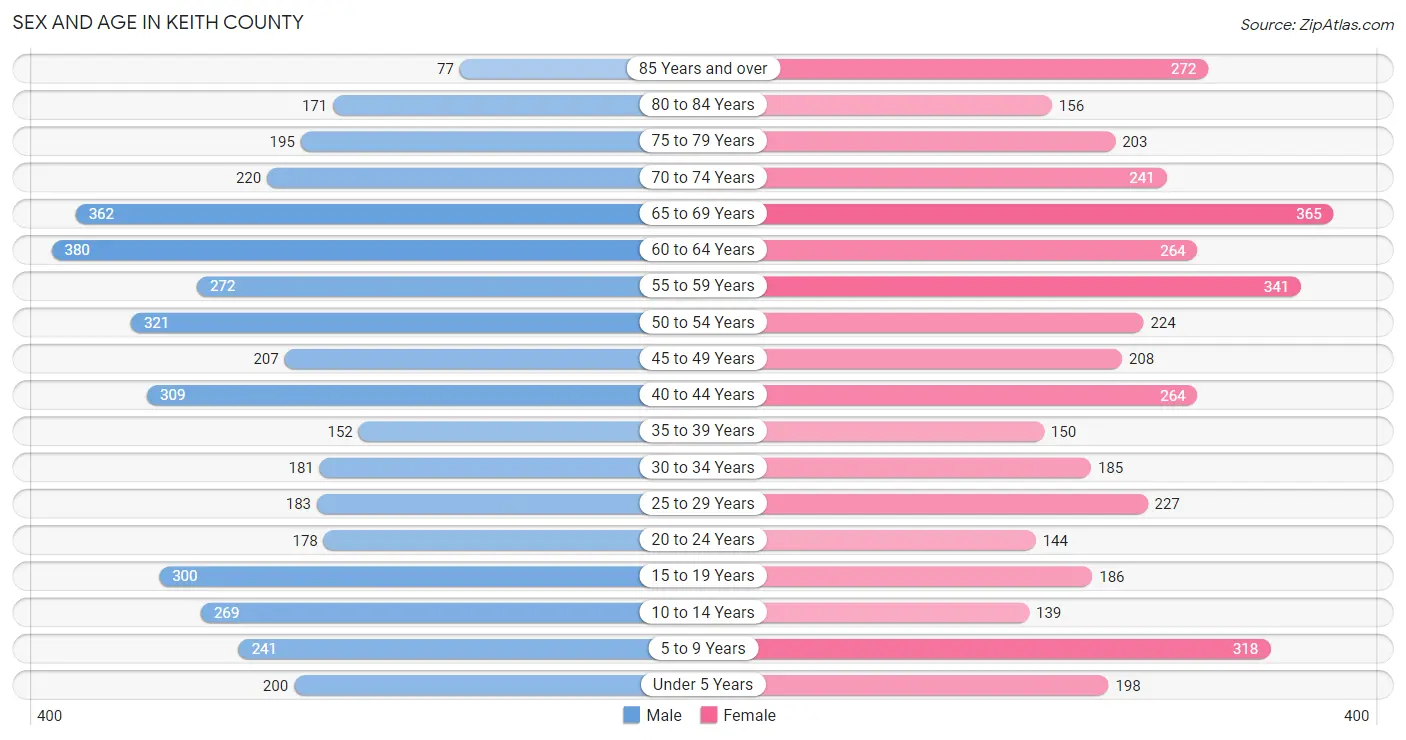
| Age Bracket | Male | Female |
| Under 5 Years | 200 (4.7%) | 198 (4.9%) |
| 5 to 9 Years | 241 (5.7%) | 318 (7.8%) |
| 10 to 14 Years | 269 (6.4%) | 139 (3.4%) |
| 15 to 19 Years | 300 (7.1%) | 186 (4.5%) |
| 20 to 24 Years | 178 (4.2%) | 144 (3.5%) |
| 25 to 29 Years | 183 (4.3%) | 227 (5.6%) |
| 30 to 34 Years | 181 (4.3%) | 185 (4.5%) |
| 35 to 39 Years | 152 (3.6%) | 150 (3.7%) |
| 40 to 44 Years | 309 (7.3%) | 264 (6.5%) |
| 45 to 49 Years | 207 (4.9%) | 208 (5.1%) |
| 50 to 54 Years | 321 (7.6%) | 224 (5.5%) |
| 55 to 59 Years | 272 (6.5%) | 341 (8.4%) |
| 60 to 64 Years | 380 (9.0%) | 264 (6.5%) |
| 65 to 69 Years | 362 (8.6%) | 365 (8.9%) |
| 70 to 74 Years | 220 (5.2%) | 241 (5.9%) |
| 75 to 79 Years | 195 (4.6%) | 203 (5.0%) |
| 80 to 84 Years | 171 (4.1%) | 156 (3.8%) |
| 85 Years and over | 77 (1.8%) | 272 (6.7%) |
| Total | 4,218 (100.0%) | 4,085 (100.0%) |
Families and Households in Keith County
Median Family Size in Keith County
The median family size in Keith County is 2.81 persons per family, with married-couple families (1,919 | 86.6%) accounting for the largest median family size of 2.81 persons per family. On the other hand, married-couple families (1,919 | 86.6%) represent the smallest median family size with 2.81 persons per family.
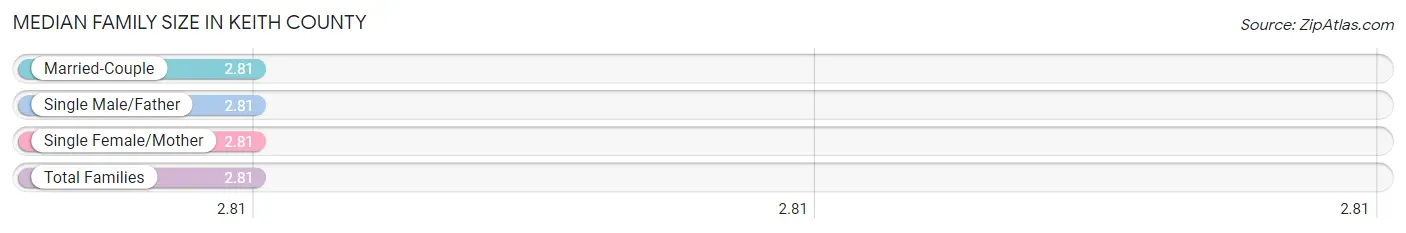
| Family Type | # Families | Family Size |
| Married-Couple | 1,919 (86.6%) | 2.81 |
| Single Male/Father | 70 (3.2%) | 2.81 |
| Single Female/Mother | 228 (10.3%) | 2.81 |
| Total Families | 2,217 (100.0%) | 2.81 |
Median Household Size in Keith County
The median household size in Keith County is 2.17 persons per household, with single male/father households (70 | 1.8%) accounting for the largest median household size of 3.01 persons per household. non-family households (1,564 | 41.4%) represent the smallest median household size with 1.23 persons per household.
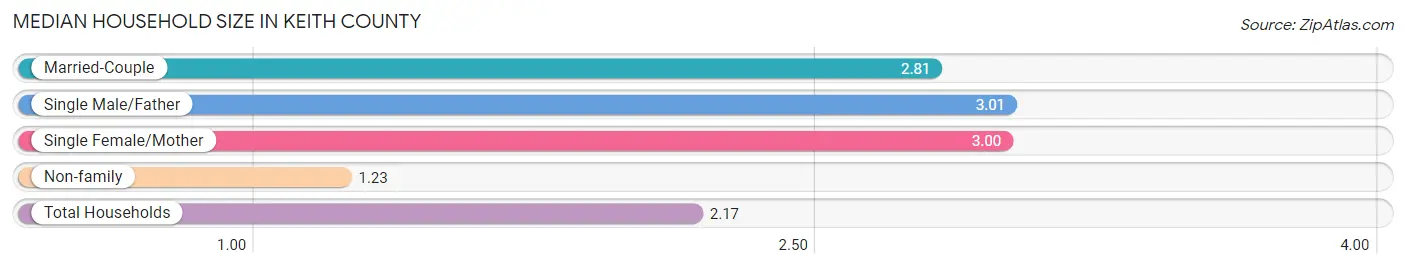
| Household Type | # Households | Household Size |
| Married-Couple | 1,919 (50.7%) | 2.81 |
| Single Male/Father | 70 (1.8%) | 3.01 |
| Single Female/Mother | 228 (6.0%) | 3.00 |
| Non-family | 1,564 (41.4%) | 1.23 |
| Total Households | 3,781 (100.0%) | 2.17 |
Household Size by Marriage Status in Keith County
Out of a total of 3,781 households in Keith County, 2,217 (58.6%) are family households, while 1,564 (41.4%) are nonfamily households. The most numerous type of family households are 2-person households, comprising 1,469, and the most common type of nonfamily households are 1-person households, comprising 1,336.
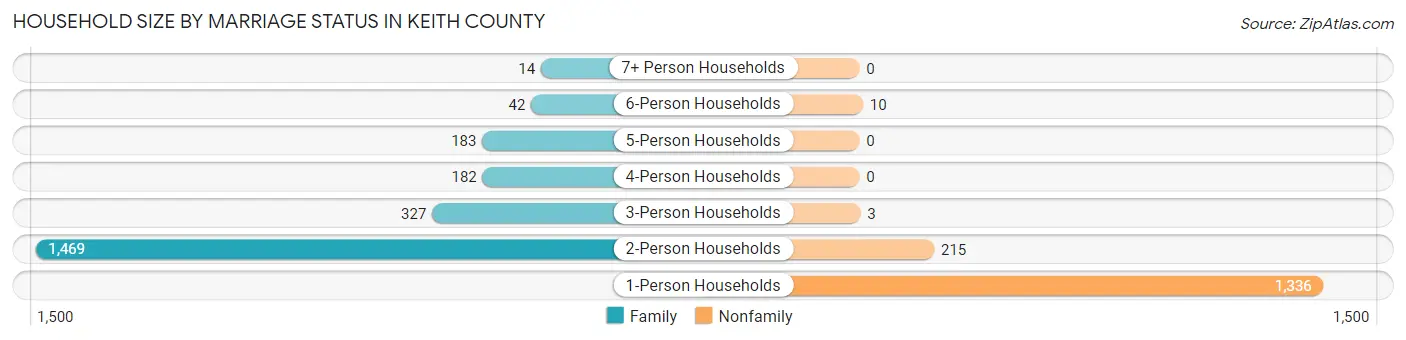
| Household Size | Family Households | Nonfamily Households |
| 1-Person Households | - | 1,336 (35.3%) |
| 2-Person Households | 1,469 (38.9%) | 215 (5.7%) |
| 3-Person Households | 327 (8.6%) | 3 (0.1%) |
| 4-Person Households | 182 (4.8%) | 0 (0.0%) |
| 5-Person Households | 183 (4.8%) | 0 (0.0%) |
| 6-Person Households | 42 (1.1%) | 10 (0.3%) |
| 7+ Person Households | 14 (0.4%) | 0 (0.0%) |
| Total | 2,217 (58.6%) | 1,564 (41.4%) |
Female Fertility in Keith County
Fertility by Age in Keith County
Average fertility rate in Keith County is 88.0 births per 1,000 women. Women in the age bracket of 20 to 34 years have the highest fertility rate with 212.0 births per 1,000 women. Women in the age bracket of 20 to 34 years acount for 95.2% of all women with births.
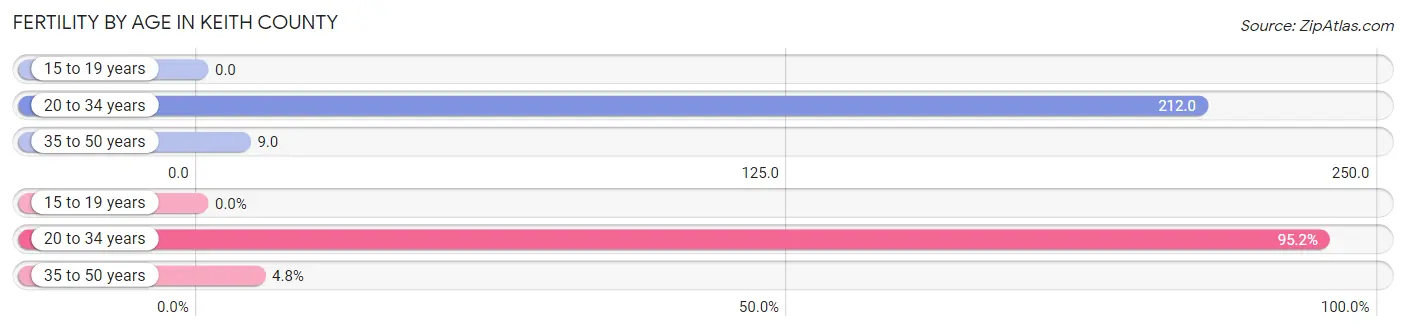
| Age Bracket | Women with Births | Births / 1,000 Women |
| 15 to 19 years | 0 (0.0%) | 0.0 |
| 20 to 34 years | 118 (95.2%) | 212.0 |
| 35 to 50 years | 6 (4.8%) | 9.0 |
| Total | 124 (100.0%) | 88.0 |
Fertility by Age by Marriage Status in Keith County
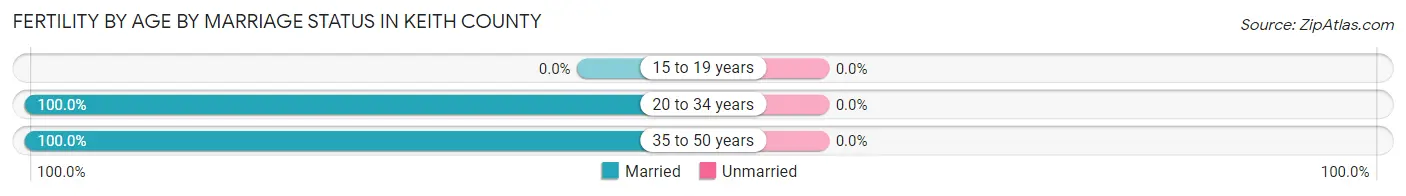
| Age Bracket | Married | Unmarried |
| 15 to 19 years | 0 (0.0%) | 0 (0.0%) |
| 20 to 34 years | 118 (100.0%) | 0 (0.0%) |
| 35 to 50 years | 6 (100.0%) | 0 (0.0%) |
| Total | 124 (100.0%) | 0 (0.0%) |
Fertility by Education in Keith County
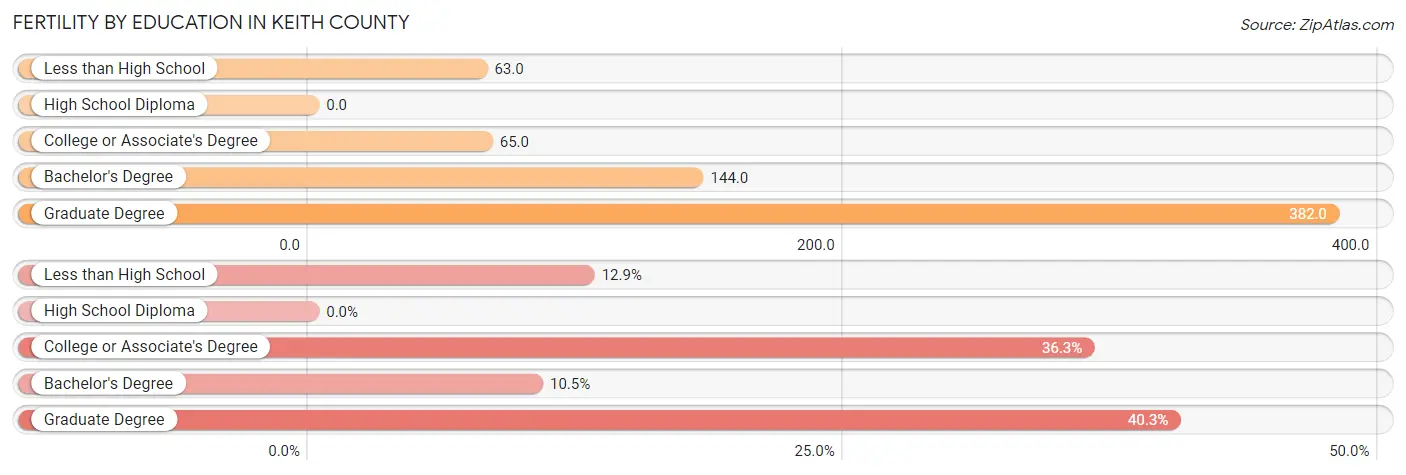
| Educational Attainment | Women with Births | Births / 1,000 Women |
| Less than High School | 16 (12.9%) | 63.0 |
| High School Diploma | 0 (0.0%) | 0.0 |
| College or Associate's Degree | 45 (36.3%) | 65.0 |
| Bachelor's Degree | 13 (10.5%) | 144.0 |
| Graduate Degree | 50 (40.3%) | 382.0 |
| Total | 124 (100.0%) | 88.0 |
Fertility by Education by Marriage Status in Keith County
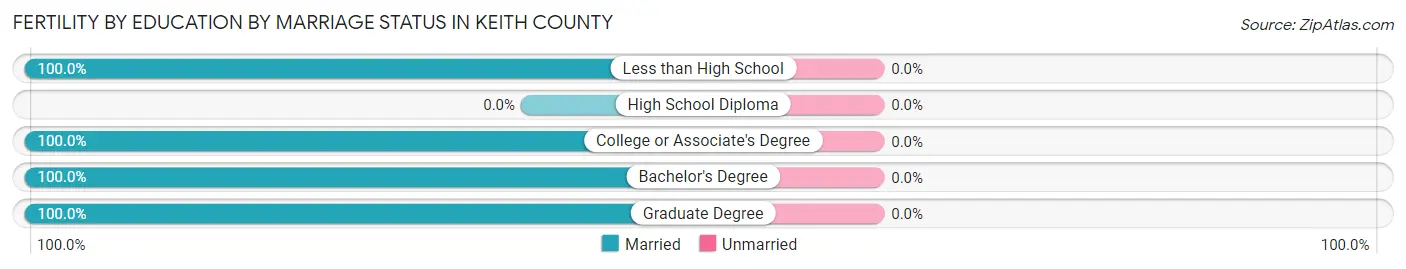
| Educational Attainment | Married | Unmarried |
| Less than High School | 16 (100.0%) | 0 (0.0%) |
| High School Diploma | 0 (0.0%) | 0 (0.0%) |
| College or Associate's Degree | 45 (100.0%) | 0 (0.0%) |
| Bachelor's Degree | 13 (100.0%) | 0 (0.0%) |
| Graduate Degree | 50 (100.0%) | 0 (0.0%) |
| Total | 124 (100.0%) | 0 (0.0%) |
Employment Characteristics in Keith County
Employment by Class of Employer in Keith County
Among the 3,995 employed individuals in Keith County, private company employees (2,469 | 61.8%), self-employed (not incorporated) (433 | 10.8%), and local government employees (365 | 9.1%) make up the most common classes of employment.
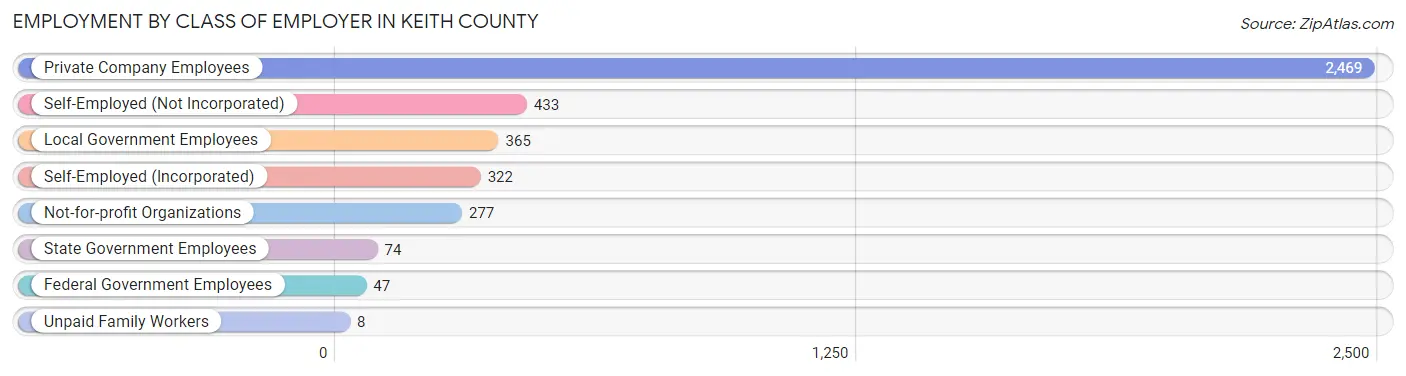
| Employer Class | # Employees | % Employees |
| Private Company Employees | 2,469 | 61.8% |
| Self-Employed (Incorporated) | 322 | 8.1% |
| Self-Employed (Not Incorporated) | 433 | 10.8% |
| Not-for-profit Organizations | 277 | 6.9% |
| Local Government Employees | 365 | 9.1% |
| State Government Employees | 74 | 1.8% |
| Federal Government Employees | 47 | 1.2% |
| Unpaid Family Workers | 8 | 0.2% |
| Total | 3,995 | 100.0% |
Employment Status by Age in Keith County
According to the labor force statistics for Keith County, out of the total population over 16 years of age (6,843), 60.9% or 4,167 individuals are in the labor force, with 2.6% or 108 of them unemployed. The age group with the highest labor force participation rate is 35 to 44 years, with 92.3% or 808 individuals in the labor force. Within the labor force, the 75 years and over age range has the highest percentage of unemployed individuals, with 11.1% or 13 of them being unemployed.
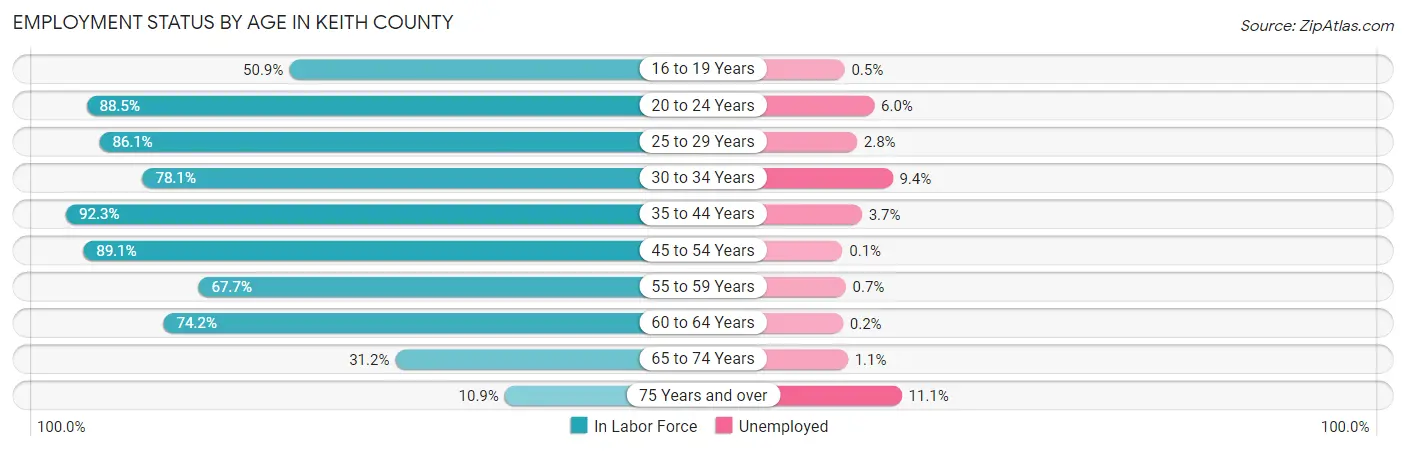
| Age Bracket | In Labor Force | Unemployed |
| 16 to 19 Years | 199 (50.9%) | 1 (0.5%) |
| 20 to 24 Years | 285 (88.5%) | 17 (6.0%) |
| 25 to 29 Years | 353 (86.1%) | 10 (2.8%) |
| 30 to 34 Years | 286 (78.1%) | 27 (9.4%) |
| 35 to 44 Years | 808 (92.3%) | 30 (3.7%) |
| 45 to 54 Years | 855 (89.1%) | 1 (0.1%) |
| 55 to 59 Years | 415 (67.7%) | 3 (0.7%) |
| 60 to 64 Years | 478 (74.2%) | 1 (0.2%) |
| 65 to 74 Years | 371 (31.2%) | 4 (1.1%) |
| 75 Years and over | 117 (10.9%) | 13 (11.1%) |
| Total | 4,167 (60.9%) | 108 (2.6%) |
Employment Status by Educational Attainment in Keith County
According to labor force statistics for Keith County, 82.6% of individuals (3,195) out of the total population between 25 and 64 years of age (3,868) are in the labor force, with 2.3% or 73 of them being unemployed. The group with the highest labor force participation rate are those with the educational attainment of college / associate degree, with 89.4% or 1,674 individuals in the labor force. Within the labor force, individuals with less than high school education have the highest percentage of unemployment, with 14.2% or 22 of them being unemployed.
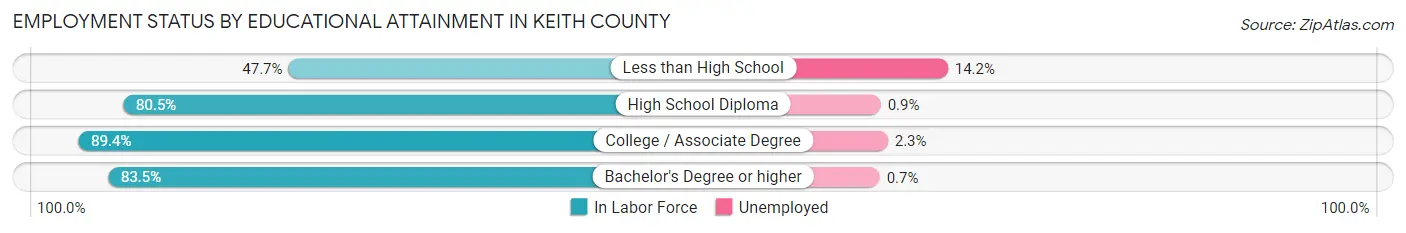
| Educational Attainment | In Labor Force | Unemployed |
| Less than High School | 155 (47.7%) | 46 (14.2%) |
| High School Diploma | 776 (80.5%) | 9 (0.9%) |
| College / Associate Degree | 1,674 (89.4%) | 43 (2.3%) |
| Bachelor's Degree or higher | 590 (83.5%) | 5 (0.7%) |
| Total | 3,195 (82.6%) | 89 (2.3%) |
Employment Occupations by Sex in Keith County
Management, Business, Science and Arts Occupations
The most common Management, Business, Science and Arts occupations in Keith County are Management (647 | 15.9%), Community & Social Service (341 | 8.4%), Education Instruction & Library (237 | 5.8%), Health Diagnosing & Treating (171 | 4.2%), and Business & Financial (133 | 3.3%).
Management, Business, Science and Arts Occupations by Sex
Within the Management, Business, Science and Arts occupations in Keith County, the most male-oriented occupations are Architecture & Engineering (100.0%), Life, Physical & Social Science (100.0%), and Management (71.6%), while the most female-oriented occupations are Legal Services & Support (100.0%), Arts, Media & Entertainment (100.0%), and Health Diagnosing & Treating (90.1%).
| Occupation | Male | Female |
| Management | 463 (71.6%) | 184 (28.4%) |
| Business & Financial | 93 (69.9%) | 40 (30.1%) |
| Computers, Engineering & Science | 43 (47.8%) | 47 (52.2%) |
| Computers & Mathematics | 31 (39.7%) | 47 (60.3%) |
| Architecture & Engineering | 7 (100.0%) | 0 (0.0%) |
| Life, Physical & Social Science | 5 (100.0%) | 0 (0.0%) |
| Community & Social Service | 57 (16.7%) | 284 (83.3%) |
| Education, Arts & Media | 16 (20.3%) | 63 (79.7%) |
| Legal Services & Support | 0 (0.0%) | 14 (100.0%) |
| Education Instruction & Library | 41 (17.3%) | 196 (82.7%) |
| Arts, Media & Entertainment | 0 (0.0%) | 11 (100.0%) |
| Health Diagnosing & Treating | 17 (9.9%) | 154 (90.1%) |
| Health Technologists | 17 (17.5%) | 80 (82.5%) |
| Total (Category) | 673 (48.7%) | 709 (51.3%) |
| Total (Overall) | 2,248 (55.4%) | 1,812 (44.6%) |
Services Occupations
The most common Services occupations in Keith County are Food Preparation & Serving (303 | 7.5%), Cleaning & Maintenance (144 | 3.5%), Healthcare Support (82 | 2.0%), Personal Care & Service (51 | 1.3%), and Security & Protection (16 | 0.4%).
Services Occupations by Sex
Within the Services occupations in Keith County, the most male-oriented occupations are Law Enforcement (69.2%), Security & Protection (62.5%), and Food Preparation & Serving (55.1%), while the most female-oriented occupations are Firefighting & Prevention (66.7%), Healthcare Support (61.0%), and Personal Care & Service (60.8%).
| Occupation | Male | Female |
| Healthcare Support | 32 (39.0%) | 50 (61.0%) |
| Security & Protection | 10 (62.5%) | 6 (37.5%) |
| Firefighting & Prevention | 1 (33.3%) | 2 (66.7%) |
| Law Enforcement | 9 (69.2%) | 4 (30.8%) |
| Food Preparation & Serving | 167 (55.1%) | 136 (44.9%) |
| Cleaning & Maintenance | 57 (39.6%) | 87 (60.4%) |
| Personal Care & Service | 20 (39.2%) | 31 (60.8%) |
| Total (Category) | 286 (48.0%) | 310 (52.0%) |
| Total (Overall) | 2,248 (55.4%) | 1,812 (44.6%) |
Sales and Office Occupations
The most common Sales and Office occupations in Keith County are Sales & Related (695 | 17.1%), and Office & Administration (345 | 8.5%).

Sales and Office Occupations by Sex
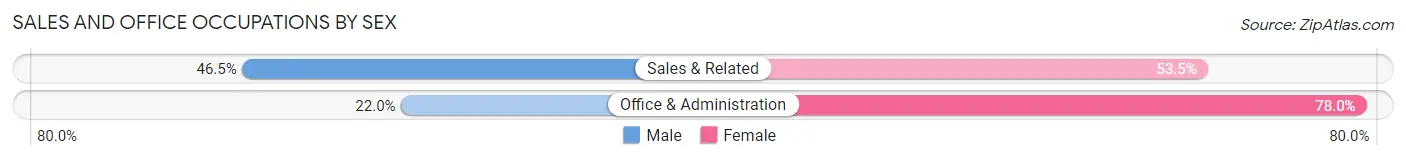
| Occupation | Male | Female |
| Sales & Related | 323 (46.5%) | 372 (53.5%) |
| Office & Administration | 76 (22.0%) | 269 (78.0%) |
| Total (Category) | 399 (38.4%) | 641 (61.6%) |
| Total (Overall) | 2,248 (55.4%) | 1,812 (44.6%) |
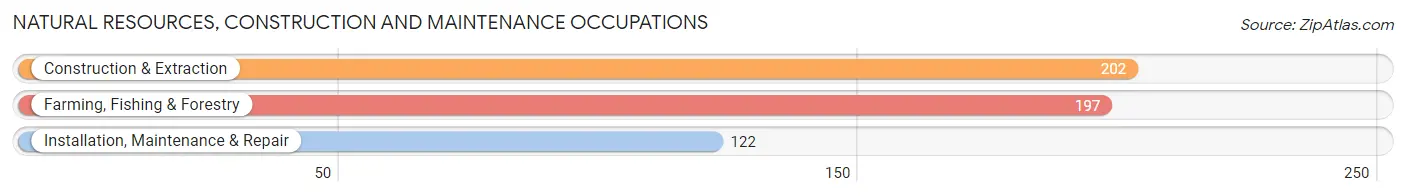
Natural Resources, Construction and Maintenance Occupations
The most common Natural Resources, Construction and Maintenance occupations in Keith County are Construction & Extraction (202 | 5.0%), Farming, Fishing & Forestry (197 | 4.9%), and Installation, Maintenance & Repair (122 | 3.0%).
Natural Resources, Construction and Maintenance Occupations by Sex
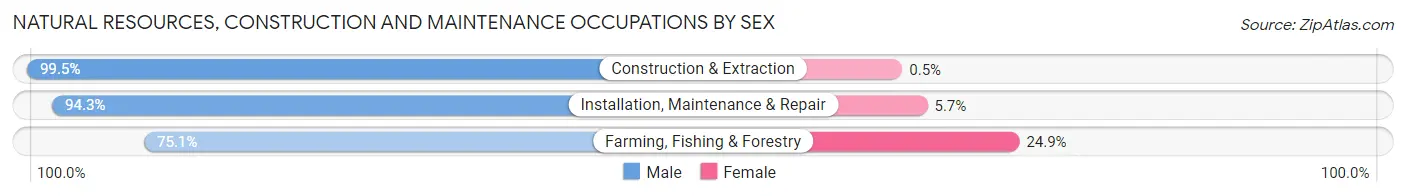
| Occupation | Male | Female |
| Farming, Fishing & Forestry | 148 (75.1%) | 49 (24.9%) |
| Construction & Extraction | 201 (99.5%) | 1 (0.5%) |
| Installation, Maintenance & Repair | 115 (94.3%) | 7 (5.7%) |
| Total (Category) | 464 (89.1%) | 57 (10.9%) |
| Total (Overall) | 2,248 (55.4%) | 1,812 (44.6%) |
Production, Transportation and Moving Occupations
The most common Production, Transportation and Moving occupations in Keith County are Transportation (277 | 6.8%), Production (178 | 4.4%), and Material Moving (66 | 1.6%).
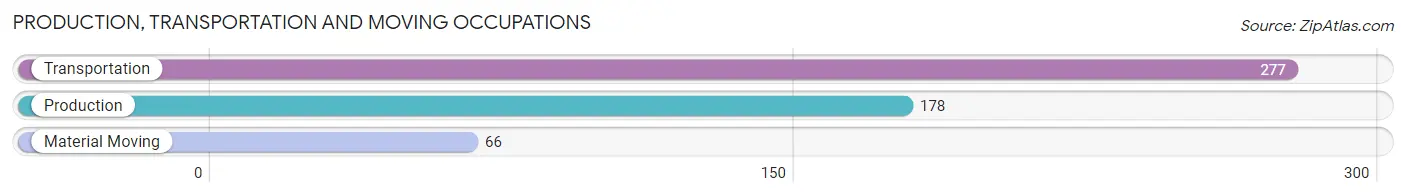
Production, Transportation and Moving Occupations by Sex
| Occupation | Male | Female |
| Production | 117 (65.7%) | 61 (34.3%) |
| Transportation | 249 (89.9%) | 28 (10.1%) |
| Material Moving | 60 (90.9%) | 6 (9.1%) |
| Total (Category) | 426 (81.8%) | 95 (18.2%) |
| Total (Overall) | 2,248 (55.4%) | 1,812 (44.6%) |
Employment Industries by Sex in Keith County
Employment Industries in Keith County
The major employment industries in Keith County include Retail Trade (728 | 17.9%), Agriculture, Fishing & Hunting (471 | 11.6%), Accommodation & Food Services (433 | 10.7%), Health Care & Social Assistance (398 | 9.8%), and Educational Services (257 | 6.3%).
Employment Industries by Sex in Keith County
The Keith County industries that see more men than women are Mining, Quarrying, & Extraction (100.0%), Construction (96.5%), and Utilities (90.1%), whereas the industries that tend to have a higher number of women are Health Care & Social Assistance (79.6%), Information (77.4%), and Finance & Insurance (70.8%).
| Industry | Male | Female |
| Agriculture, Fishing & Hunting | 383 (81.3%) | 88 (18.7%) |
| Mining, Quarrying, & Extraction | 60 (100.0%) | 0 (0.0%) |
| Construction | 220 (96.5%) | 8 (3.5%) |
| Manufacturing | 97 (47.5%) | 107 (52.4%) |
| Wholesale Trade | 96 (68.6%) | 44 (31.4%) |
| Retail Trade | 349 (47.9%) | 379 (52.1%) |
| Transportation & Warehousing | 182 (74.3%) | 63 (25.7%) |
| Utilities | 109 (90.1%) | 12 (9.9%) |
| Information | 12 (22.6%) | 41 (77.4%) |
| Finance & Insurance | 31 (29.2%) | 75 (70.8%) |
| Real Estate, Rental & Leasing | 22 (30.1%) | 51 (69.9%) |
| Professional & Scientific | 58 (50.0%) | 58 (50.0%) |
| Enterprise Management | 0 (0.0%) | 0 (0.0%) |
| Administrative & Support | 67 (65.0%) | 36 (34.9%) |
| Educational Services | 81 (31.5%) | 176 (68.5%) |
| Health Care & Social Assistance | 81 (20.3%) | 317 (79.6%) |
| Arts, Entertainment & Recreation | 26 (78.8%) | 7 (21.2%) |
| Accommodation & Food Services | 222 (51.3%) | 211 (48.7%) |
| Public Administration | 56 (44.1%) | 71 (55.9%) |
| Total | 2,248 (55.4%) | 1,812 (44.6%) |
Education in Keith County
School Enrollment in Keith County
The most common levels of schooling among the 1,582 students in Keith County are elementary school (488 | 30.8%), high school (383 | 24.2%), and middle school (296 | 18.7%).
| School Level | # Students | % Students |
| Nursery / Preschool | 101 | 6.4% |
| Kindergarten | 99 | 6.3% |
| Elementary School | 488 | 30.8% |
| Middle School | 296 | 18.7% |
| High School | 383 | 24.2% |
| College / Undergraduate | 170 | 10.7% |
| Graduate / Professional | 45 | 2.8% |
| Total | 1,582 | 100.0% |
School Enrollment by Age by Funding Source in Keith County
Out of a total of 1,582 students who are enrolled in schools in Keith County, 286 (18.1%) attend a private institution, while the remaining 1,296 (81.9%) are enrolled in public schools. The age group of 3 to 4 year olds has the highest likelihood of being enrolled in private schools, with 66 (82.5% in the age bracket) enrolled. Conversely, the age group of 25 to 34 year olds has the lowest likelihood of being enrolled in a private school, with 44 (100.0% in the age bracket) attending a public institution.
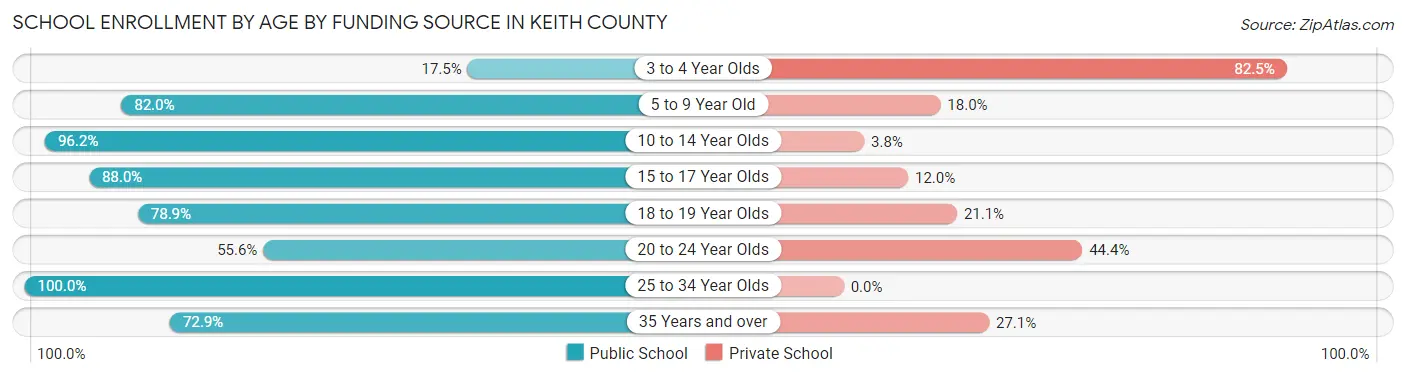
| Age Bracket | Public School | Private School |
| 3 to 4 Year Olds | 14 (17.5%) | 66 (82.5%) |
| 5 to 9 Year Old | 405 (82.0%) | 89 (18.0%) |
| 10 to 14 Year Olds | 380 (96.2%) | 15 (3.8%) |
| 15 to 17 Year Olds | 257 (88.0%) | 35 (12.0%) |
| 18 to 19 Year Olds | 86 (78.9%) | 23 (21.1%) |
| 20 to 24 Year Olds | 40 (55.6%) | 32 (44.4%) |
| 25 to 34 Year Olds | 44 (100.0%) | 0 (0.0%) |
| 35 Years and over | 70 (72.9%) | 26 (27.1%) |
| Total | 1,296 (81.9%) | 286 (18.1%) |
Educational Attainment by Field of Study in Keith County
Education (372 | 28.1%), business (196 | 14.8%), science & technology (175 | 13.2%), bio, nature & agricultural (172 | 13.0%), and liberal arts & history (90 | 6.8%) are the most common fields of study among 1,325 individuals in Keith County who have obtained a bachelor's degree or higher.
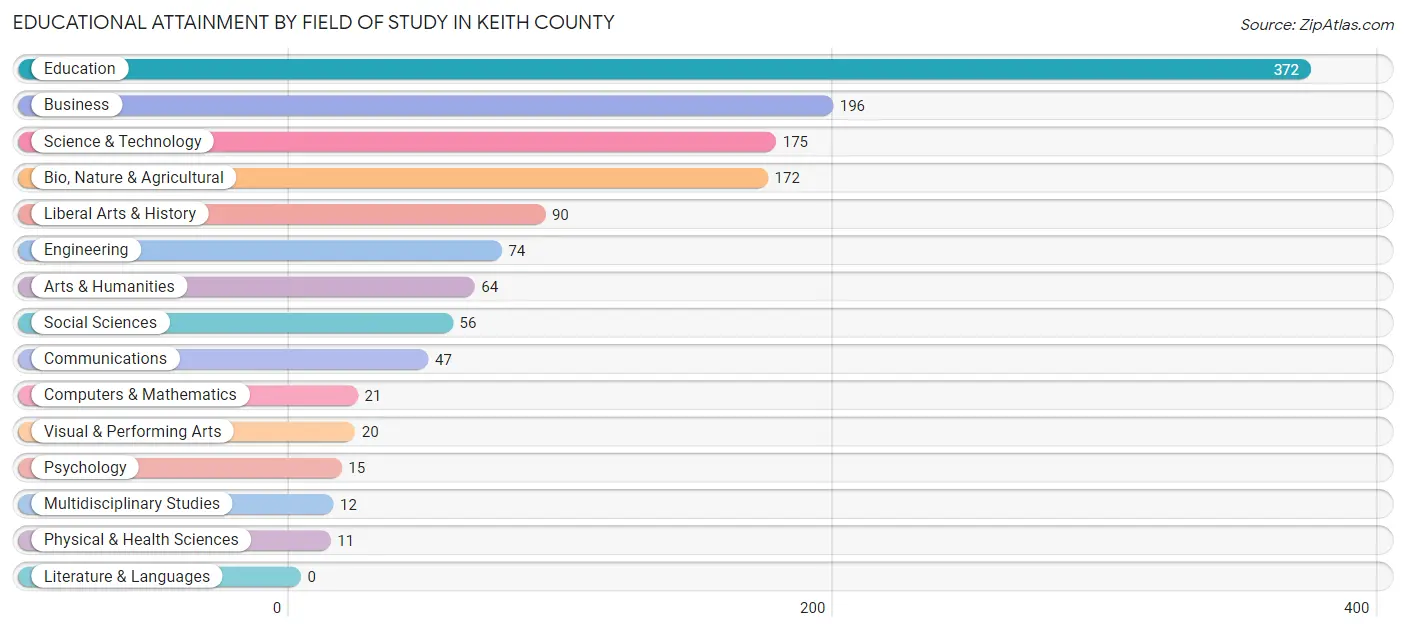
| Field of Study | # Graduates | % Graduates |
| Computers & Mathematics | 21 | 1.6% |
| Bio, Nature & Agricultural | 172 | 13.0% |
| Physical & Health Sciences | 11 | 0.8% |
| Psychology | 15 | 1.1% |
| Social Sciences | 56 | 4.2% |
| Engineering | 74 | 5.6% |
| Multidisciplinary Studies | 12 | 0.9% |
| Science & Technology | 175 | 13.2% |
| Business | 196 | 14.8% |
| Education | 372 | 28.1% |
| Literature & Languages | 0 | 0.0% |
| Liberal Arts & History | 90 | 6.8% |
| Visual & Performing Arts | 20 | 1.5% |
| Communications | 47 | 3.5% |
| Arts & Humanities | 64 | 4.8% |
| Total | 1,325 | 100.0% |
Transportation & Commute in Keith County
Vehicle Availability by Sex in Keith County
The most prevalent vehicle ownership categories in Keith County are males with 2 vehicles (930, accounting for 41.6%) and females with 2 vehicles (776, making up 52.9%).
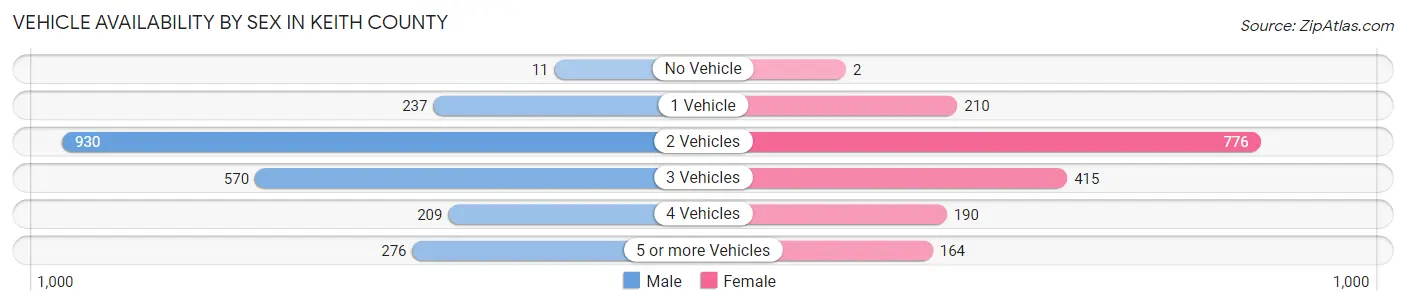
| Vehicles Available | Male | Female |
| No Vehicle | 11 (0.5%) | 2 (0.1%) |
| 1 Vehicle | 237 (10.6%) | 210 (11.9%) |
| 2 Vehicles | 930 (41.6%) | 776 (44.2%) |
| 3 Vehicles | 570 (25.5%) | 415 (23.6%) |
| 4 Vehicles | 209 (9.4%) | 190 (10.8%) |
| 5 or more Vehicles | 276 (12.4%) | 164 (9.3%) |
| Total | 2,233 (100.0%) | 1,757 (100.0%) |
Commute Time in Keith County
The most frequently occuring commute durations in Keith County are 5 to 9 minutes (925 commuters, 25.2%), 10 to 14 minutes (738 commuters, 20.1%), and less than 5 minutes (728 commuters, 19.8%).
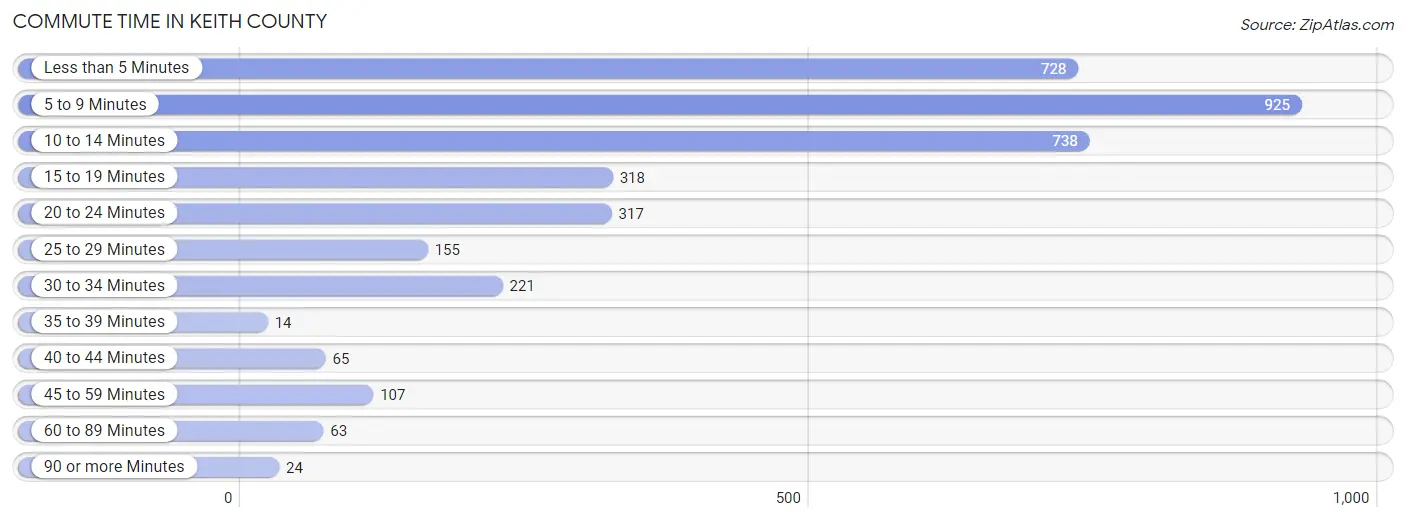
| Commute Time | # Commuters | % Commuters |
| Less than 5 Minutes | 728 | 19.8% |
| 5 to 9 Minutes | 925 | 25.2% |
| 10 to 14 Minutes | 738 | 20.1% |
| 15 to 19 Minutes | 318 | 8.6% |
| 20 to 24 Minutes | 317 | 8.6% |
| 25 to 29 Minutes | 155 | 4.2% |
| 30 to 34 Minutes | 221 | 6.0% |
| 35 to 39 Minutes | 14 | 0.4% |
| 40 to 44 Minutes | 65 | 1.8% |
| 45 to 59 Minutes | 107 | 2.9% |
| 60 to 89 Minutes | 63 | 1.7% |
| 90 or more Minutes | 24 | 0.6% |
Commute Time by Sex in Keith County
The most common commute times in Keith County are 5 to 9 minutes (531 commuters, 26.4%) for males and 5 to 9 minutes (394 commuters, 23.7%) for females.
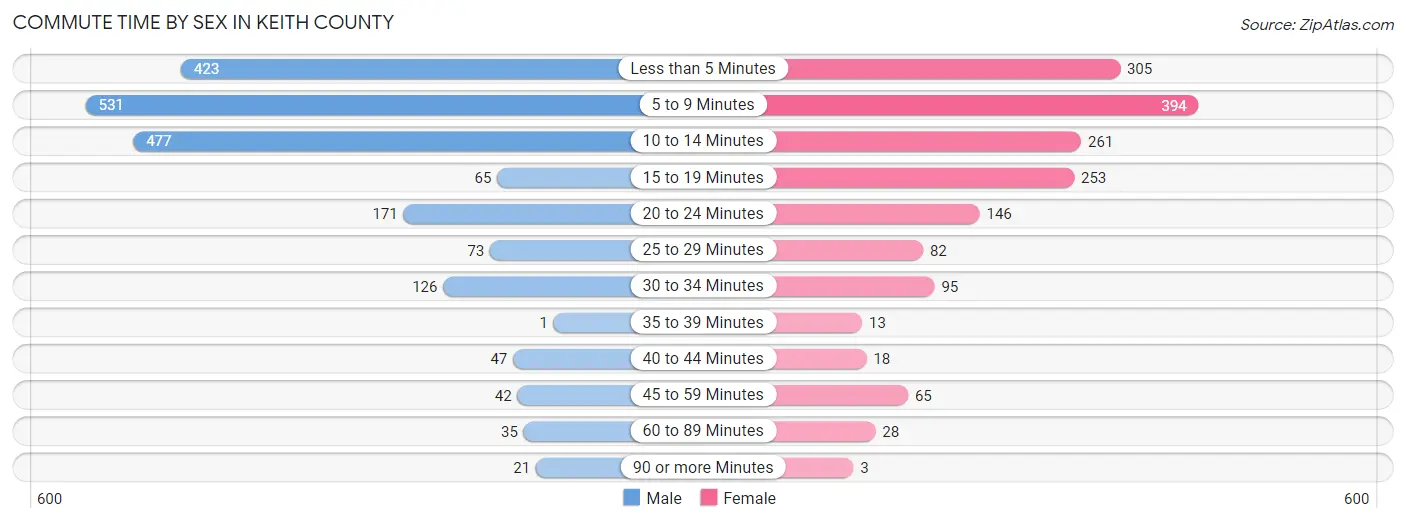
| Commute Time | Male | Female |
| Less than 5 Minutes | 423 (21.0%) | 305 (18.3%) |
| 5 to 9 Minutes | 531 (26.4%) | 394 (23.7%) |
| 10 to 14 Minutes | 477 (23.7%) | 261 (15.7%) |
| 15 to 19 Minutes | 65 (3.2%) | 253 (15.2%) |
| 20 to 24 Minutes | 171 (8.5%) | 146 (8.8%) |
| 25 to 29 Minutes | 73 (3.6%) | 82 (4.9%) |
| 30 to 34 Minutes | 126 (6.3%) | 95 (5.7%) |
| 35 to 39 Minutes | 1 (0.1%) | 13 (0.8%) |
| 40 to 44 Minutes | 47 (2.3%) | 18 (1.1%) |
| 45 to 59 Minutes | 42 (2.1%) | 65 (3.9%) |
| 60 to 89 Minutes | 35 (1.7%) | 28 (1.7%) |
| 90 or more Minutes | 21 (1.0%) | 3 (0.2%) |
Time of Departure to Work by Sex in Keith County
The most frequent times of departure to work in Keith County are 7:30 AM to 7:59 AM (348, 17.3%) for males and 7:30 AM to 7:59 AM (422, 25.4%) for females.
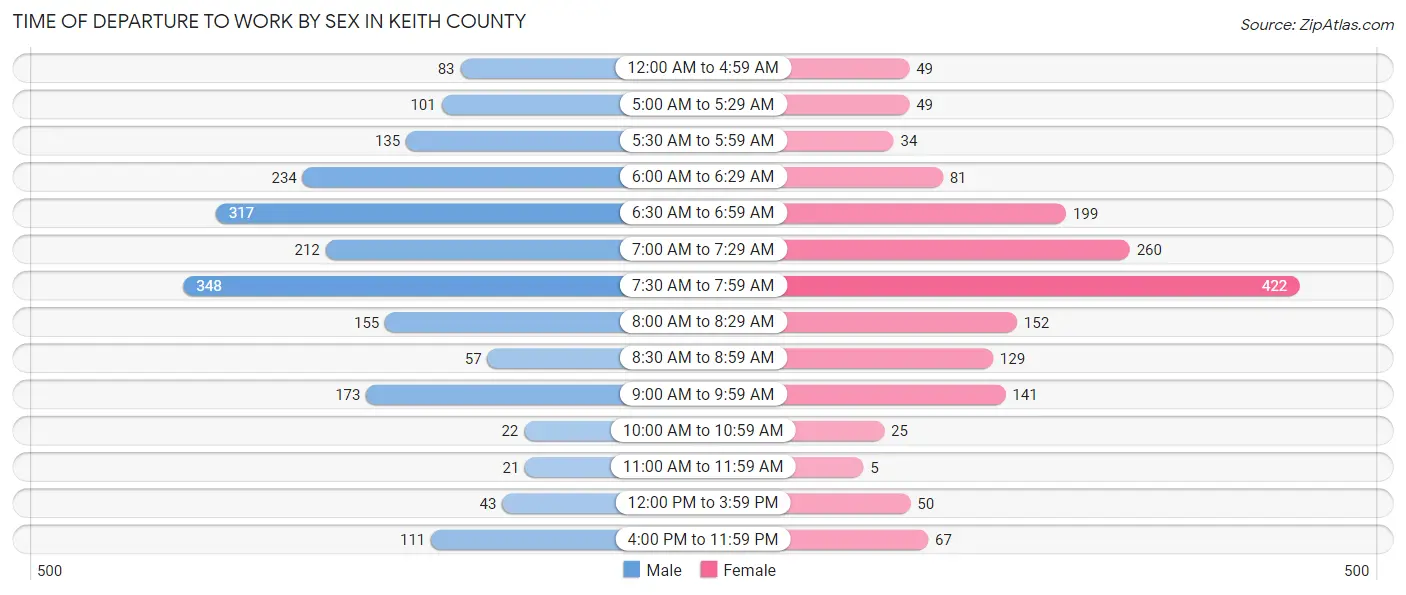
| Time of Departure | Male | Female |
| 12:00 AM to 4:59 AM | 83 (4.1%) | 49 (2.9%) |
| 5:00 AM to 5:29 AM | 101 (5.0%) | 49 (2.9%) |
| 5:30 AM to 5:59 AM | 135 (6.7%) | 34 (2.0%) |
| 6:00 AM to 6:29 AM | 234 (11.6%) | 81 (4.9%) |
| 6:30 AM to 6:59 AM | 317 (15.8%) | 199 (12.0%) |
| 7:00 AM to 7:29 AM | 212 (10.5%) | 260 (15.6%) |
| 7:30 AM to 7:59 AM | 348 (17.3%) | 422 (25.4%) |
| 8:00 AM to 8:29 AM | 155 (7.7%) | 152 (9.1%) |
| 8:30 AM to 8:59 AM | 57 (2.8%) | 129 (7.8%) |
| 9:00 AM to 9:59 AM | 173 (8.6%) | 141 (8.5%) |
| 10:00 AM to 10:59 AM | 22 (1.1%) | 25 (1.5%) |
| 11:00 AM to 11:59 AM | 21 (1.0%) | 5 (0.3%) |
| 12:00 PM to 3:59 PM | 43 (2.1%) | 50 (3.0%) |
| 4:00 PM to 11:59 PM | 111 (5.5%) | 67 (4.0%) |
| Total | 2,012 (100.0%) | 1,663 (100.0%) |
Housing Occupancy in Keith County
Occupancy by Ownership in Keith County
Of the total 3,781 dwellings in Keith County, owner-occupied units account for 2,797 (74.0%), while renter-occupied units make up 984 (26.0%).
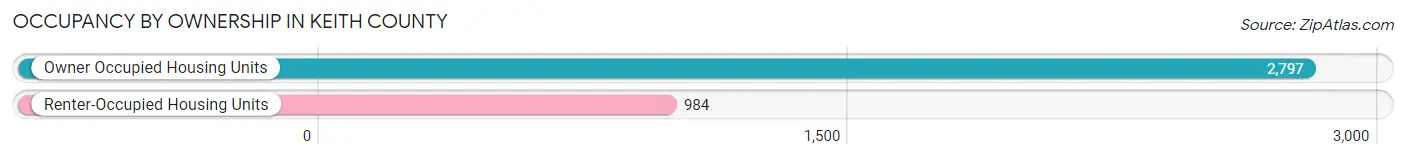
| Occupancy | # Housing Units | % Housing Units |
| Owner Occupied Housing Units | 2,797 | 74.0% |
| Renter-Occupied Housing Units | 984 | 26.0% |
| Total Occupied Housing Units | 3,781 | 100.0% |
Occupancy by Household Size in Keith County
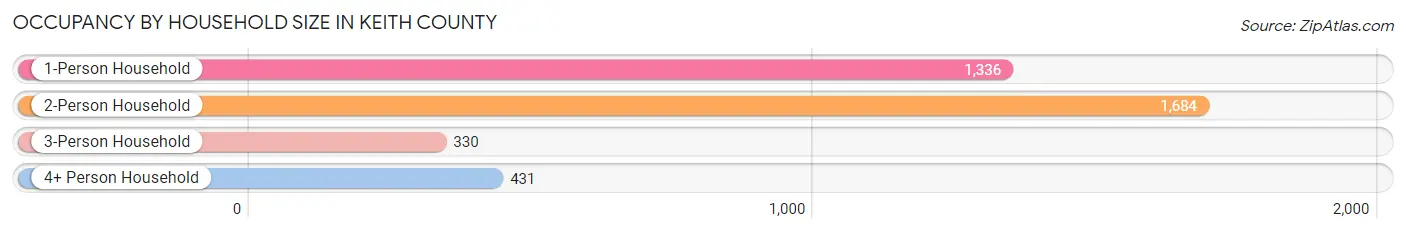
| Household Size | # Housing Units | % Housing Units |
| 1-Person Household | 1,336 | 35.3% |
| 2-Person Household | 1,684 | 44.5% |
| 3-Person Household | 330 | 8.7% |
| 4+ Person Household | 431 | 11.4% |
| Total Housing Units | 3,781 | 100.0% |
Occupancy by Ownership by Household Size in Keith County
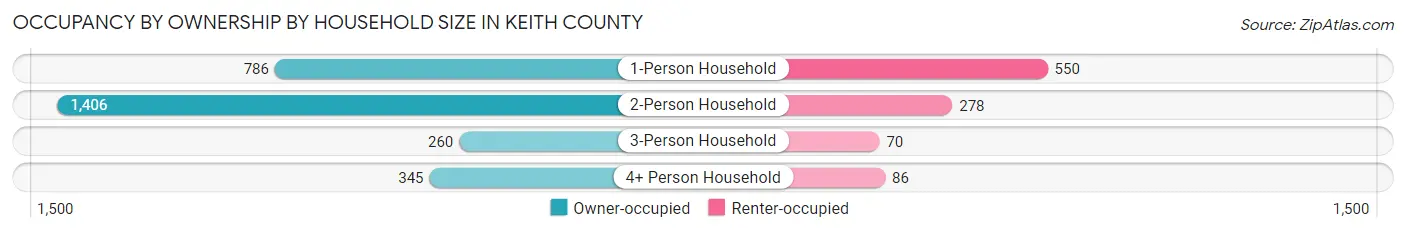
| Household Size | Owner-occupied | Renter-occupied |
| 1-Person Household | 786 (58.8%) | 550 (41.2%) |
| 2-Person Household | 1,406 (83.5%) | 278 (16.5%) |
| 3-Person Household | 260 (78.8%) | 70 (21.2%) |
| 4+ Person Household | 345 (80.0%) | 86 (20.0%) |
| Total Housing Units | 2,797 (74.0%) | 984 (26.0%) |
Occupancy by Educational Attainment in Keith County
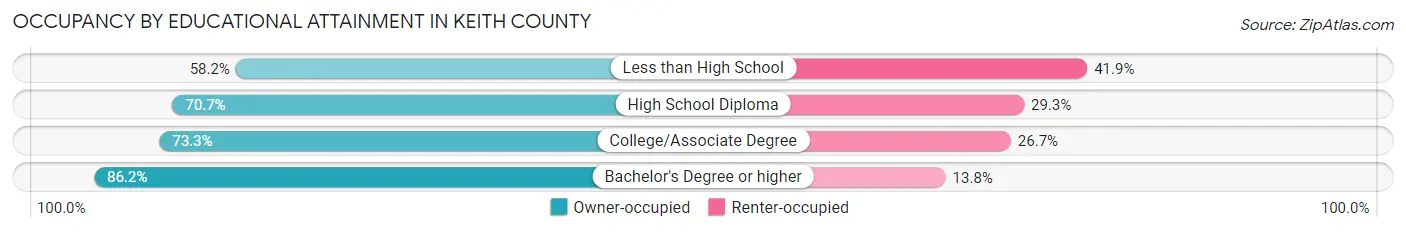
| Household Size | Owner-occupied | Renter-occupied |
| Less than High School | 207 (58.2%) | 149 (41.8%) |
| High School Diploma | 714 (70.7%) | 296 (29.3%) |
| College/Associate Degree | 1,169 (73.3%) | 426 (26.7%) |
| Bachelor's Degree or higher | 707 (86.2%) | 113 (13.8%) |
Occupancy by Age of Householder in Keith County
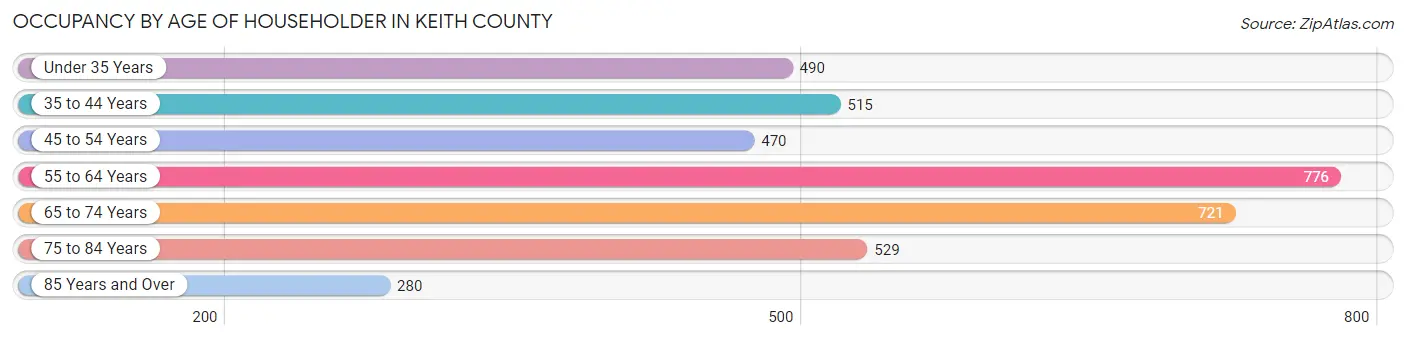
| Age Bracket | # Households | % Households |
| Under 35 Years | 490 | 13.0% |
| 35 to 44 Years | 515 | 13.6% |
| 45 to 54 Years | 470 | 12.4% |
| 55 to 64 Years | 776 | 20.5% |
| 65 to 74 Years | 721 | 19.1% |
| 75 to 84 Years | 529 | 14.0% |
| 85 Years and Over | 280 | 7.4% |
| Total | 3,781 | 100.0% |
Housing Finances in Keith County
Median Income by Occupancy in Keith County
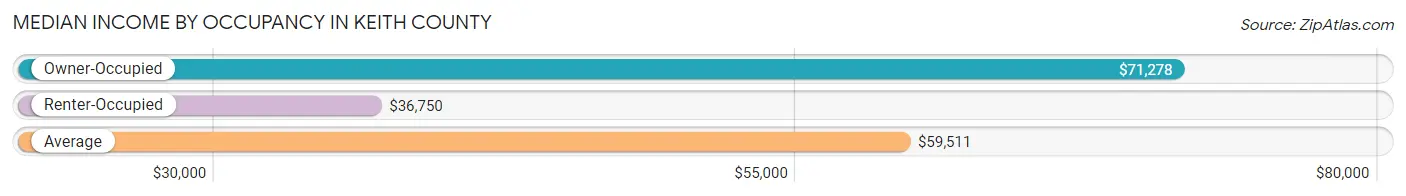
| Occupancy Type | # Households | Median Income |
| Owner-Occupied | 2,797 (74.0%) | $71,278 |
| Renter-Occupied | 984 (26.0%) | $36,750 |
| Average | 3,781 (100.0%) | $59,511 |
Occupancy by Householder Income Bracket in Keith County
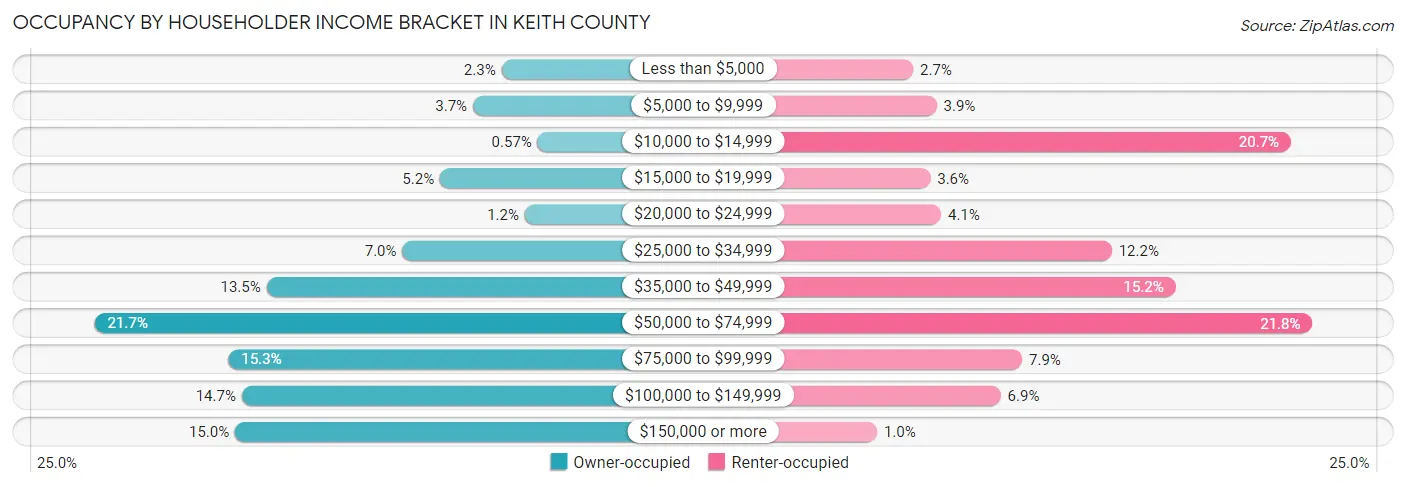
| Income Bracket | Owner-occupied | Renter-occupied |
| Less than $5,000 | 64 (2.3%) | 27 (2.7%) |
| $5,000 to $9,999 | 102 (3.6%) | 38 (3.9%) |
| $10,000 to $14,999 | 16 (0.6%) | 204 (20.7%) |
| $15,000 to $19,999 | 146 (5.2%) | 35 (3.6%) |
| $20,000 to $24,999 | 33 (1.2%) | 40 (4.1%) |
| $25,000 to $34,999 | 196 (7.0%) | 120 (12.2%) |
| $35,000 to $49,999 | 377 (13.5%) | 150 (15.2%) |
| $50,000 to $74,999 | 606 (21.7%) | 214 (21.7%) |
| $75,000 to $99,999 | 428 (15.3%) | 78 (7.9%) |
| $100,000 to $149,999 | 410 (14.7%) | 68 (6.9%) |
| $150,000 or more | 419 (15.0%) | 10 (1.0%) |
| Total | 2,797 (100.0%) | 984 (100.0%) |
Monthly Housing Cost Tiers in Keith County
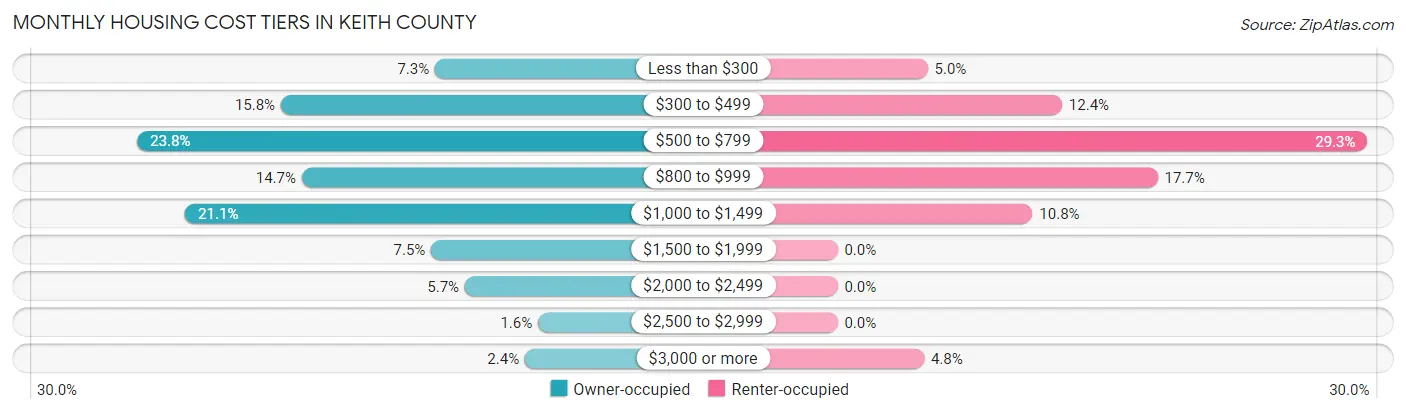
| Monthly Cost | Owner-occupied | Renter-occupied |
| Less than $300 | 205 (7.3%) | 49 (5.0%) |
| $300 to $499 | 443 (15.8%) | 122 (12.4%) |
| $500 to $799 | 665 (23.8%) | 288 (29.3%) |
| $800 to $999 | 411 (14.7%) | 174 (17.7%) |
| $1,000 to $1,499 | 591 (21.1%) | 106 (10.8%) |
| $1,500 to $1,999 | 211 (7.5%) | 0 (0.0%) |
| $2,000 to $2,499 | 159 (5.7%) | 0 (0.0%) |
| $2,500 to $2,999 | 46 (1.6%) | 0 (0.0%) |
| $3,000 or more | 66 (2.4%) | 47 (4.8%) |
| Total | 2,797 (100.0%) | 984 (100.0%) |
Physical Housing Characteristics in Keith County
Housing Structures in Keith County
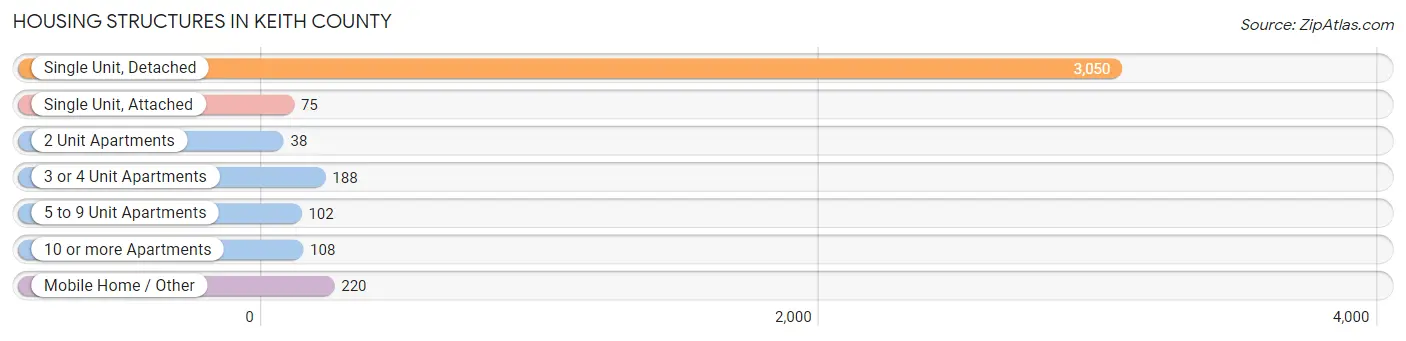
| Structure Type | # Housing Units | % Housing Units |
| Single Unit, Detached | 3,050 | 80.7% |
| Single Unit, Attached | 75 | 2.0% |
| 2 Unit Apartments | 38 | 1.0% |
| 3 or 4 Unit Apartments | 188 | 5.0% |
| 5 to 9 Unit Apartments | 102 | 2.7% |
| 10 or more Apartments | 108 | 2.9% |
| Mobile Home / Other | 220 | 5.8% |
| Total | 3,781 | 100.0% |
Housing Structures by Occupancy in Keith County
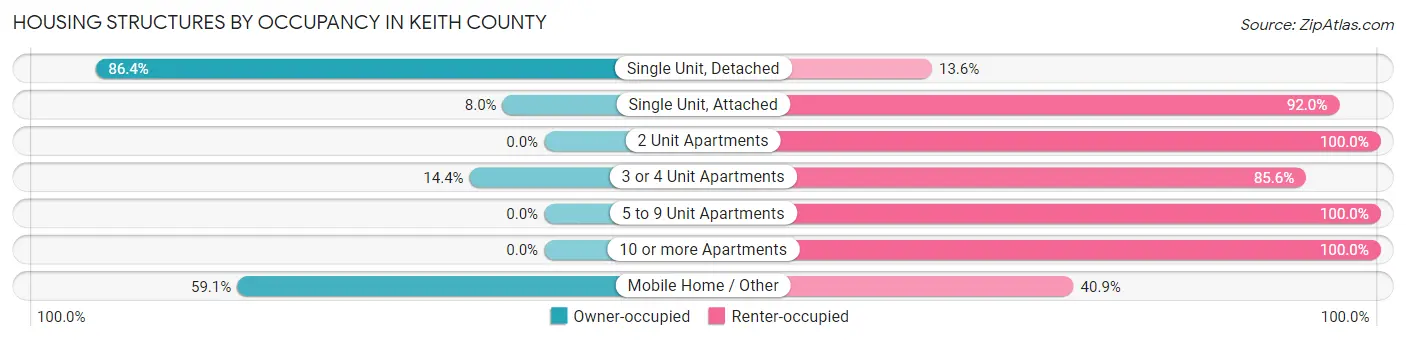
| Structure Type | Owner-occupied | Renter-occupied |
| Single Unit, Detached | 2,634 (86.4%) | 416 (13.6%) |
| Single Unit, Attached | 6 (8.0%) | 69 (92.0%) |
| 2 Unit Apartments | 0 (0.0%) | 38 (100.0%) |
| 3 or 4 Unit Apartments | 27 (14.4%) | 161 (85.6%) |
| 5 to 9 Unit Apartments | 0 (0.0%) | 102 (100.0%) |
| 10 or more Apartments | 0 (0.0%) | 108 (100.0%) |
| Mobile Home / Other | 130 (59.1%) | 90 (40.9%) |
| Total | 2,797 (74.0%) | 984 (26.0%) |
Housing Structures by Number of Rooms in Keith County
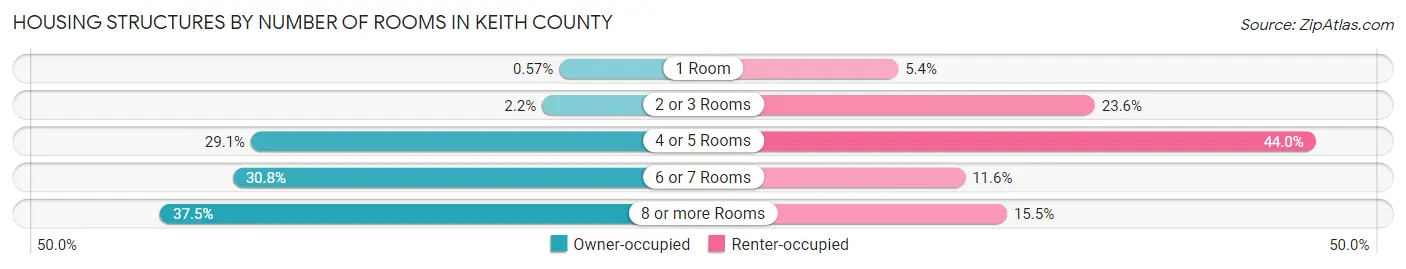
| Number of Rooms | Owner-occupied | Renter-occupied |
| 1 Room | 16 (0.6%) | 53 (5.4%) |
| 2 or 3 Rooms | 60 (2.1%) | 232 (23.6%) |
| 4 or 5 Rooms | 813 (29.1%) | 433 (44.0%) |
| 6 or 7 Rooms | 860 (30.7%) | 114 (11.6%) |
| 8 or more Rooms | 1,048 (37.5%) | 152 (15.4%) |
| Total | 2,797 (100.0%) | 984 (100.0%) |
Housing Structure by Heating Type in Keith County
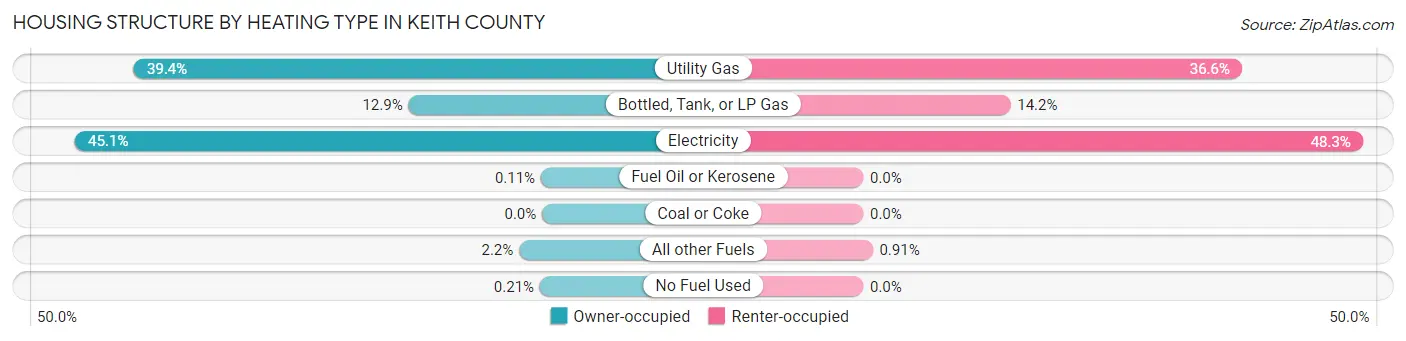
| Heating Type | Owner-occupied | Renter-occupied |
| Utility Gas | 1,103 (39.4%) | 360 (36.6%) |
| Bottled, Tank, or LP Gas | 361 (12.9%) | 140 (14.2%) |
| Electricity | 1,262 (45.1%) | 475 (48.3%) |
| Fuel Oil or Kerosene | 3 (0.1%) | 0 (0.0%) |
| Coal or Coke | 0 (0.0%) | 0 (0.0%) |
| All other Fuels | 62 (2.2%) | 9 (0.9%) |
| No Fuel Used | 6 (0.2%) | 0 (0.0%) |
| Total | 2,797 (100.0%) | 984 (100.0%) |
Household Vehicle Usage in Keith County
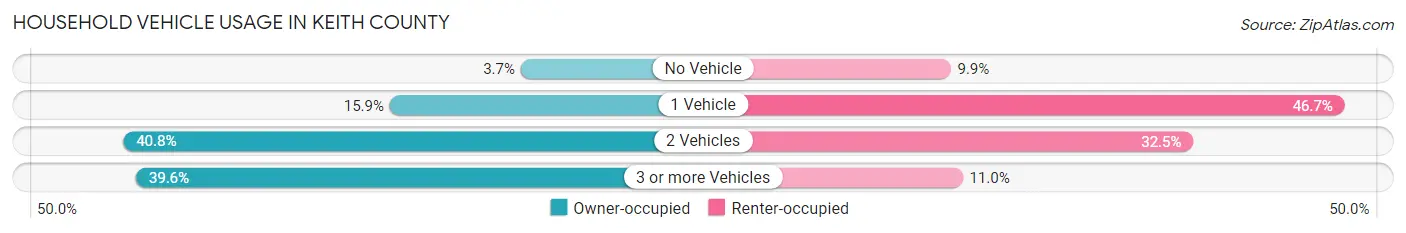
| Vehicles per Household | Owner-occupied | Renter-occupied |
| No Vehicle | 103 (3.7%) | 97 (9.9%) |
| 1 Vehicle | 445 (15.9%) | 459 (46.7%) |
| 2 Vehicles | 1,141 (40.8%) | 320 (32.5%) |
| 3 or more Vehicles | 1,108 (39.6%) | 108 (11.0%) |
| Total | 2,797 (100.0%) | 984 (100.0%) |
Real Estate & Mortgages in Keith County
Real Estate and Mortgage Overview in Keith County
| Characteristic | Without Mortgage | With Mortgage |
| Housing Units | 1,512 | 1,285 |
| Median Property Value | $139,800 | $171,800 |
| Median Household Income | $55,487 | $240 |
| Monthly Housing Costs | $538 | $66 |
| Real Estate Taxes | $2,219 | $5 |
Property Value by Mortgage Status in Keith County
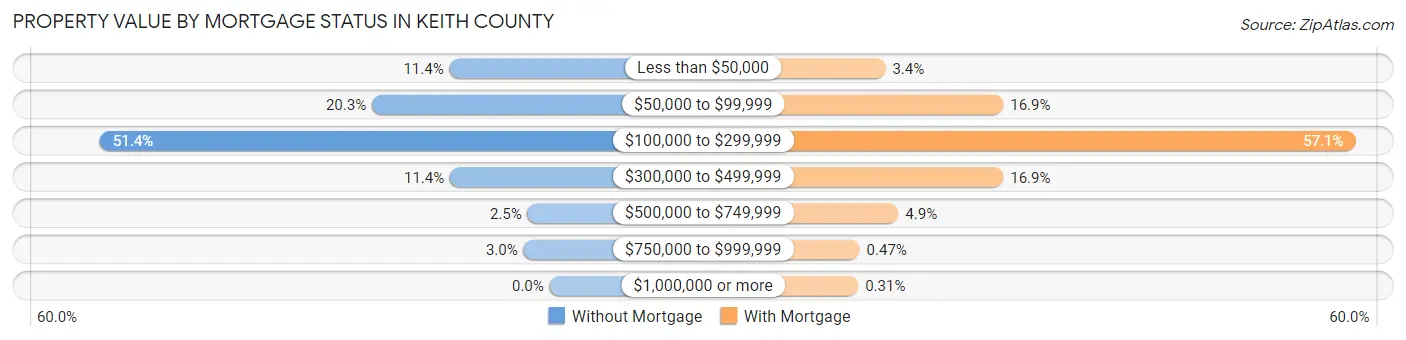
| Property Value | Without Mortgage | With Mortgage |
| Less than $50,000 | 173 (11.4%) | 44 (3.4%) |
| $50,000 to $99,999 | 307 (20.3%) | 217 (16.9%) |
| $100,000 to $299,999 | 777 (51.4%) | 734 (57.1%) |
| $300,000 to $499,999 | 172 (11.4%) | 217 (16.9%) |
| $500,000 to $749,999 | 38 (2.5%) | 63 (4.9%) |
| $750,000 to $999,999 | 45 (3.0%) | 6 (0.5%) |
| $1,000,000 or more | 0 (0.0%) | 4 (0.3%) |
| Total | 1,512 (100.0%) | 1,285 (100.0%) |
Household Income by Mortgage Status in Keith County
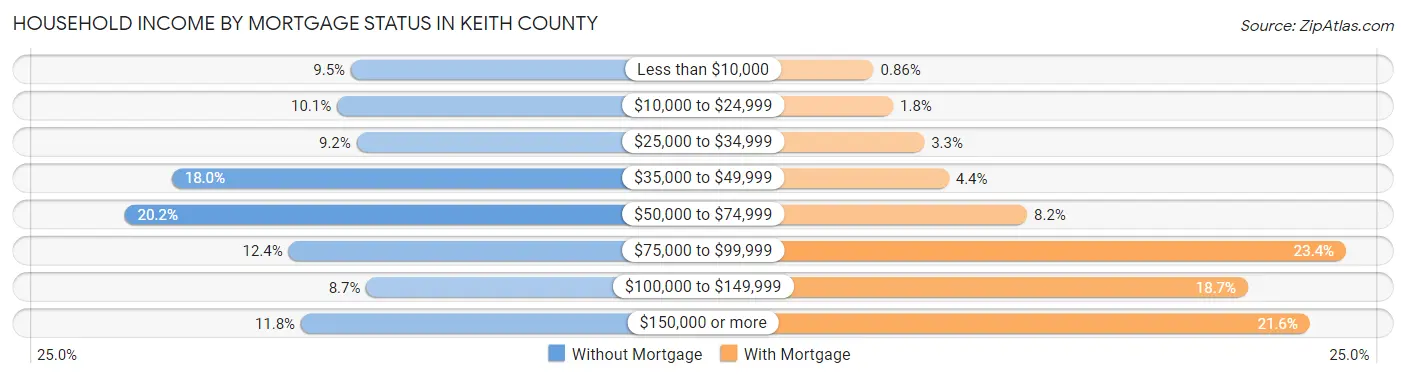
| Household Income | Without Mortgage | With Mortgage |
| Less than $10,000 | 143 (9.5%) | 11 (0.9%) |
| $10,000 to $24,999 | 153 (10.1%) | 23 (1.8%) |
| $25,000 to $34,999 | 139 (9.2%) | 42 (3.3%) |
| $35,000 to $49,999 | 272 (18.0%) | 57 (4.4%) |
| $50,000 to $74,999 | 306 (20.2%) | 105 (8.2%) |
| $75,000 to $99,999 | 188 (12.4%) | 300 (23.4%) |
| $100,000 to $149,999 | 132 (8.7%) | 240 (18.7%) |
| $150,000 or more | 179 (11.8%) | 278 (21.6%) |
| Total | 1,512 (100.0%) | 1,285 (100.0%) |
Property Value to Household Income Ratio in Keith County
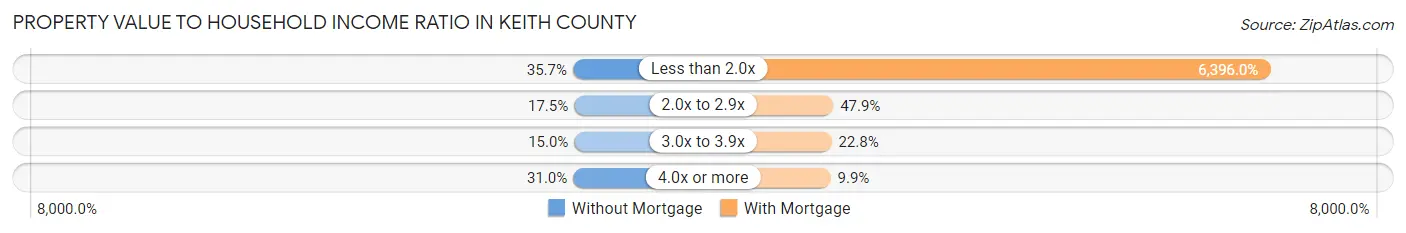
| Value-to-Income Ratio | Without Mortgage | With Mortgage |
| Less than 2.0x | 540 (35.7%) | 82,188 (6,395.9%) |
| 2.0x to 2.9x | 265 (17.5%) | 615 (47.9%) |
| 3.0x to 3.9x | 226 (14.9%) | 293 (22.8%) |
| 4.0x or more | 468 (30.9%) | 127 (9.9%) |
| Total | 1,512 (100.0%) | 1,285 (100.0%) |
Real Estate Taxes by Mortgage Status in Keith County
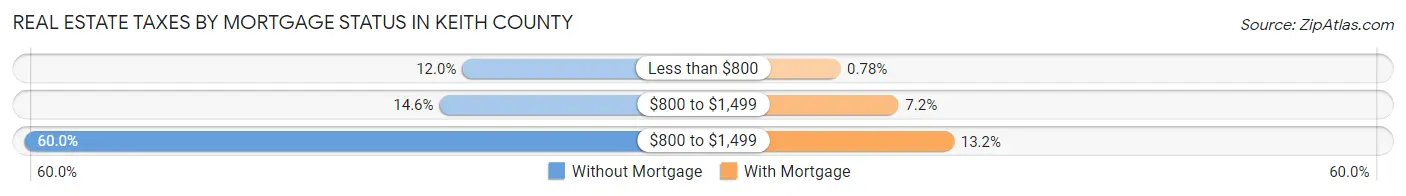
| Property Taxes | Without Mortgage | With Mortgage |
| Less than $800 | 182 (12.0%) | 10 (0.8%) |
| $800 to $1,499 | 220 (14.5%) | 92 (7.2%) |
| $800 to $1,499 | 907 (60.0%) | 170 (13.2%) |
| Total | 1,512 (100.0%) | 1,285 (100.0%) |
Health & Disability in Keith County
Health Insurance Coverage by Age in Keith County
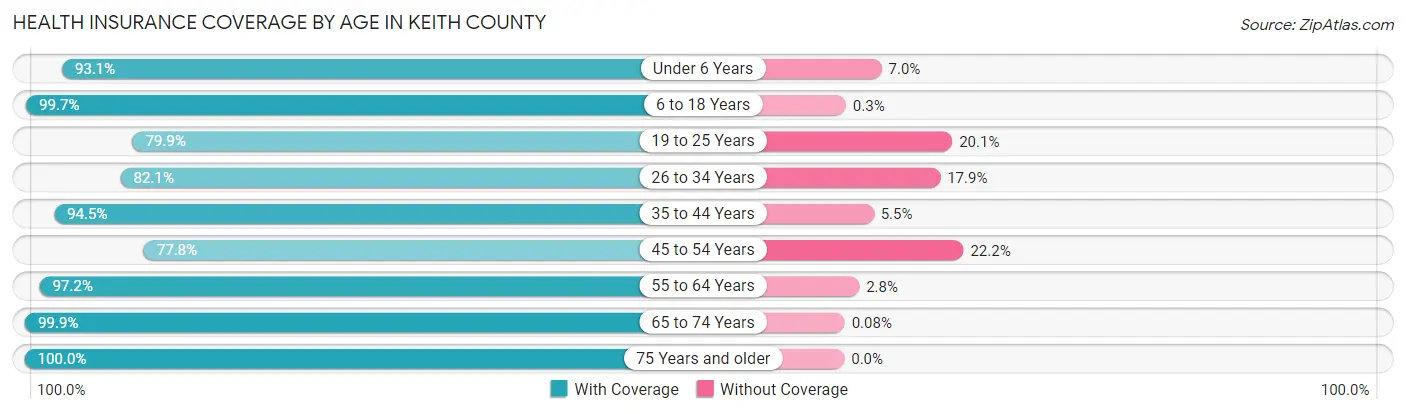
| Age Bracket | With Coverage | Without Coverage |
| Under 6 Years | 442 (93.0%) | 33 (7.0%) |
| 6 to 18 Years | 1,332 (99.7%) | 4 (0.3%) |
| 19 to 25 Years | 361 (79.9%) | 91 (20.1%) |
| 26 to 34 Years | 546 (82.1%) | 119 (17.9%) |
| 35 to 44 Years | 827 (94.5%) | 48 (5.5%) |
| 45 to 54 Years | 738 (77.8%) | 211 (22.2%) |
| 55 to 64 Years | 1,222 (97.2%) | 35 (2.8%) |
| 65 to 74 Years | 1,180 (99.9%) | 1 (0.1%) |
| 75 Years and older | 1,044 (100.0%) | 0 (0.0%) |
| Total | 7,692 (93.4%) | 542 (6.6%) |
Health Insurance Coverage by Citizenship Status in Keith County
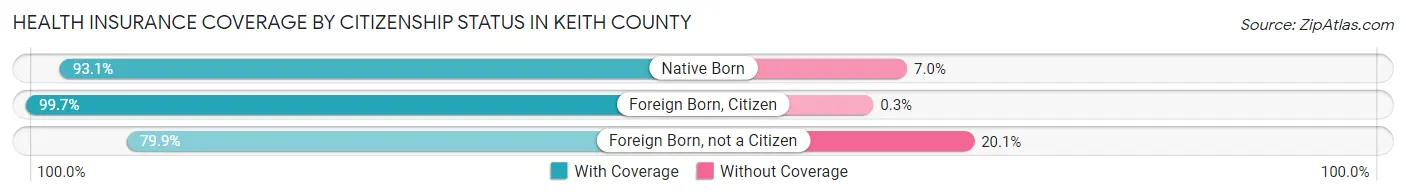
| Citizenship Status | With Coverage | Without Coverage |
| Native Born | 442 (93.0%) | 33 (7.0%) |
| Foreign Born, Citizen | 1,332 (99.7%) | 4 (0.3%) |
| Foreign Born, not a Citizen | 361 (79.9%) | 91 (20.1%) |
Health Insurance Coverage by Household Income in Keith County
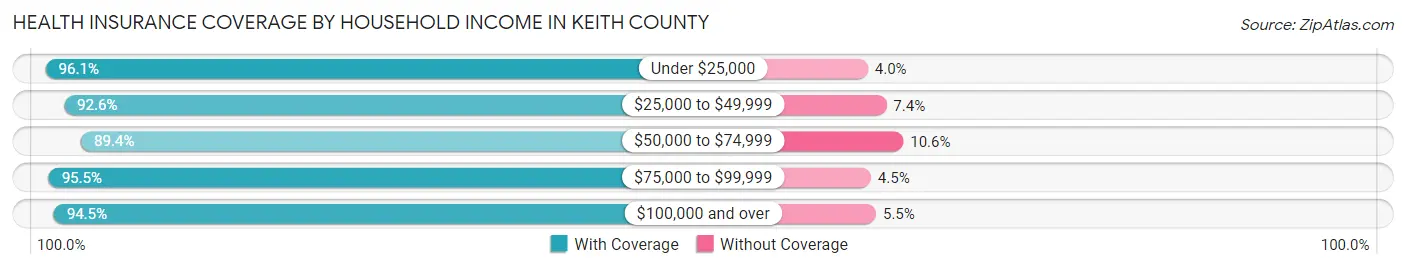
| Household Income | With Coverage | Without Coverage |
| Under $25,000 | 875 (96.1%) | 36 (4.0%) |
| $25,000 to $49,999 | 1,459 (92.6%) | 117 (7.4%) |
| $50,000 to $74,999 | 1,503 (89.4%) | 178 (10.6%) |
| $75,000 to $99,999 | 1,373 (95.5%) | 65 (4.5%) |
| $100,000 and over | 2,468 (94.5%) | 143 (5.5%) |
Public vs Private Health Insurance Coverage by Age in Keith County
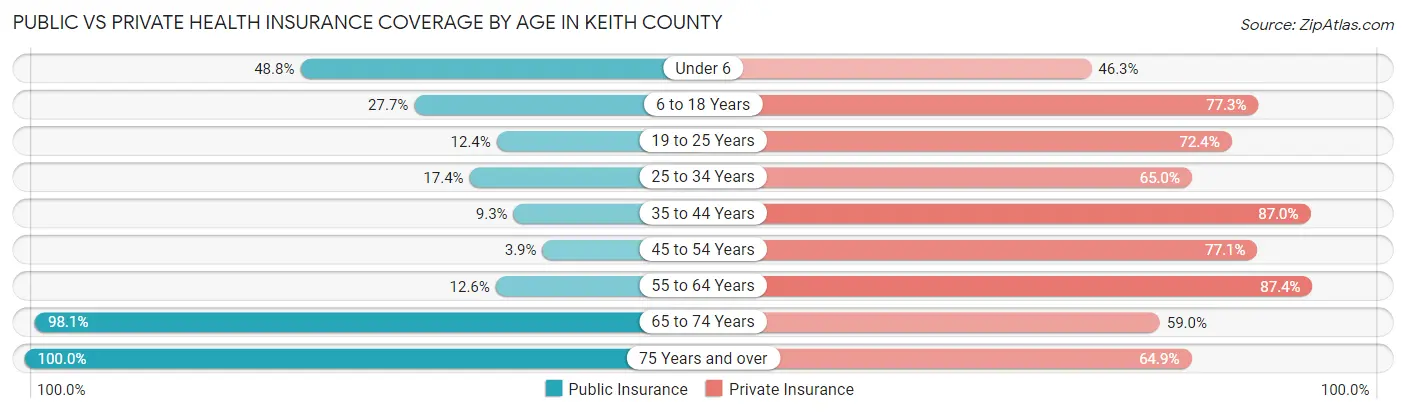
| Age Bracket | Public Insurance | Private Insurance |
| Under 6 | 232 (48.8%) | 220 (46.3%) |
| 6 to 18 Years | 370 (27.7%) | 1,033 (77.3%) |
| 19 to 25 Years | 56 (12.4%) | 327 (72.4%) |
| 25 to 34 Years | 116 (17.4%) | 432 (65.0%) |
| 35 to 44 Years | 81 (9.3%) | 761 (87.0%) |
| 45 to 54 Years | 37 (3.9%) | 732 (77.1%) |
| 55 to 64 Years | 158 (12.6%) | 1,098 (87.4%) |
| 65 to 74 Years | 1,158 (98.1%) | 697 (59.0%) |
| 75 Years and over | 1,044 (100.0%) | 677 (64.8%) |
| Total | 3,252 (39.5%) | 5,977 (72.6%) |
Disability Status by Sex by Age in Keith County
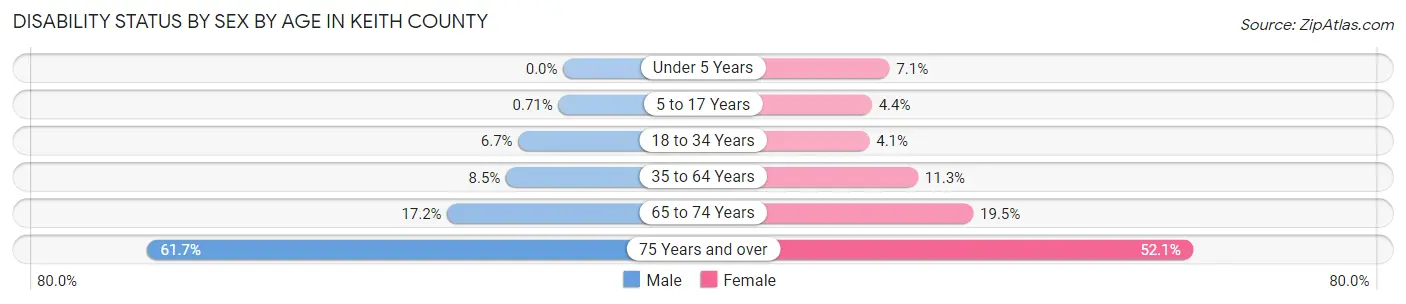
| Age Bracket | Male | Female |
| Under 5 Years | 0 (0.0%) | 14 (7.1%) |
| 5 to 17 Years | 5 (0.7%) | 26 (4.4%) |
| 18 to 34 Years | 42 (6.7%) | 25 (4.1%) |
| 35 to 64 Years | 139 (8.5%) | 163 (11.3%) |
| 65 to 74 Years | 100 (17.2%) | 117 (19.5%) |
| 75 Years and over | 271 (61.7%) | 315 (52.1%) |
Disability Class by Sex by Age in Keith County
Disability Class: Hearing Difficulty
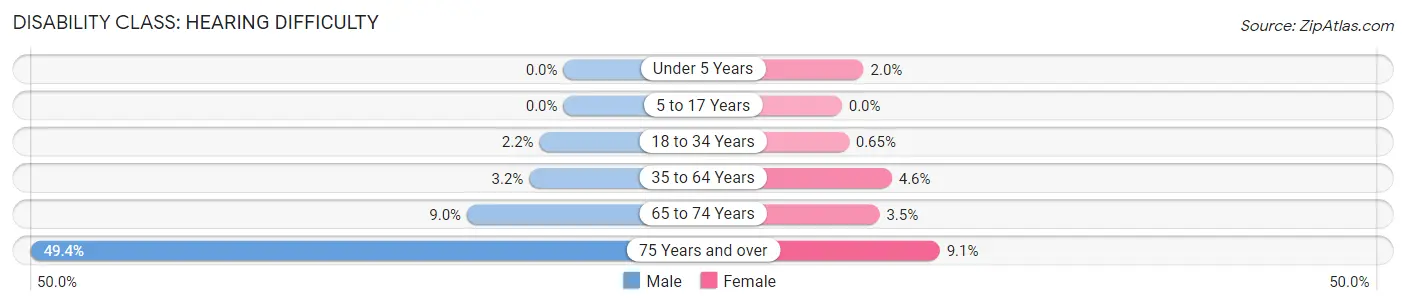
| Age Bracket | Male | Female |
| Under 5 Years | 0 (0.0%) | 4 (2.0%) |
| 5 to 17 Years | 0 (0.0%) | 0 (0.0%) |
| 18 to 34 Years | 14 (2.2%) | 4 (0.6%) |
| 35 to 64 Years | 52 (3.2%) | 67 (4.6%) |
| 65 to 74 Years | 52 (8.9%) | 21 (3.5%) |
| 75 Years and over | 217 (49.4%) | 55 (9.1%) |
Disability Class: Vision Difficulty
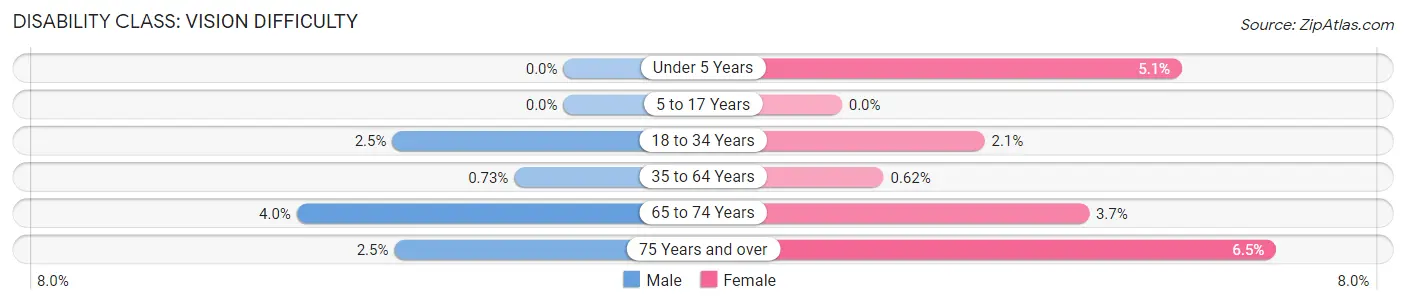
| Age Bracket | Male | Female |
| Under 5 Years | 0 (0.0%) | 10 (5.1%) |
| 5 to 17 Years | 0 (0.0%) | 0 (0.0%) |
| 18 to 34 Years | 16 (2.5%) | 13 (2.1%) |
| 35 to 64 Years | 12 (0.7%) | 9 (0.6%) |
| 65 to 74 Years | 23 (4.0%) | 22 (3.7%) |
| 75 Years and over | 11 (2.5%) | 39 (6.5%) |
Disability Class: Cognitive Difficulty
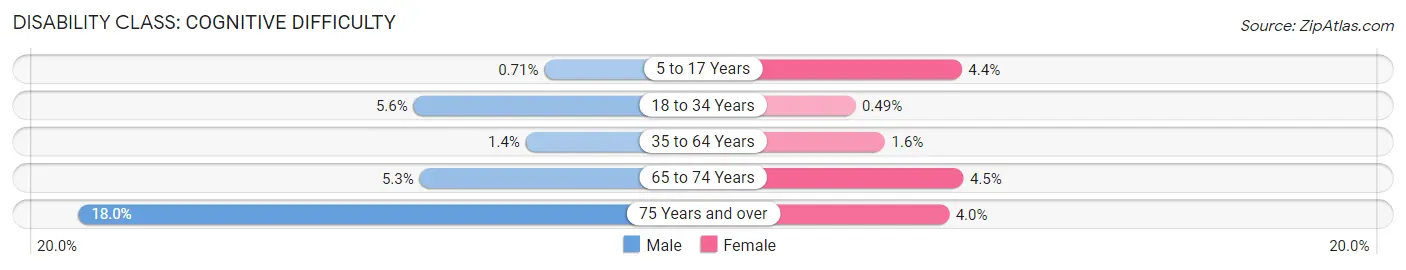
| Age Bracket | Male | Female |
| 5 to 17 Years | 5 (0.7%) | 26 (4.4%) |
| 18 to 34 Years | 35 (5.6%) | 3 (0.5%) |
| 35 to 64 Years | 23 (1.4%) | 23 (1.6%) |
| 65 to 74 Years | 31 (5.3%) | 27 (4.5%) |
| 75 Years and over | 79 (18.0%) | 24 (4.0%) |
Disability Class: Ambulatory Difficulty
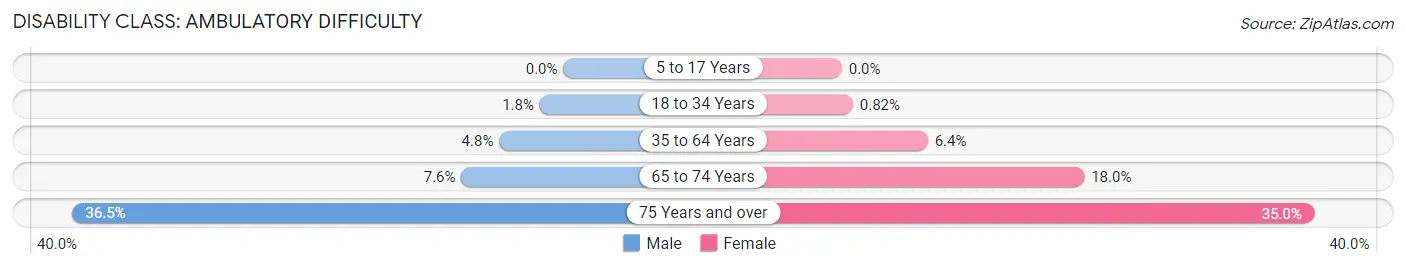
| Age Bracket | Male | Female |
| 5 to 17 Years | 0 (0.0%) | 0 (0.0%) |
| 18 to 34 Years | 11 (1.8%) | 5 (0.8%) |
| 35 to 64 Years | 78 (4.8%) | 92 (6.4%) |
| 65 to 74 Years | 44 (7.6%) | 108 (18.0%) |
| 75 Years and over | 160 (36.4%) | 212 (35.0%) |
Disability Class: Self-Care Difficulty
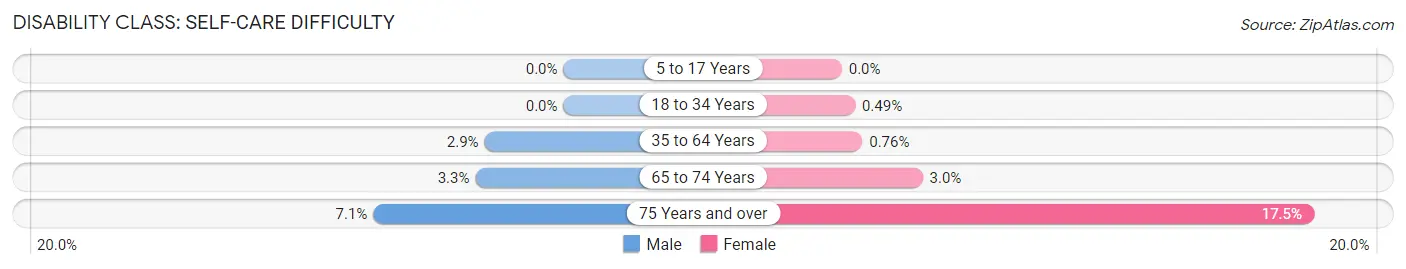
| Age Bracket | Male | Female |
| 5 to 17 Years | 0 (0.0%) | 0 (0.0%) |
| 18 to 34 Years | 0 (0.0%) | 3 (0.5%) |
| 35 to 64 Years | 48 (2.9%) | 11 (0.8%) |
| 65 to 74 Years | 19 (3.3%) | 18 (3.0%) |
| 75 Years and over | 31 (7.1%) | 106 (17.5%) |
Technology Access in Keith County
Computing Device Access in Keith County
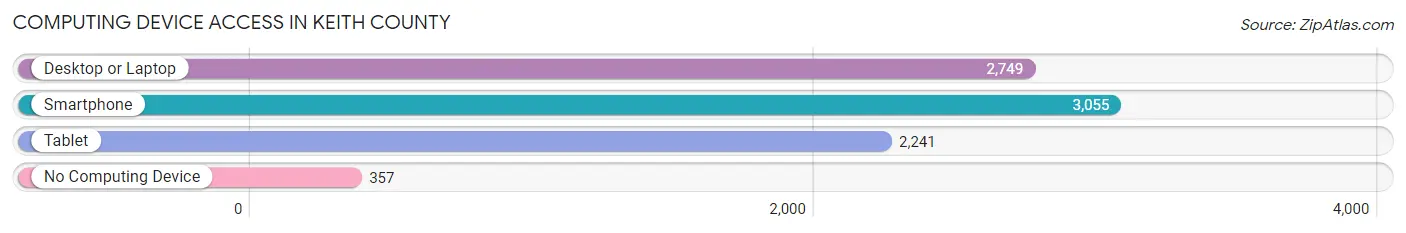
| Device Type | # Households | % Households |
| Desktop or Laptop | 2,749 | 72.7% |
| Smartphone | 3,055 | 80.8% |
| Tablet | 2,241 | 59.3% |
| No Computing Device | 357 | 9.4% |
| Total | 3,781 | 100.0% |
Internet Access in Keith County
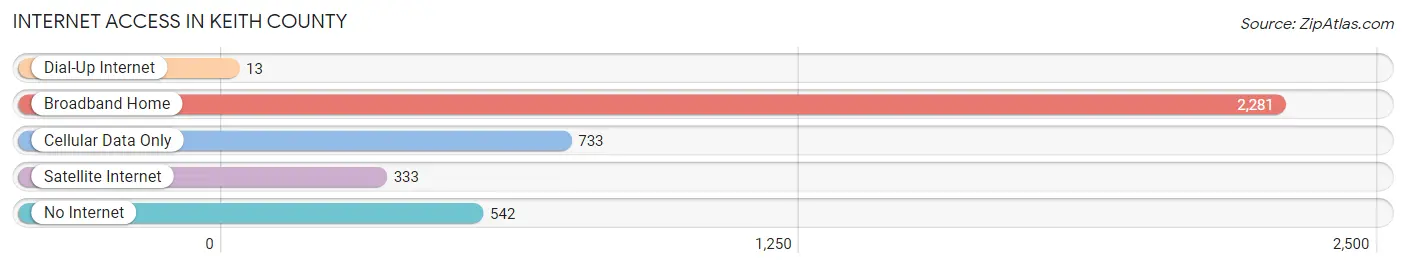
| Internet Type | # Households | % Households |
| Dial-Up Internet | 13 | 0.3% |
| Broadband Home | 2,281 | 60.3% |
| Cellular Data Only | 733 | 19.4% |
| Satellite Internet | 333 | 8.8% |
| No Internet | 542 | 14.3% |
| Total | 3,781 | 100.0% |
Keith County Summary
History
Keith County is located in the western part of Nebraska and is part of the Nebraska Panhandle. The county was established in 1873 and was named after the first governor of Nebraska, Alvin Saunders Keith. The county was originally inhabited by Native American tribes, including the Sioux, Cheyenne, Arapaho, and Pawnee.
The first settlers in Keith County arrived in the late 1870s and early 1880s. These settlers were mostly farmers and ranchers who were attracted to the area by the fertile soil and abundant water sources. The county was officially organized in 1884 and the first county seat was located in Ogallala.
Geography
Keith County is located in the western part of Nebraska and is part of the Nebraska Panhandle. The county covers an area of 1,845 square miles and is bordered by Garden County to the north, Lincoln County to the east, Cheyenne County to the south, and Deuel County to the west.
The county is mostly flat with some rolling hills and is located in the High Plains region of the Great Plains. The county is drained by the North Platte River and its tributaries, including the South Platte River, Frenchman Creek, and the North Loup River.
The county has a semi-arid climate with hot summers and cold winters. The average annual precipitation is around 17 inches.
Economy
The economy of Keith County is largely based on agriculture and ranching. The county is home to a large number of cattle ranches and farms that produce a variety of crops, including corn, wheat, sorghum, and hay.
The county is also home to several oil and gas fields, which provide jobs and revenue for the county. The county is also home to several manufacturing companies, including a concrete plant, a plastics plant, and a metal fabrication plant.
Demographics
As of the 2010 census, the population of Keith County was 8,368. The population is spread out with a median age of 38.7 years. The racial makeup of the county is 94.2% White, 0.7% African American, 0.7% Native American, 0.3% Asian, 0.1% Pacific Islander, 2.2% from other races, and 1.9% from two or more races.
The largest ancestry groups in the county are German (25.2%), Irish (17.2%), English (14.2%), and Czech (7.2%). The median household income in the county is $45,945 and the median family income is $54,844. The per capita income in the county is $22,845.
Common Questions
What is Per Capita Income in Keith County?
Per Capita income in Keith County is $34,905.
What is the Median Family Income in Keith County?
Median Family Income in Keith County is $76,777.
What is the Median Household income in Keith County?
Median Household Income in Keith County is $59,511.
What is Income or Wage Gap in Keith County?
Income or Wage Gap in Keith County is 43.1%.
Women in Keith County earn 56.9 cents for every dollar earned by a man.
What is Family Income Deficit in Keith County?
Family Income Deficit in Keith County is $8,535.
Families that are below poverty line in Keith County earn $8,535 less on average than the poverty threshold level.
What is Inequality or Gini Index in Keith County?
Inequality or Gini Index in Keith County is 0.43.
What is the Total Population of Keith County?
Total Population of Keith County is 8,303.
What is the Total Male Population of Keith County?
Total Male Population of Keith County is 4,218.
What is the Total Female Population of Keith County?
Total Female Population of Keith County is 4,085.
What is the Ratio of Males per 100 Females in Keith County?
There are 103.26 Males per 100 Females in Keith County.
What is the Ratio of Females per 100 Males in Keith County?
There are 96.85 Females per 100 Males in Keith County.
What is the Median Population Age in Keith County?
Median Population Age in Keith County is 49.1 Years.
What is the Average Family Size in Keith County
Average Family Size in Keith County is 2.8 People.
What is the Average Household Size in Keith County
Average Household Size in Keith County is 2.2 People.
How Large is the Labor Force in Keith County?
There are 4,167 People in the Labor Forcein in Keith County.
What is the Percentage of People in the Labor Force in Keith County?
60.9% of People are in the Labor Force in Keith County.
What is the Unemployment Rate in Keith County?
Unemployment Rate in Keith County is 2.6%.