Zip Codes with the Most Immigrants from Eastern Asia in Pascagoula, MS
RELATED REPORTS & OPTIONS
Eastern Asia
Pascagoula
Compare Zip Codes
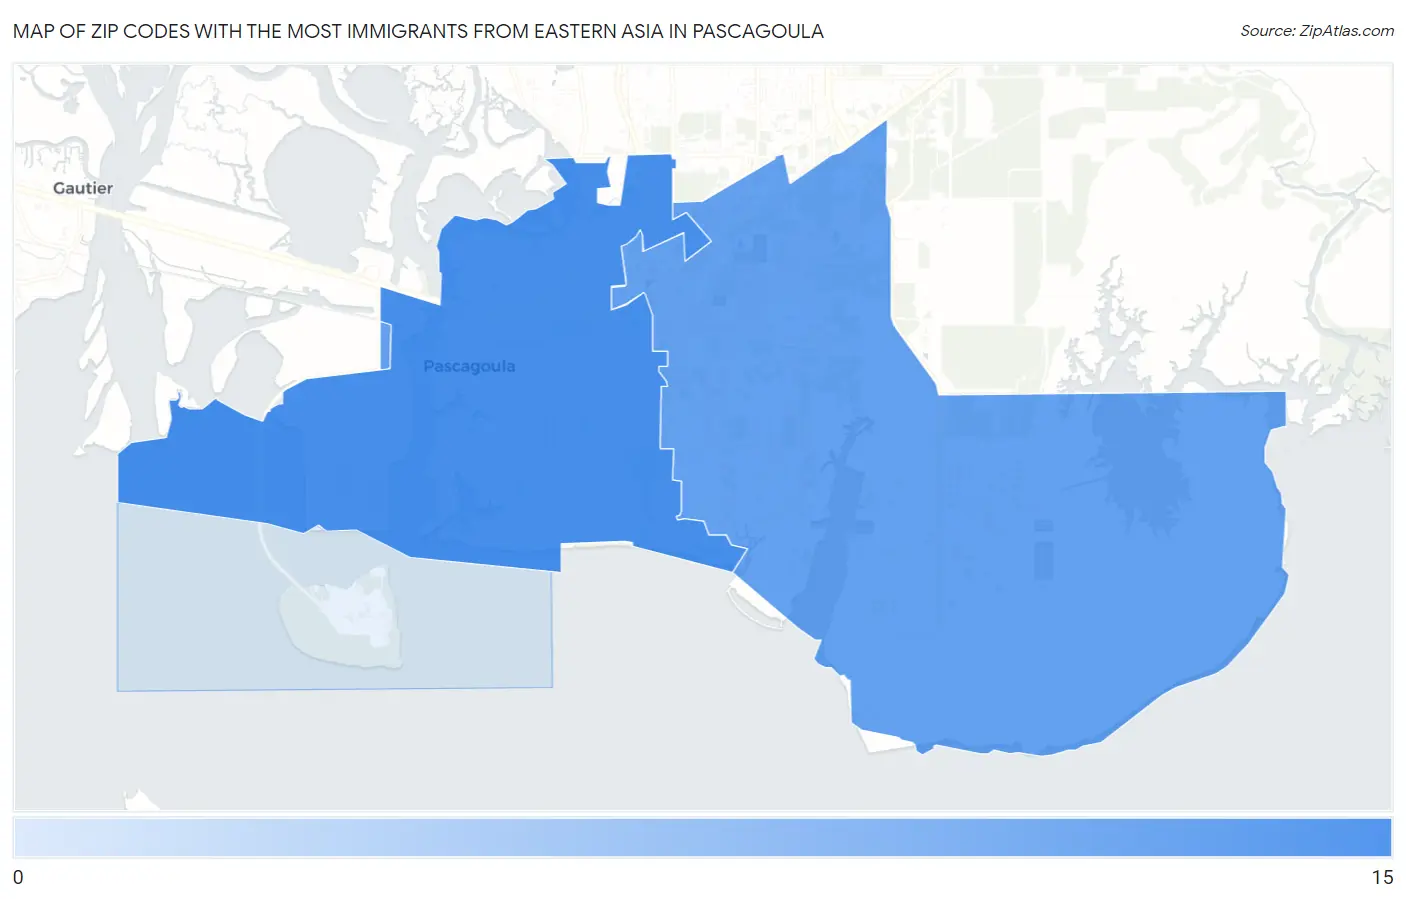
Map of Zip Codes with the Most Immigrants from Eastern Asia in Pascagoula
8
14
Zip Codes with the Most Immigrants from Eastern Asia in Pascagoula, MS
| Zip Code | Eastern Asia | vs State | vs National | |
| 1. | 39567 | 14 | 5,056(0.28%)#53 | 4,223,726(0.00%)#10,390 |
| 2. | 39581 | 8 | 5,056(0.16%)#69 | 4,223,726(0.00%)#11,526 |
1
Common Questions
What are the Top Zip Codes with the Most Immigrants from Eastern Asia in Pascagoula, MS?
Top Zip Codes with the Most Immigrants from Eastern Asia in Pascagoula, MS are:
What zip code has the Most Immigrants from Eastern Asia in Pascagoula, MS?
39567 has the Most Immigrants from Eastern Asia in Pascagoula, MS with 14.
What is the Total Immigrants from Eastern Asia in Pascagoula, MS?
Total Immigrants from Eastern Asia in Pascagoula is 22.
What is the Total Immigrants from Eastern Asia in Mississippi?
Total Immigrants from Eastern Asia in Mississippi is 5,056.
What is the Total Immigrants from Eastern Asia in the United States?
Total Immigrants from Eastern Asia in the United States is 4,223,726.