Zip Codes with the Highest Percentage of Population with a Degree in Liberal Arts and History in Pascagoula, MS
RELATED REPORTS & OPTIONS
Liberal Arts and History
Pascagoula
Compare Zip Codes
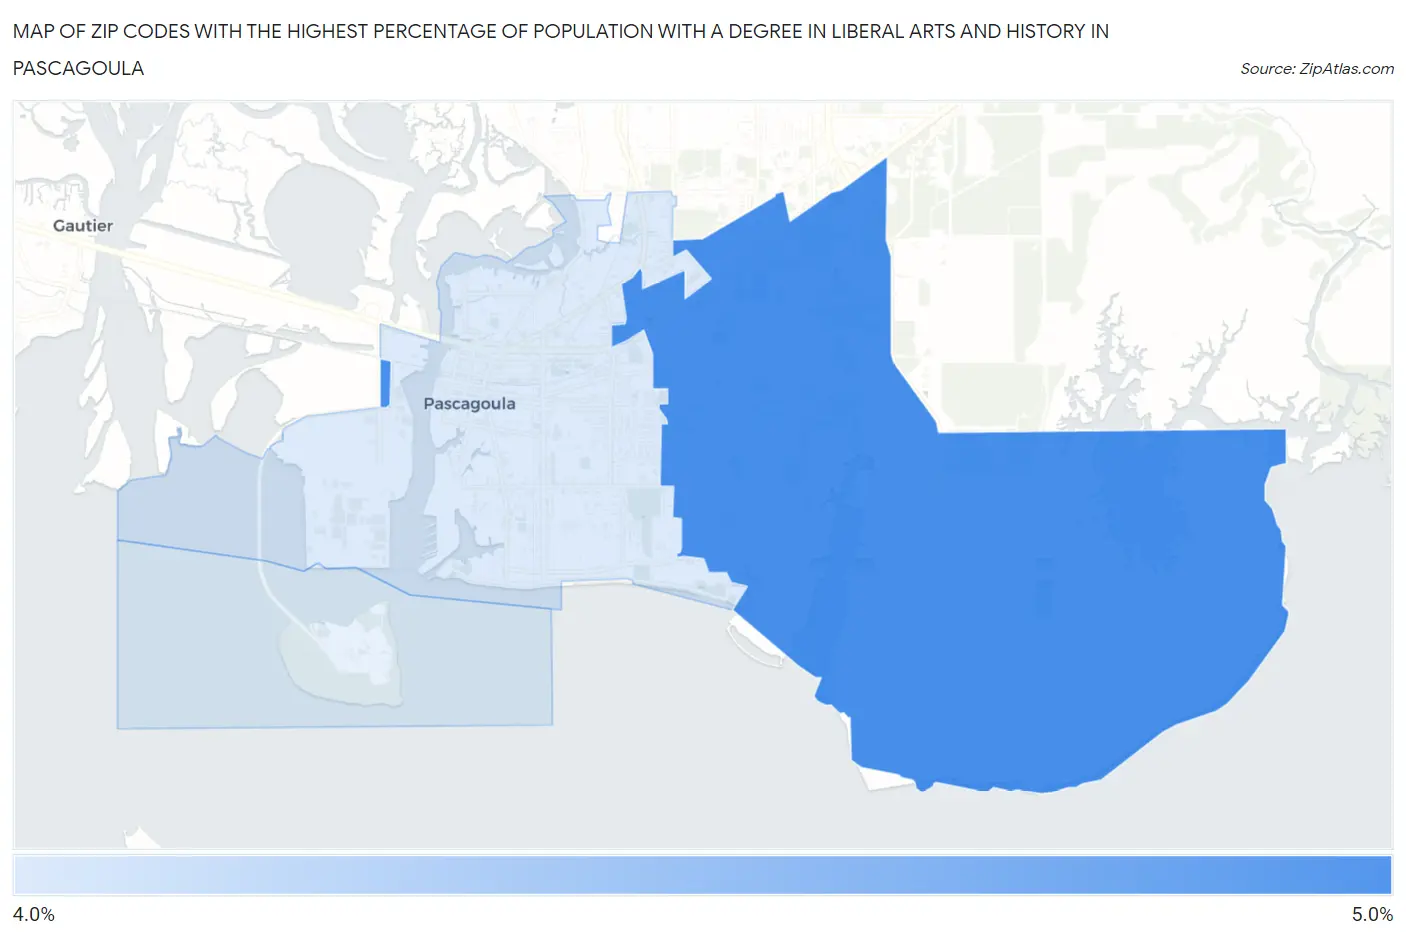
Map of Zip Codes with the Highest Percentage of Population with a Degree in Liberal Arts and History in Pascagoula
4.3%
4.8%
Zip Codes with the Highest Percentage of Population with a Degree in Liberal Arts and History in Pascagoula, MS
| Zip Code | % Graduates | vs State | vs National | |
| 1. | 39581 | 4.8% | 4.2%(+0.655)#111 | 4.9%(-0.062)#11,944 |
| 2. | 39567 | 4.3% | 4.2%(+0.157)#127 | 4.9%(-0.559)#13,598 |
1
Common Questions
What are the Top Zip Codes with the Highest Percentage of Population with a Degree in Liberal Arts and History in Pascagoula, MS?
Top Zip Codes with the Highest Percentage of Population with a Degree in Liberal Arts and History in Pascagoula, MS are:
What zip code has the Highest Percentage of Population with a Degree in Liberal Arts and History in Pascagoula, MS?
39581 has the Highest Percentage of Population with a Degree in Liberal Arts and History in Pascagoula, MS with 4.8%.
What is the Percentage of Population with a Degree in Liberal Arts and History in Pascagoula, MS?
Percentage of Population with a Degree in Liberal Arts and History in Pascagoula is 4.5%.
What is the Percentage of Population with a Degree in Liberal Arts and History in Mississippi?
Percentage of Population with a Degree in Liberal Arts and History in Mississippi is 4.2%.
What is the Percentage of Population with a Degree in Liberal Arts and History in the United States?
Percentage of Population with a Degree in Liberal Arts and History in the United States is 4.9%.