Zip Codes with the Highest Percentage of Population Employed in Legal Services & Support in Northville, MI
RELATED REPORTS & OPTIONS
Legal Services & Support
Northville
Compare Zip Codes
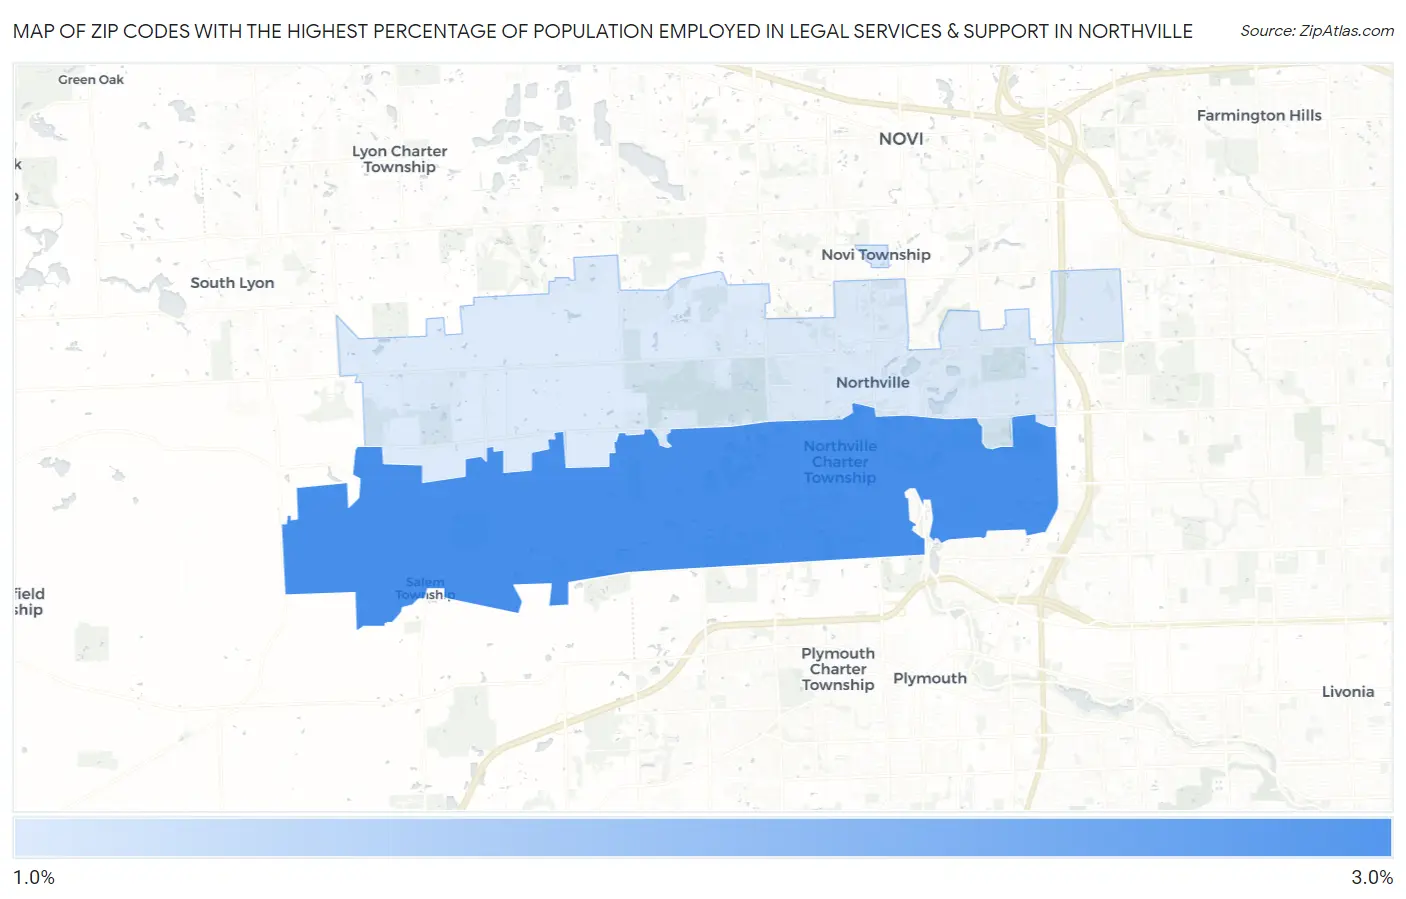
Map of Zip Codes with the Highest Percentage of Population Employed in Legal Services & Support in Northville
1.4%
2.9%
Zip Codes with the Highest Percentage of Population Employed in Legal Services & Support in Northville, MI
| Zip Code | % Employed | vs State | vs National | |
| 1. | 48168 | 2.9% | 0.89%(+2.00)#21 | 1.2%(+1.71)#1,983 |
| 2. | 48167 | 1.4% | 0.89%(+0.526)#117 | 1.2%(+0.228)#5,417 |
1
Common Questions
What are the Top Zip Codes with the Highest Percentage of Population Employed in Legal Services & Support in Northville, MI?
Top Zip Codes with the Highest Percentage of Population Employed in Legal Services & Support in Northville, MI are:
What zip code has the Highest Percentage of Population Employed in Legal Services & Support in Northville, MI?
48168 has the Highest Percentage of Population Employed in Legal Services & Support in Northville, MI with 2.9%.
What is the Percentage of Population Employed in Legal Services & Support in Northville, MI?
Percentage of Population Employed in Legal Services & Support in Northville is 1.6%.
What is the Percentage of Population Employed in Legal Services & Support in Michigan?
Percentage of Population Employed in Legal Services & Support in Michigan is 0.89%.
What is the Percentage of Population Employed in Legal Services & Support in the United States?
Percentage of Population Employed in Legal Services & Support in the United States is 1.2%.