Zip Codes with the Highest Percentage of Population Employed in Legal Services & Support in Brighton, MI
RELATED REPORTS & OPTIONS
Legal Services & Support
Brighton
Compare Zip Codes
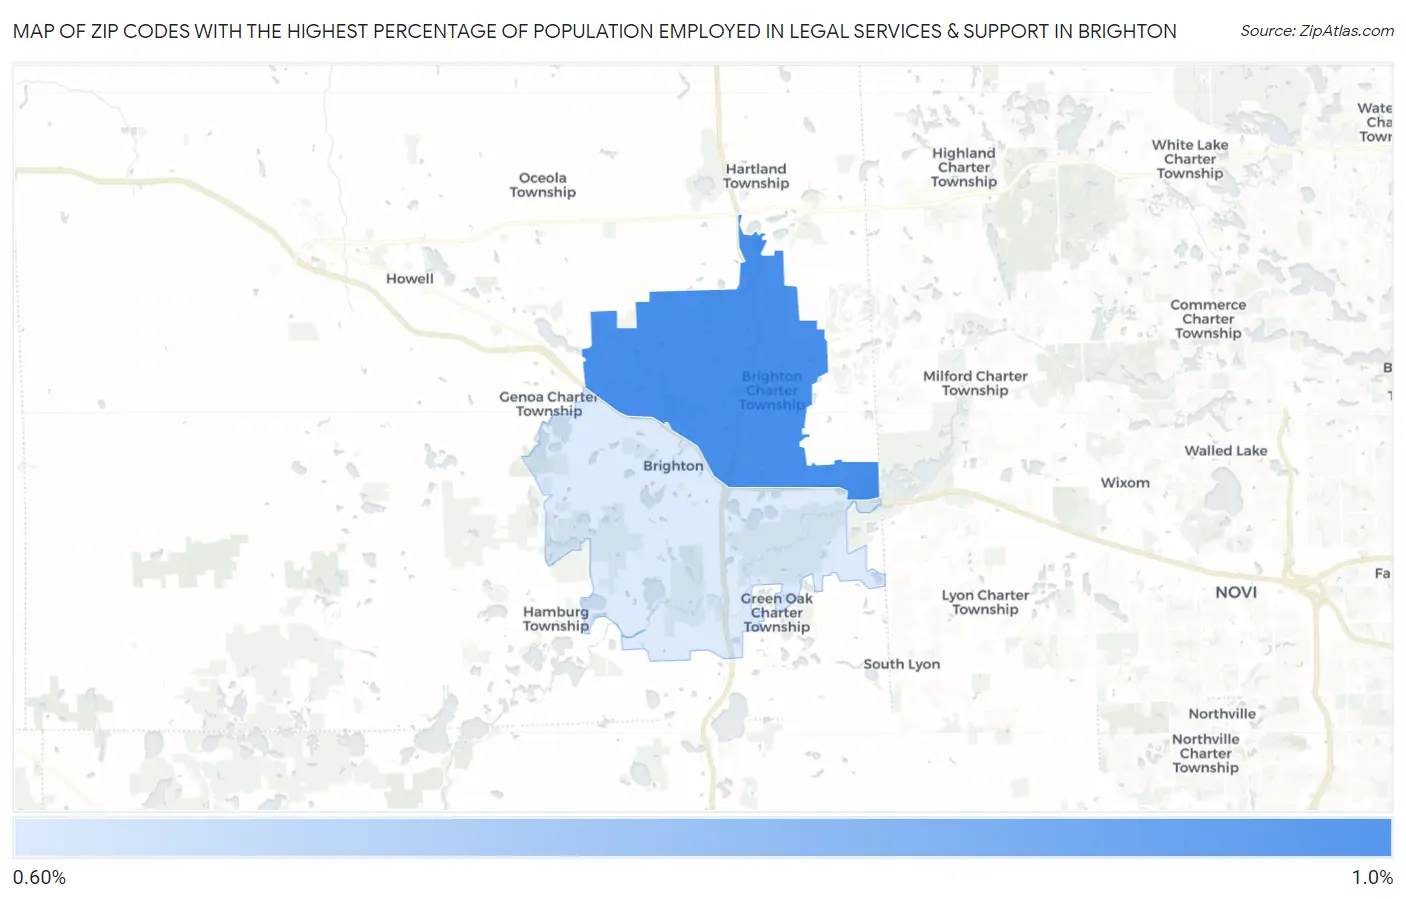
Map of Zip Codes with the Highest Percentage of Population Employed in Legal Services & Support in Brighton
0.64%
0.80%
Zip Codes with the Highest Percentage of Population Employed in Legal Services & Support in Brighton, MI
| Zip Code | % Employed | vs State | vs National | |
| 1. | 48114 | 0.80% | 0.89%(-0.082)#253 | 1.2%(-0.380)#9,399 |
| 2. | 48116 | 0.64% | 0.89%(-0.250)#323 | 1.2%(-0.548)#11,067 |
1
Common Questions
What are the Top Zip Codes with the Highest Percentage of Population Employed in Legal Services & Support in Brighton, MI?
Top Zip Codes with the Highest Percentage of Population Employed in Legal Services & Support in Brighton, MI are:
What zip code has the Highest Percentage of Population Employed in Legal Services & Support in Brighton, MI?
48114 has the Highest Percentage of Population Employed in Legal Services & Support in Brighton, MI with 0.80%.
What is the Percentage of Population Employed in Legal Services & Support in Brighton, MI?
Percentage of Population Employed in Legal Services & Support in Brighton is 0.60%.
What is the Percentage of Population Employed in Legal Services & Support in Michigan?
Percentage of Population Employed in Legal Services & Support in Michigan is 0.89%.
What is the Percentage of Population Employed in Legal Services & Support in the United States?
Percentage of Population Employed in Legal Services & Support in the United States is 1.2%.