Immigrants from Eritrea vs Taiwanese Wage/Income Gap
COMPARE
Immigrants from Eritrea
Taiwanese
Wage/Income Gap
Wage/Income Gap Comparison
Immigrants from Eritrea
Taiwanese
21.4%
WAGE/INCOME GAP
100.0/ 100
METRIC RATING
44th/ 347
METRIC RANK
25.1%
WAGE/INCOME GAP
81.6/ 100
METRIC RATING
151st/ 347
METRIC RANK
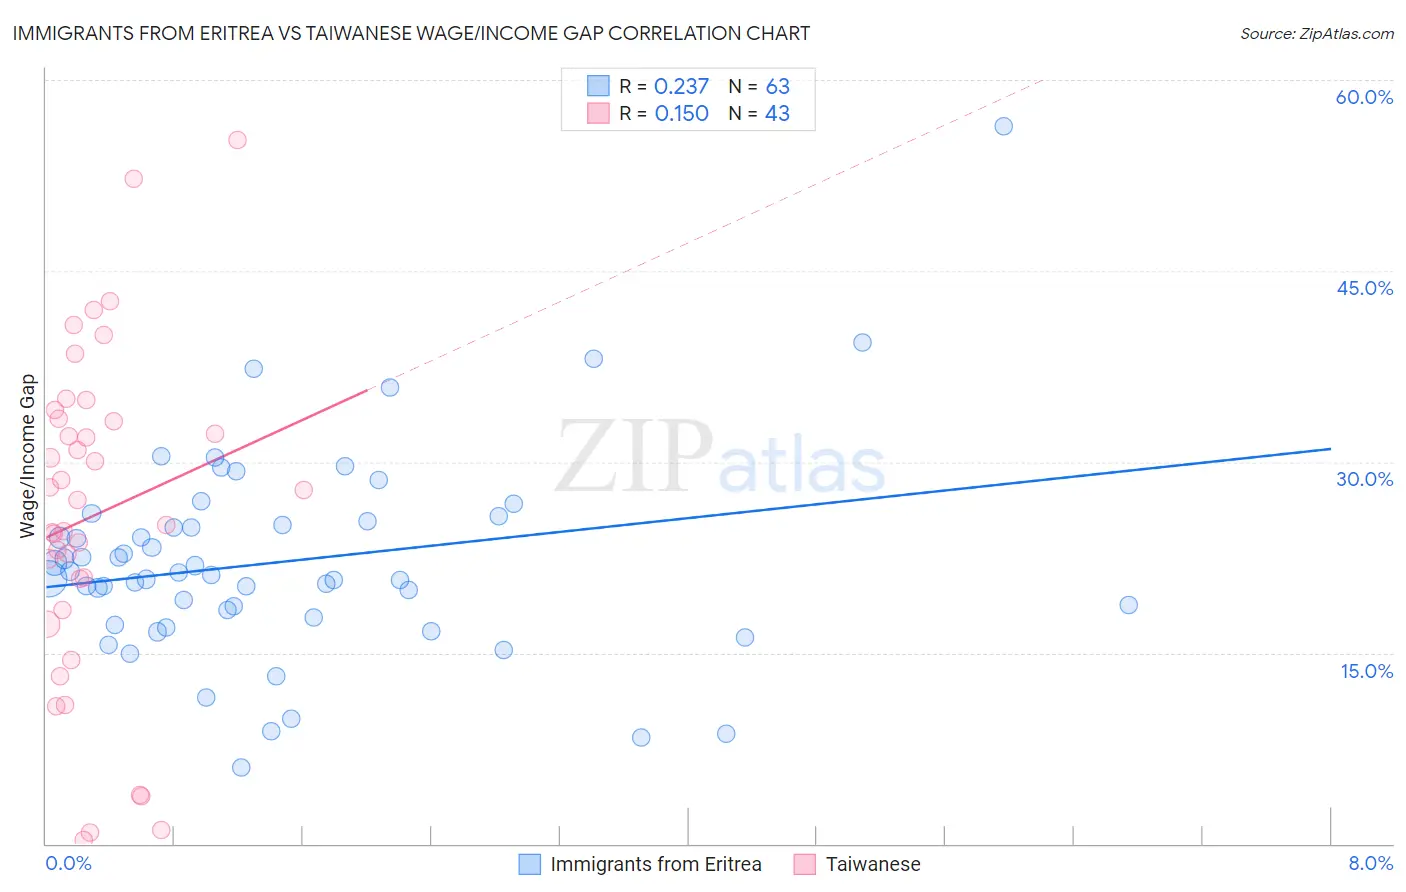
Immigrants from Eritrea vs Taiwanese Wage/Income Gap Correlation Chart
The statistical analysis conducted on geographies consisting of 104,849,653 people shows a weak positive correlation between the proportion of Immigrants from Eritrea and wage/income gap percentage in the United States with a correlation coefficient (R) of 0.237 and weighted average of 21.4%. Similarly, the statistical analysis conducted on geographies consisting of 31,719,634 people shows a poor positive correlation between the proportion of Taiwanese and wage/income gap percentage in the United States with a correlation coefficient (R) of 0.150 and weighted average of 25.1%, a difference of 17.2%.
Wage/Income Gap Correlation Summary
| Measurement | Immigrants from Eritrea | Taiwanese |
| Minimum | 6.0% | 0.32% |
| Maximum | 56.4% | 55.3% |
| Range | 50.4% | 55.0% |
| Mean | 22.2% | 25.8% |
| Median | 21.1% | 27.0% |
| Interquartile 25% (IQ1) | 17.7% | 18.4% |
| Interquartile 75% (IQ3) | 25.3% | 33.4% |
| Interquartile Range (IQR) | 7.6% | 15.0% |
| Standard Deviation (Sample) | 8.2% | 13.0% |
| Standard Deviation (Population) | 8.1% | 12.8% |
Similar Demographics by Wage/Income Gap
Demographics Similar to Immigrants from Eritrea by Wage/Income Gap
In terms of wage/income gap, the demographic groups most similar to Immigrants from Eritrea are Sierra Leonean (21.4%, a difference of 0.020%), Liberian (21.4%, a difference of 0.080%), Immigrants from Sierra Leone (21.4%, a difference of 0.080%), U.S. Virgin Islander (21.5%, a difference of 0.44%), and Lumbee (21.3%, a difference of 0.56%).
| Demographics | Rating | Rank | Wage/Income Gap |
| Immigrants | Somalia | 100.0 /100 | #37 | Exceptional 21.2% |
| Immigrants | Belize | 100.0 /100 | #38 | Exceptional 21.3% |
| Colville | 100.0 /100 | #39 | Exceptional 21.3% |
| Lumbee | 100.0 /100 | #40 | Exceptional 21.3% |
| Liberians | 100.0 /100 | #41 | Exceptional 21.4% |
| Immigrants | Sierra Leone | 100.0 /100 | #42 | Exceptional 21.4% |
| Sierra Leoneans | 100.0 /100 | #43 | Exceptional 21.4% |
| Immigrants | Eritrea | 100.0 /100 | #44 | Exceptional 21.4% |
| U.S. Virgin Islanders | 100.0 /100 | #45 | Exceptional 21.5% |
| Immigrants | Ethiopia | 100.0 /100 | #46 | Exceptional 21.6% |
| Immigrants | Congo | 100.0 /100 | #47 | Exceptional 21.7% |
| Blacks/African Americans | 100.0 /100 | #48 | Exceptional 21.7% |
| Ethiopians | 100.0 /100 | #49 | Exceptional 21.8% |
| Immigrants | Western Africa | 100.0 /100 | #50 | Exceptional 22.0% |
| Tohono O'odham | 100.0 /100 | #51 | Exceptional 22.1% |
Demographics Similar to Taiwanese by Wage/Income Gap
In terms of wage/income gap, the demographic groups most similar to Taiwanese are Uruguayan (25.2%, a difference of 0.030%), Immigrants (25.1%, a difference of 0.080%), Immigrants from Peru (25.1%, a difference of 0.12%), Iroquois (25.1%, a difference of 0.27%), and Blackfeet (25.2%, a difference of 0.36%).
| Demographics | Rating | Rank | Wage/Income Gap |
| Chippewa | 86.9 /100 | #144 | Excellent 25.0% |
| Comanche | 85.2 /100 | #145 | Excellent 25.0% |
| South Americans | 85.2 /100 | #146 | Excellent 25.0% |
| Malaysians | 84.9 /100 | #147 | Excellent 25.0% |
| Iroquois | 83.9 /100 | #148 | Excellent 25.1% |
| Immigrants | Peru | 82.6 /100 | #149 | Excellent 25.1% |
| Immigrants | Immigrants | 82.3 /100 | #150 | Excellent 25.1% |
| Taiwanese | 81.6 /100 | #151 | Excellent 25.1% |
| Uruguayans | 81.3 /100 | #152 | Excellent 25.2% |
| Blackfeet | 78.1 /100 | #153 | Good 25.2% |
| Immigrants | Northern Africa | 78.1 /100 | #154 | Good 25.2% |
| Immigrants | Vietnam | 77.7 /100 | #155 | Good 25.2% |
| Immigrants | Mexico | 76.4 /100 | #156 | Good 25.3% |
| Costa Ricans | 75.8 /100 | #157 | Good 25.3% |
| Immigrants | Zimbabwe | 73.7 /100 | #158 | Good 25.3% |