Immigrants from Eritrea vs Filipino Wage/Income Gap
COMPARE
Immigrants from Eritrea
Filipino
Wage/Income Gap
Wage/Income Gap Comparison
Immigrants from Eritrea
Filipinos
21.4%
WAGE/INCOME GAP
100.0/ 100
METRIC RATING
44th/ 347
METRIC RANK
29.7%
WAGE/INCOME GAP
0.0/ 100
METRIC RATING
338th/ 347
METRIC RANK
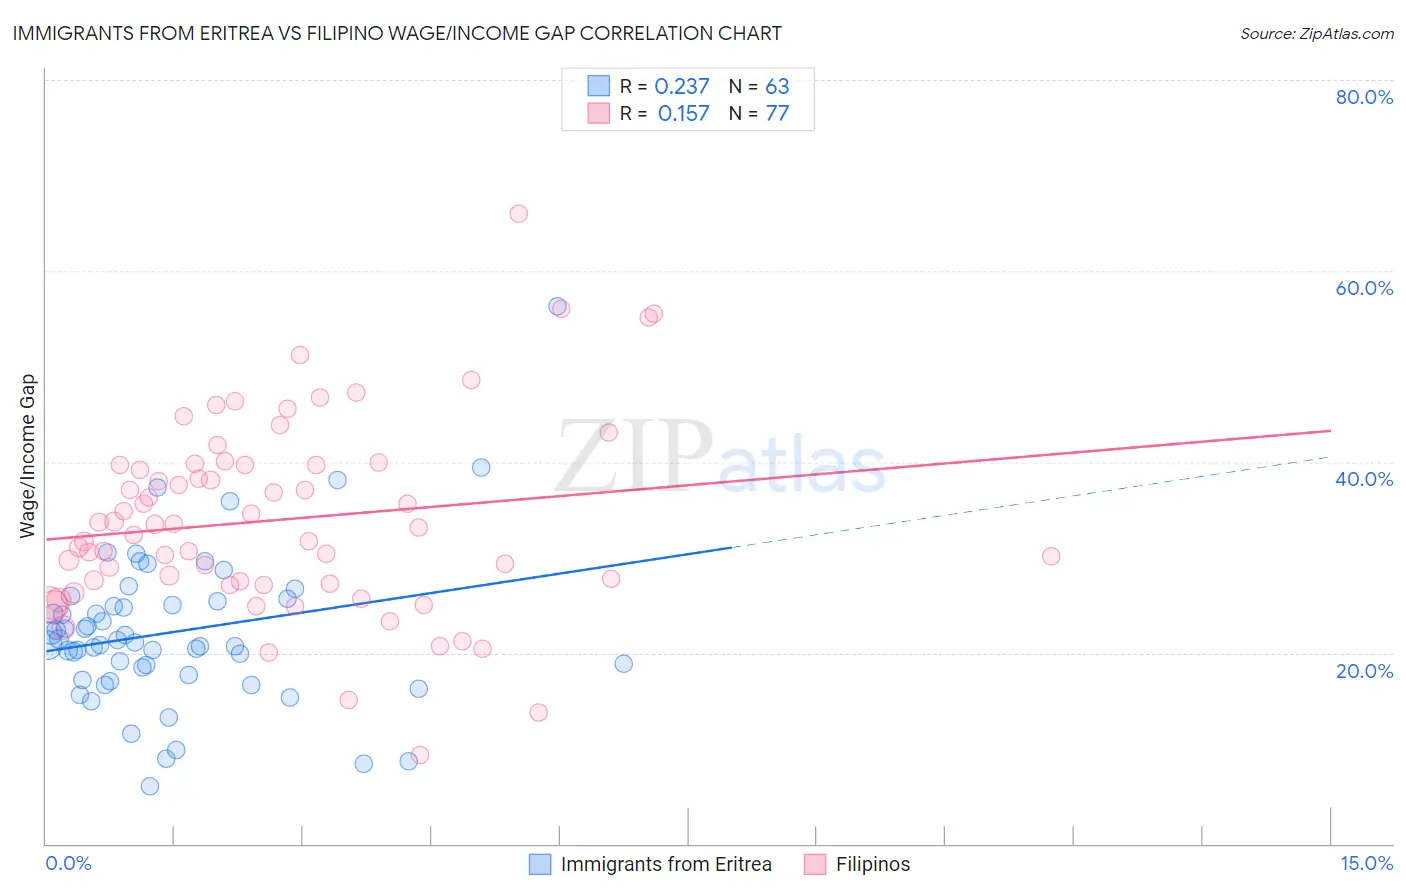
Immigrants from Eritrea vs Filipino Wage/Income Gap Correlation Chart
The statistical analysis conducted on geographies consisting of 104,849,653 people shows a weak positive correlation between the proportion of Immigrants from Eritrea and wage/income gap percentage in the United States with a correlation coefficient (R) of 0.237 and weighted average of 21.4%. Similarly, the statistical analysis conducted on geographies consisting of 254,305,942 people shows a poor positive correlation between the proportion of Filipinos and wage/income gap percentage in the United States with a correlation coefficient (R) of 0.157 and weighted average of 29.7%, a difference of 38.5%.
Wage/Income Gap Correlation Summary
| Measurement | Immigrants from Eritrea | Filipino |
| Minimum | 6.0% | 9.3% |
| Maximum | 56.4% | 66.0% |
| Range | 50.4% | 56.7% |
| Mean | 22.2% | 33.9% |
| Median | 21.1% | 33.2% |
| Interquartile 25% (IQ1) | 17.7% | 27.2% |
| Interquartile 75% (IQ3) | 25.3% | 39.7% |
| Interquartile Range (IQR) | 7.6% | 12.5% |
| Standard Deviation (Sample) | 8.2% | 10.1% |
| Standard Deviation (Population) | 8.1% | 10.1% |
Similar Demographics by Wage/Income Gap
Demographics Similar to Immigrants from Eritrea by Wage/Income Gap
In terms of wage/income gap, the demographic groups most similar to Immigrants from Eritrea are Sierra Leonean (21.4%, a difference of 0.020%), Liberian (21.4%, a difference of 0.080%), Immigrants from Sierra Leone (21.4%, a difference of 0.080%), U.S. Virgin Islander (21.5%, a difference of 0.44%), and Lumbee (21.3%, a difference of 0.56%).
| Demographics | Rating | Rank | Wage/Income Gap |
| Immigrants | Somalia | 100.0 /100 | #37 | Exceptional 21.2% |
| Immigrants | Belize | 100.0 /100 | #38 | Exceptional 21.3% |
| Colville | 100.0 /100 | #39 | Exceptional 21.3% |
| Lumbee | 100.0 /100 | #40 | Exceptional 21.3% |
| Liberians | 100.0 /100 | #41 | Exceptional 21.4% |
| Immigrants | Sierra Leone | 100.0 /100 | #42 | Exceptional 21.4% |
| Sierra Leoneans | 100.0 /100 | #43 | Exceptional 21.4% |
| Immigrants | Eritrea | 100.0 /100 | #44 | Exceptional 21.4% |
| U.S. Virgin Islanders | 100.0 /100 | #45 | Exceptional 21.5% |
| Immigrants | Ethiopia | 100.0 /100 | #46 | Exceptional 21.6% |
| Immigrants | Congo | 100.0 /100 | #47 | Exceptional 21.7% |
| Blacks/African Americans | 100.0 /100 | #48 | Exceptional 21.7% |
| Ethiopians | 100.0 /100 | #49 | Exceptional 21.8% |
| Immigrants | Western Africa | 100.0 /100 | #50 | Exceptional 22.0% |
| Tohono O'odham | 100.0 /100 | #51 | Exceptional 22.1% |
Demographics Similar to Filipinos by Wage/Income Gap
In terms of wage/income gap, the demographic groups most similar to Filipinos are Iranian (29.7%, a difference of 0.060%), Dutch (29.6%, a difference of 0.22%), English (29.5%, a difference of 0.80%), Immigrants from Taiwan (29.5%, a difference of 0.81%), and Swiss (30.0%, a difference of 0.89%).
| Demographics | Rating | Rank | Wage/Income Gap |
| Czechs | 0.0 /100 | #331 | Tragic 29.2% |
| Immigrants | South Central Asia | 0.0 /100 | #332 | Tragic 29.3% |
| Europeans | 0.0 /100 | #333 | Tragic 29.4% |
| Swedes | 0.0 /100 | #334 | Tragic 29.4% |
| Immigrants | Taiwan | 0.0 /100 | #335 | Tragic 29.5% |
| English | 0.0 /100 | #336 | Tragic 29.5% |
| Dutch | 0.0 /100 | #337 | Tragic 29.6% |
| Filipinos | 0.0 /100 | #338 | Tragic 29.7% |
| Iranians | 0.0 /100 | #339 | Tragic 29.7% |
| Swiss | 0.0 /100 | #340 | Tragic 30.0% |
| Thais | 0.0 /100 | #341 | Tragic 30.5% |
| Pennsylvania Germans | 0.0 /100 | #342 | Tragic 30.7% |
| Danes | 0.0 /100 | #343 | Tragic 31.0% |
| Assyrians/Chaldeans/Syriacs | 0.0 /100 | #344 | Tragic 31.0% |
| Immigrants | India | 0.0 /100 | #345 | Tragic 31.5% |