Immigrants from Eritrea vs Immigrants from Jamaica Wage/Income Gap
COMPARE
Immigrants from Eritrea
Immigrants from Jamaica
Wage/Income Gap
Wage/Income Gap Comparison
Immigrants from Eritrea
Immigrants from Jamaica
21.4%
WAGE/INCOME GAP
100.0/ 100
METRIC RATING
44th/ 347
METRIC RANK
18.8%
WAGE/INCOME GAP
100.0/ 100
METRIC RATING
8th/ 347
METRIC RANK
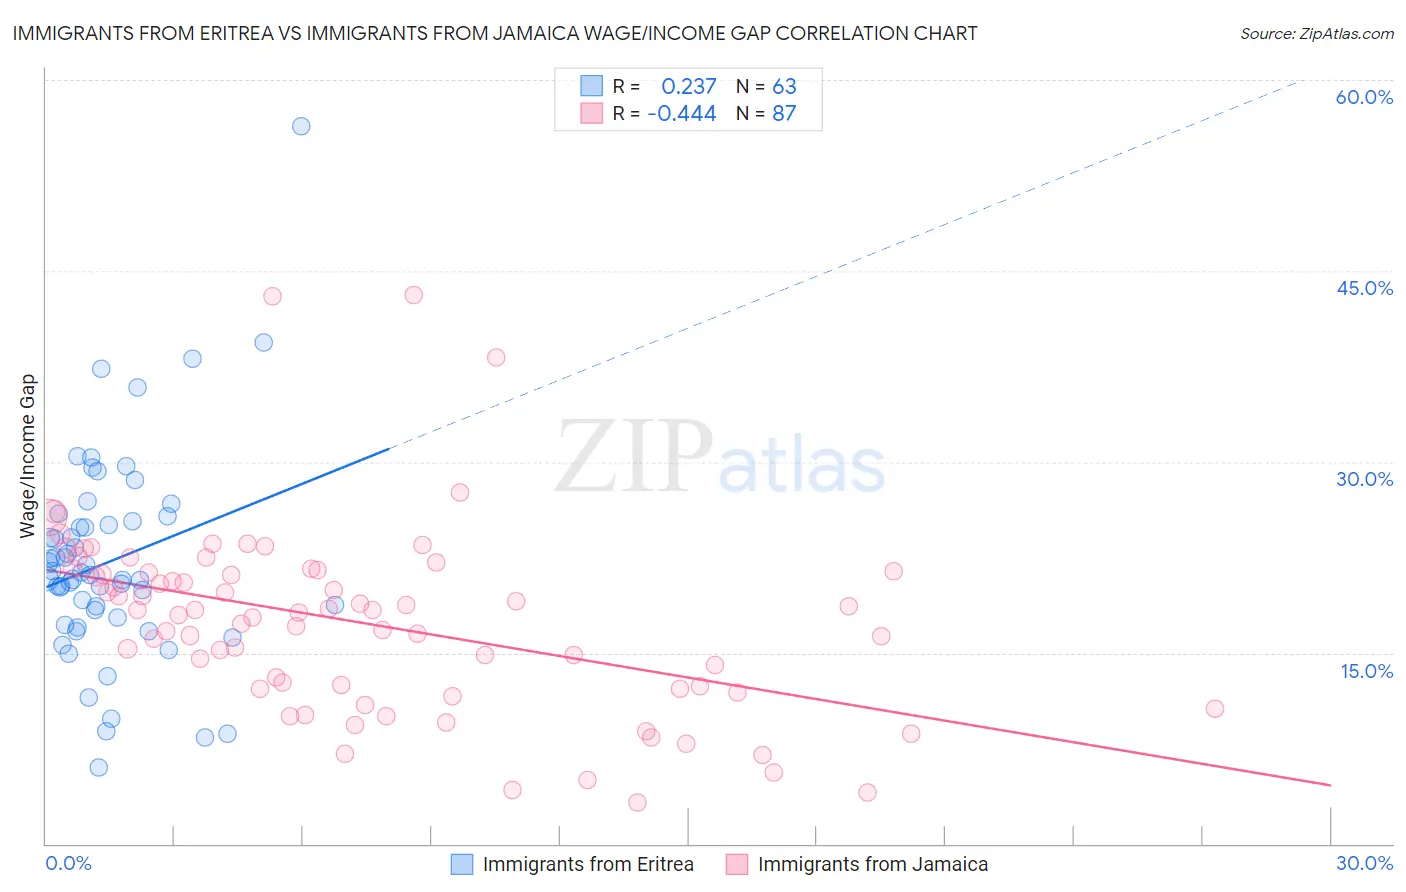
Immigrants from Eritrea vs Immigrants from Jamaica Wage/Income Gap Correlation Chart
The statistical analysis conducted on geographies consisting of 104,849,653 people shows a weak positive correlation between the proportion of Immigrants from Eritrea and wage/income gap percentage in the United States with a correlation coefficient (R) of 0.237 and weighted average of 21.4%. Similarly, the statistical analysis conducted on geographies consisting of 301,660,562 people shows a moderate negative correlation between the proportion of Immigrants from Jamaica and wage/income gap percentage in the United States with a correlation coefficient (R) of -0.444 and weighted average of 18.8%, a difference of 13.9%.
Wage/Income Gap Correlation Summary
| Measurement | Immigrants from Eritrea | Immigrants from Jamaica |
| Minimum | 6.0% | 3.2% |
| Maximum | 56.4% | 43.2% |
| Range | 50.4% | 40.0% |
| Mean | 22.2% | 17.4% |
| Median | 21.1% | 18.2% |
| Interquartile 25% (IQ1) | 17.7% | 12.2% |
| Interquartile 75% (IQ3) | 25.3% | 21.4% |
| Interquartile Range (IQR) | 7.6% | 9.2% |
| Standard Deviation (Sample) | 8.2% | 7.3% |
| Standard Deviation (Population) | 8.1% | 7.3% |
Similar Demographics by Wage/Income Gap
Demographics Similar to Immigrants from Eritrea by Wage/Income Gap
In terms of wage/income gap, the demographic groups most similar to Immigrants from Eritrea are Sierra Leonean (21.4%, a difference of 0.020%), Liberian (21.4%, a difference of 0.080%), Immigrants from Sierra Leone (21.4%, a difference of 0.080%), U.S. Virgin Islander (21.5%, a difference of 0.44%), and Lumbee (21.3%, a difference of 0.56%).
| Demographics | Rating | Rank | Wage/Income Gap |
| Immigrants | Somalia | 100.0 /100 | #37 | Exceptional 21.2% |
| Immigrants | Belize | 100.0 /100 | #38 | Exceptional 21.3% |
| Colville | 100.0 /100 | #39 | Exceptional 21.3% |
| Lumbee | 100.0 /100 | #40 | Exceptional 21.3% |
| Liberians | 100.0 /100 | #41 | Exceptional 21.4% |
| Immigrants | Sierra Leone | 100.0 /100 | #42 | Exceptional 21.4% |
| Sierra Leoneans | 100.0 /100 | #43 | Exceptional 21.4% |
| Immigrants | Eritrea | 100.0 /100 | #44 | Exceptional 21.4% |
| U.S. Virgin Islanders | 100.0 /100 | #45 | Exceptional 21.5% |
| Immigrants | Ethiopia | 100.0 /100 | #46 | Exceptional 21.6% |
| Immigrants | Congo | 100.0 /100 | #47 | Exceptional 21.7% |
| Blacks/African Americans | 100.0 /100 | #48 | Exceptional 21.7% |
| Ethiopians | 100.0 /100 | #49 | Exceptional 21.8% |
| Immigrants | Western Africa | 100.0 /100 | #50 | Exceptional 22.0% |
| Tohono O'odham | 100.0 /100 | #51 | Exceptional 22.1% |
Demographics Similar to Immigrants from Jamaica by Wage/Income Gap
In terms of wage/income gap, the demographic groups most similar to Immigrants from Jamaica are Puerto Rican (18.7%, a difference of 0.63%), Barbadian (19.0%, a difference of 0.66%), Crow (19.1%, a difference of 1.2%), Immigrants from Haiti (19.2%, a difference of 2.0%), and Immigrants from West Indies (19.2%, a difference of 2.1%).
| Demographics | Rating | Rank | Wage/Income Gap |
| Immigrants | Grenada | 100.0 /100 | #1 | Exceptional 16.2% |
| Immigrants | St. Vincent and the Grenadines | 100.0 /100 | #2 | Exceptional 16.4% |
| Immigrants | Barbados | 100.0 /100 | #3 | Exceptional 17.8% |
| British West Indians | 100.0 /100 | #4 | Exceptional 18.0% |
| Guyanese | 100.0 /100 | #5 | Exceptional 18.3% |
| Immigrants | Guyana | 100.0 /100 | #6 | Exceptional 18.4% |
| Puerto Ricans | 100.0 /100 | #7 | Exceptional 18.7% |
| Immigrants | Jamaica | 100.0 /100 | #8 | Exceptional 18.8% |
| Barbadians | 100.0 /100 | #9 | Exceptional 19.0% |
| Crow | 100.0 /100 | #10 | Exceptional 19.1% |
| Immigrants | Haiti | 100.0 /100 | #11 | Exceptional 19.2% |
| Immigrants | West Indies | 100.0 /100 | #12 | Exceptional 19.2% |
| Trinidadians and Tobagonians | 100.0 /100 | #13 | Exceptional 19.3% |
| Immigrants | Trinidad and Tobago | 100.0 /100 | #14 | Exceptional 19.3% |
| West Indians | 100.0 /100 | #15 | Exceptional 19.6% |