Immigrants from Eritrea vs New Zealander Wage/Income Gap
COMPARE
Immigrants from Eritrea
New Zealander
Wage/Income Gap
Wage/Income Gap Comparison
Immigrants from Eritrea
New Zealanders
21.4%
WAGE/INCOME GAP
100.0/ 100
METRIC RATING
44th/ 347
METRIC RANK
27.7%
WAGE/INCOME GAP
1.0/ 100
METRIC RATING
268th/ 347
METRIC RANK
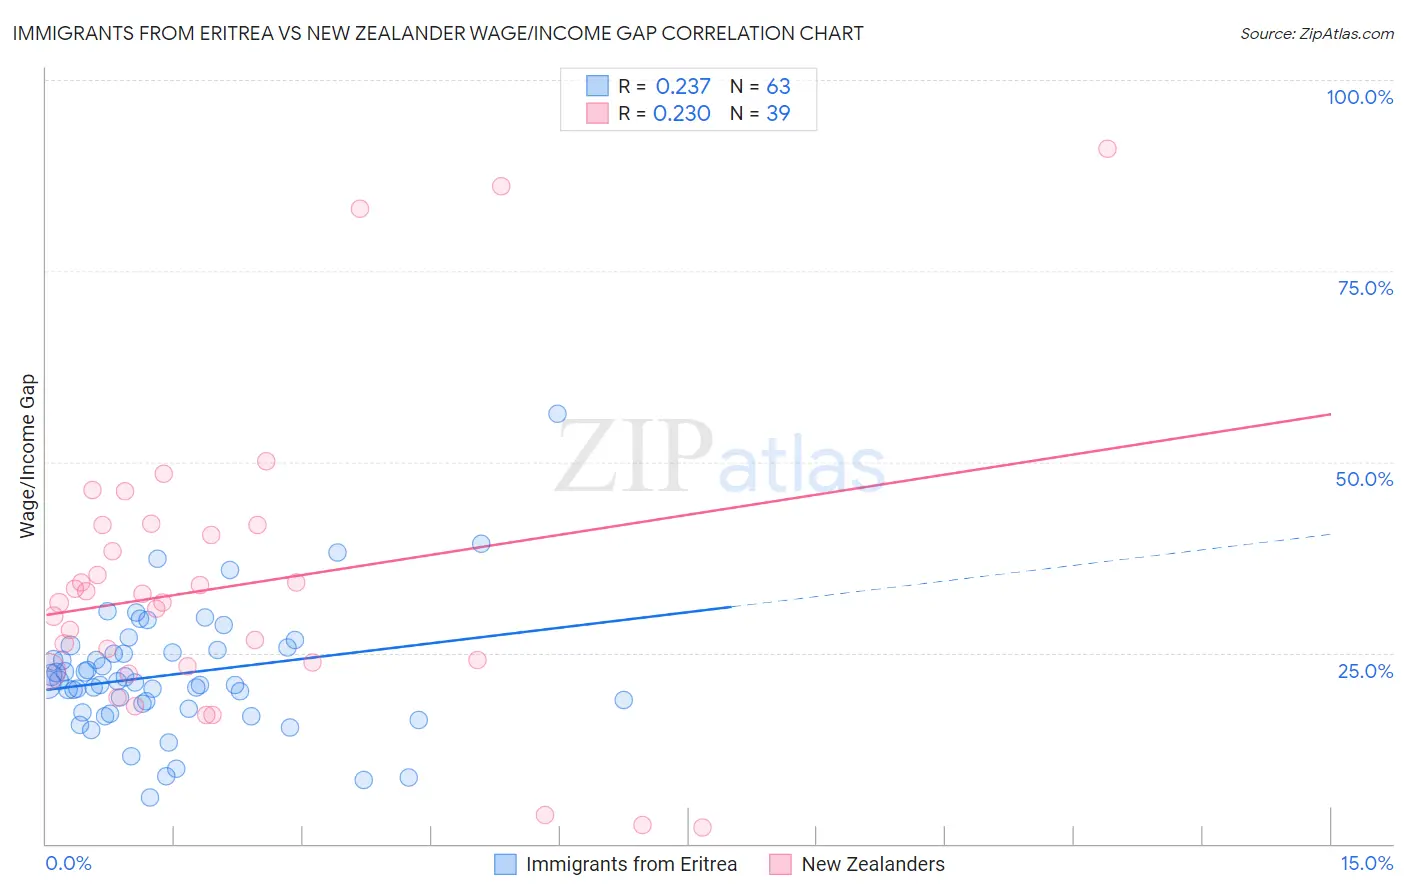
Immigrants from Eritrea vs New Zealander Wage/Income Gap Correlation Chart
The statistical analysis conducted on geographies consisting of 104,849,653 people shows a weak positive correlation between the proportion of Immigrants from Eritrea and wage/income gap percentage in the United States with a correlation coefficient (R) of 0.237 and weighted average of 21.4%. Similarly, the statistical analysis conducted on geographies consisting of 106,903,944 people shows a weak positive correlation between the proportion of New Zealanders and wage/income gap percentage in the United States with a correlation coefficient (R) of 0.230 and weighted average of 27.7%, a difference of 29.2%.
Wage/Income Gap Correlation Summary
| Measurement | Immigrants from Eritrea | New Zealander |
| Minimum | 6.0% | 2.1% |
| Maximum | 56.4% | 91.0% |
| Range | 50.4% | 88.9% |
| Mean | 22.2% | 33.8% |
| Median | 21.1% | 31.6% |
| Interquartile 25% (IQ1) | 17.7% | 23.2% |
| Interquartile 75% (IQ3) | 25.3% | 41.8% |
| Interquartile Range (IQR) | 7.6% | 18.5% |
| Standard Deviation (Sample) | 8.2% | 19.3% |
| Standard Deviation (Population) | 8.1% | 19.1% |
Similar Demographics by Wage/Income Gap
Demographics Similar to Immigrants from Eritrea by Wage/Income Gap
In terms of wage/income gap, the demographic groups most similar to Immigrants from Eritrea are Sierra Leonean (21.4%, a difference of 0.020%), Liberian (21.4%, a difference of 0.080%), Immigrants from Sierra Leone (21.4%, a difference of 0.080%), U.S. Virgin Islander (21.5%, a difference of 0.44%), and Lumbee (21.3%, a difference of 0.56%).
| Demographics | Rating | Rank | Wage/Income Gap |
| Immigrants | Somalia | 100.0 /100 | #37 | Exceptional 21.2% |
| Immigrants | Belize | 100.0 /100 | #38 | Exceptional 21.3% |
| Colville | 100.0 /100 | #39 | Exceptional 21.3% |
| Lumbee | 100.0 /100 | #40 | Exceptional 21.3% |
| Liberians | 100.0 /100 | #41 | Exceptional 21.4% |
| Immigrants | Sierra Leone | 100.0 /100 | #42 | Exceptional 21.4% |
| Sierra Leoneans | 100.0 /100 | #43 | Exceptional 21.4% |
| Immigrants | Eritrea | 100.0 /100 | #44 | Exceptional 21.4% |
| U.S. Virgin Islanders | 100.0 /100 | #45 | Exceptional 21.5% |
| Immigrants | Ethiopia | 100.0 /100 | #46 | Exceptional 21.6% |
| Immigrants | Congo | 100.0 /100 | #47 | Exceptional 21.7% |
| Blacks/African Americans | 100.0 /100 | #48 | Exceptional 21.7% |
| Ethiopians | 100.0 /100 | #49 | Exceptional 21.8% |
| Immigrants | Western Africa | 100.0 /100 | #50 | Exceptional 22.0% |
| Tohono O'odham | 100.0 /100 | #51 | Exceptional 22.1% |
Demographics Similar to New Zealanders by Wage/Income Gap
In terms of wage/income gap, the demographic groups most similar to New Zealanders are Potawatomi (27.7%, a difference of 0.010%), Turkish (27.7%, a difference of 0.080%), Immigrants from Switzerland (27.7%, a difference of 0.10%), Serbian (27.7%, a difference of 0.10%), and Hmong (27.7%, a difference of 0.10%).
| Demographics | Rating | Rank | Wage/Income Gap |
| Immigrants | Germany | 1.5 /100 | #261 | Tragic 27.5% |
| Immigrants | Lebanon | 1.5 /100 | #262 | Tragic 27.5% |
| Syrians | 1.4 /100 | #263 | Tragic 27.6% |
| Immigrants | Switzerland | 1.0 /100 | #264 | Tragic 27.7% |
| Serbians | 1.0 /100 | #265 | Tragic 27.7% |
| Hmong | 1.0 /100 | #266 | Tragic 27.7% |
| Turks | 1.0 /100 | #267 | Tragic 27.7% |
| New Zealanders | 1.0 /100 | #268 | Tragic 27.7% |
| Potawatomi | 0.9 /100 | #269 | Tragic 27.7% |
| Immigrants | Western Europe | 0.9 /100 | #270 | Tragic 27.8% |
| Ute | 0.8 /100 | #271 | Tragic 27.8% |
| Immigrants | Korea | 0.8 /100 | #272 | Tragic 27.8% |
| Bulgarians | 0.7 /100 | #273 | Tragic 27.8% |
| Americans | 0.7 /100 | #274 | Tragic 27.8% |
| Immigrants | Japan | 0.7 /100 | #275 | Tragic 27.9% |