Iraqi vs Taiwanese Wage/Income Gap
COMPARE
Iraqi
Taiwanese
Wage/Income Gap
Wage/Income Gap Comparison
Iraqis
Taiwanese
26.6%
WAGE/INCOME GAP
11.2/ 100
METRIC RATING
212th/ 347
METRIC RANK
25.1%
WAGE/INCOME GAP
81.6/ 100
METRIC RATING
151st/ 347
METRIC RANK
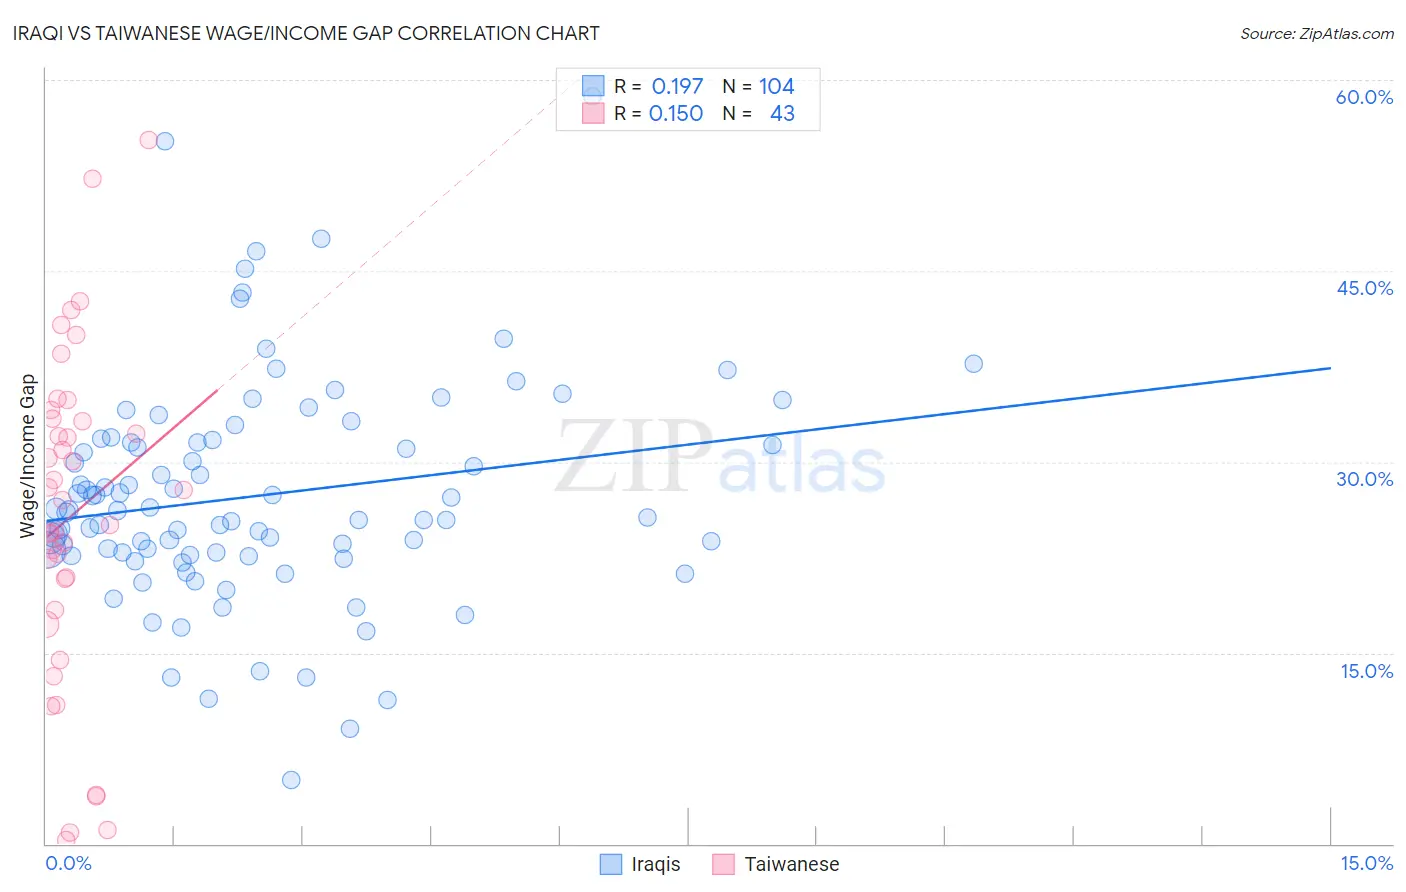
Iraqi vs Taiwanese Wage/Income Gap Correlation Chart
The statistical analysis conducted on geographies consisting of 170,626,285 people shows a poor positive correlation between the proportion of Iraqis and wage/income gap percentage in the United States with a correlation coefficient (R) of 0.197 and weighted average of 26.6%. Similarly, the statistical analysis conducted on geographies consisting of 31,719,634 people shows a poor positive correlation between the proportion of Taiwanese and wage/income gap percentage in the United States with a correlation coefficient (R) of 0.150 and weighted average of 25.1%, a difference of 5.9%.
Wage/Income Gap Correlation Summary
| Measurement | Iraqi | Taiwanese |
| Minimum | 5.0% | 0.32% |
| Maximum | 58.7% | 55.3% |
| Range | 53.7% | 55.0% |
| Mean | 27.3% | 25.8% |
| Median | 26.1% | 27.0% |
| Interquartile 25% (IQ1) | 22.8% | 18.4% |
| Interquartile 75% (IQ3) | 31.6% | 33.4% |
| Interquartile Range (IQR) | 8.9% | 15.0% |
| Standard Deviation (Sample) | 8.8% | 13.0% |
| Standard Deviation (Population) | 8.7% | 12.8% |
Similar Demographics by Wage/Income Gap
Demographics Similar to Iraqis by Wage/Income Gap
In terms of wage/income gap, the demographic groups most similar to Iraqis are Mongolian (26.6%, a difference of 0.030%), Immigrants from Iraq (26.7%, a difference of 0.15%), Arab (26.6%, a difference of 0.16%), Immigrants from China (26.7%, a difference of 0.16%), and Immigrants from Kuwait (26.6%, a difference of 0.20%).
| Demographics | Rating | Rank | Wage/Income Gap |
| Immigrants | Southern Europe | 17.3 /100 | #205 | Poor 26.4% |
| Indians (Asian) | 16.5 /100 | #206 | Poor 26.4% |
| Immigrants | Italy | 15.8 /100 | #207 | Poor 26.5% |
| Egyptians | 12.7 /100 | #208 | Poor 26.6% |
| Immigrants | Kuwait | 12.6 /100 | #209 | Poor 26.6% |
| Arabs | 12.3 /100 | #210 | Poor 26.6% |
| Mongolians | 11.4 /100 | #211 | Poor 26.6% |
| Iraqis | 11.2 /100 | #212 | Poor 26.6% |
| Immigrants | Iraq | 10.3 /100 | #213 | Poor 26.7% |
| Immigrants | China | 10.3 /100 | #214 | Poor 26.7% |
| Yugoslavians | 9.7 /100 | #215 | Tragic 26.7% |
| Immigrants | Portugal | 9.5 /100 | #216 | Tragic 26.7% |
| Brazilians | 9.2 /100 | #217 | Tragic 26.7% |
| Immigrants | Saudi Arabia | 9.1 /100 | #218 | Tragic 26.7% |
| Immigrants | Poland | 8.9 /100 | #219 | Tragic 26.7% |
Demographics Similar to Taiwanese by Wage/Income Gap
In terms of wage/income gap, the demographic groups most similar to Taiwanese are Uruguayan (25.2%, a difference of 0.030%), Immigrants (25.1%, a difference of 0.080%), Immigrants from Peru (25.1%, a difference of 0.12%), Iroquois (25.1%, a difference of 0.27%), and Blackfeet (25.2%, a difference of 0.36%).
| Demographics | Rating | Rank | Wage/Income Gap |
| Chippewa | 86.9 /100 | #144 | Excellent 25.0% |
| Comanche | 85.2 /100 | #145 | Excellent 25.0% |
| South Americans | 85.2 /100 | #146 | Excellent 25.0% |
| Malaysians | 84.9 /100 | #147 | Excellent 25.0% |
| Iroquois | 83.9 /100 | #148 | Excellent 25.1% |
| Immigrants | Peru | 82.6 /100 | #149 | Excellent 25.1% |
| Immigrants | Immigrants | 82.3 /100 | #150 | Excellent 25.1% |
| Taiwanese | 81.6 /100 | #151 | Excellent 25.1% |
| Uruguayans | 81.3 /100 | #152 | Excellent 25.2% |
| Blackfeet | 78.1 /100 | #153 | Good 25.2% |
| Immigrants | Northern Africa | 78.1 /100 | #154 | Good 25.2% |
| Immigrants | Vietnam | 77.7 /100 | #155 | Good 25.2% |
| Immigrants | Mexico | 76.4 /100 | #156 | Good 25.3% |
| Costa Ricans | 75.8 /100 | #157 | Good 25.3% |
| Immigrants | Zimbabwe | 73.7 /100 | #158 | Good 25.3% |