Immigrants from Bahamas vs Taiwanese Wage/Income Gap
COMPARE
Immigrants from Bahamas
Taiwanese
Wage/Income Gap
Wage/Income Gap Comparison
Immigrants from Bahamas
Taiwanese
21.1%
WAGE/INCOME GAP
100.0/ 100
METRIC RATING
33rd/ 347
METRIC RANK
25.1%
WAGE/INCOME GAP
81.6/ 100
METRIC RATING
151st/ 347
METRIC RANK
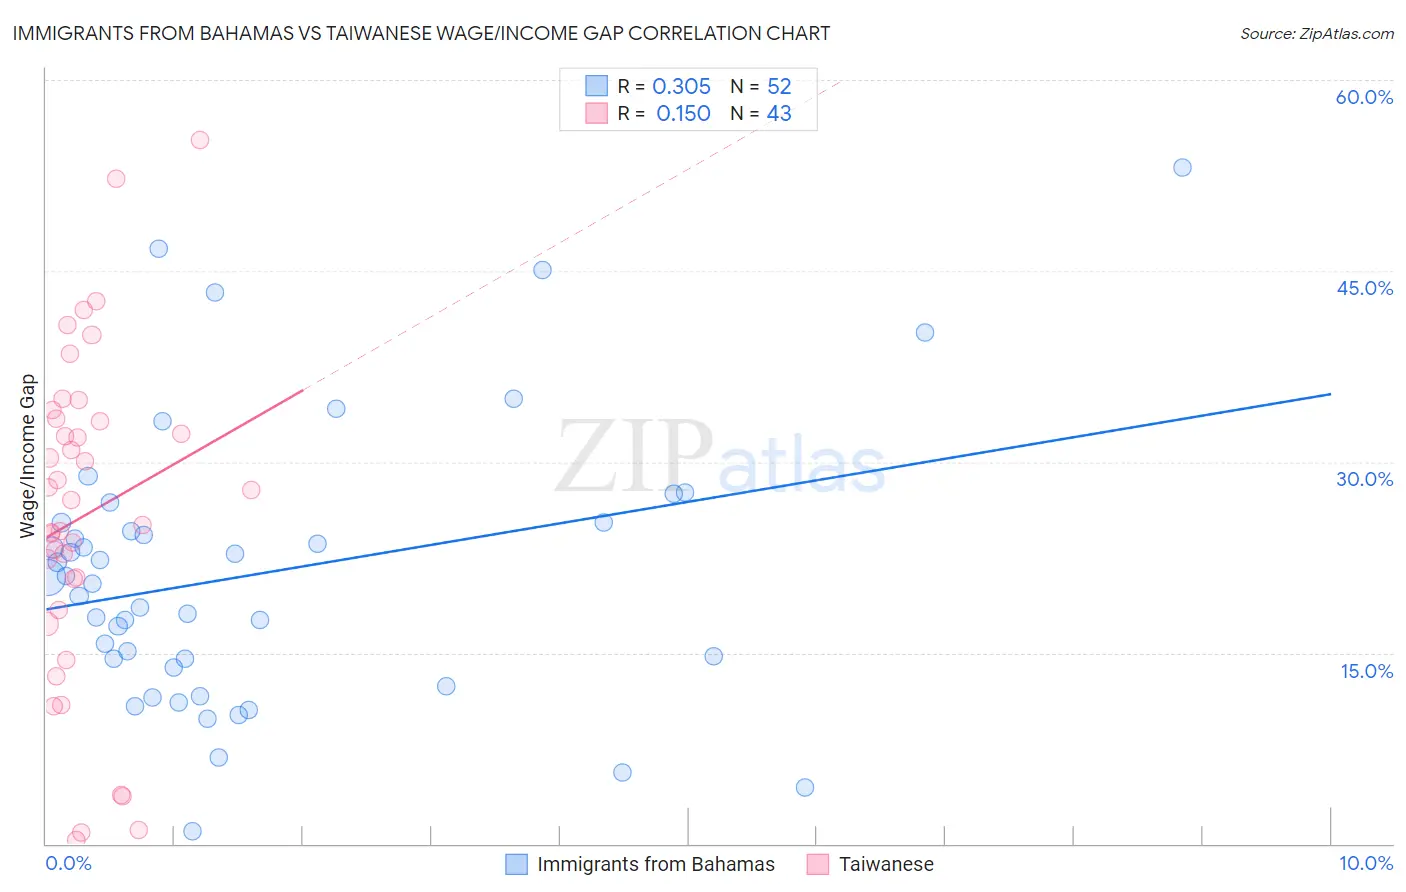
Immigrants from Bahamas vs Taiwanese Wage/Income Gap Correlation Chart
The statistical analysis conducted on geographies consisting of 104,631,049 people shows a mild positive correlation between the proportion of Immigrants from Bahamas and wage/income gap percentage in the United States with a correlation coefficient (R) of 0.305 and weighted average of 21.1%. Similarly, the statistical analysis conducted on geographies consisting of 31,719,634 people shows a poor positive correlation between the proportion of Taiwanese and wage/income gap percentage in the United States with a correlation coefficient (R) of 0.150 and weighted average of 25.1%, a difference of 19.4%.
Wage/Income Gap Correlation Summary
| Measurement | Immigrants from Bahamas | Taiwanese |
| Minimum | 0.96% | 0.32% |
| Maximum | 53.2% | 55.3% |
| Range | 52.2% | 55.0% |
| Mean | 21.3% | 25.8% |
| Median | 20.7% | 27.0% |
| Interquartile 25% (IQ1) | 14.2% | 18.4% |
| Interquartile 75% (IQ3) | 25.2% | 33.4% |
| Interquartile Range (IQR) | 11.1% | 15.0% |
| Standard Deviation (Sample) | 11.0% | 13.0% |
| Standard Deviation (Population) | 10.9% | 12.8% |
Similar Demographics by Wage/Income Gap
Demographics Similar to Immigrants from Bahamas by Wage/Income Gap
In terms of wage/income gap, the demographic groups most similar to Immigrants from Bahamas are Immigrants from Yemen (21.1%, a difference of 0.010%), Vietnamese (21.0%, a difference of 0.25%), Pima (21.1%, a difference of 0.28%), Immigrants from Bangladesh (20.9%, a difference of 0.53%), and Immigrants from Senegal (20.9%, a difference of 0.74%).
| Demographics | Rating | Rank | Wage/Income Gap |
| Pueblo | 100.0 /100 | #26 | Exceptional 20.7% |
| Immigrants | Armenia | 100.0 /100 | #27 | Exceptional 20.7% |
| Inupiat | 100.0 /100 | #28 | Exceptional 20.8% |
| Immigrants | Senegal | 100.0 /100 | #29 | Exceptional 20.9% |
| Immigrants | Bangladesh | 100.0 /100 | #30 | Exceptional 20.9% |
| Vietnamese | 100.0 /100 | #31 | Exceptional 21.0% |
| Immigrants | Yemen | 100.0 /100 | #32 | Exceptional 21.1% |
| Immigrants | Bahamas | 100.0 /100 | #33 | Exceptional 21.1% |
| Pima | 100.0 /100 | #34 | Exceptional 21.1% |
| Somalis | 100.0 /100 | #35 | Exceptional 21.2% |
| Belizeans | 100.0 /100 | #36 | Exceptional 21.2% |
| Immigrants | Somalia | 100.0 /100 | #37 | Exceptional 21.2% |
| Immigrants | Belize | 100.0 /100 | #38 | Exceptional 21.3% |
| Colville | 100.0 /100 | #39 | Exceptional 21.3% |
| Lumbee | 100.0 /100 | #40 | Exceptional 21.3% |
Demographics Similar to Taiwanese by Wage/Income Gap
In terms of wage/income gap, the demographic groups most similar to Taiwanese are Uruguayan (25.2%, a difference of 0.030%), Immigrants (25.1%, a difference of 0.080%), Immigrants from Peru (25.1%, a difference of 0.12%), Iroquois (25.1%, a difference of 0.27%), and Blackfeet (25.2%, a difference of 0.36%).
| Demographics | Rating | Rank | Wage/Income Gap |
| Chippewa | 86.9 /100 | #144 | Excellent 25.0% |
| Comanche | 85.2 /100 | #145 | Excellent 25.0% |
| South Americans | 85.2 /100 | #146 | Excellent 25.0% |
| Malaysians | 84.9 /100 | #147 | Excellent 25.0% |
| Iroquois | 83.9 /100 | #148 | Excellent 25.1% |
| Immigrants | Peru | 82.6 /100 | #149 | Excellent 25.1% |
| Immigrants | Immigrants | 82.3 /100 | #150 | Excellent 25.1% |
| Taiwanese | 81.6 /100 | #151 | Excellent 25.1% |
| Uruguayans | 81.3 /100 | #152 | Excellent 25.2% |
| Blackfeet | 78.1 /100 | #153 | Good 25.2% |
| Immigrants | Northern Africa | 78.1 /100 | #154 | Good 25.2% |
| Immigrants | Vietnam | 77.7 /100 | #155 | Good 25.2% |
| Immigrants | Mexico | 76.4 /100 | #156 | Good 25.3% |
| Costa Ricans | 75.8 /100 | #157 | Good 25.3% |
| Immigrants | Zimbabwe | 73.7 /100 | #158 | Good 25.3% |