Immigrants from Eritrea vs Guatemalan Wage/Income Gap
COMPARE
Immigrants from Eritrea
Guatemalan
Wage/Income Gap
Wage/Income Gap Comparison
Immigrants from Eritrea
Guatemalans
21.4%
WAGE/INCOME GAP
100.0/ 100
METRIC RATING
44th/ 347
METRIC RANK
22.6%
WAGE/INCOME GAP
99.9/ 100
METRIC RATING
65th/ 347
METRIC RANK
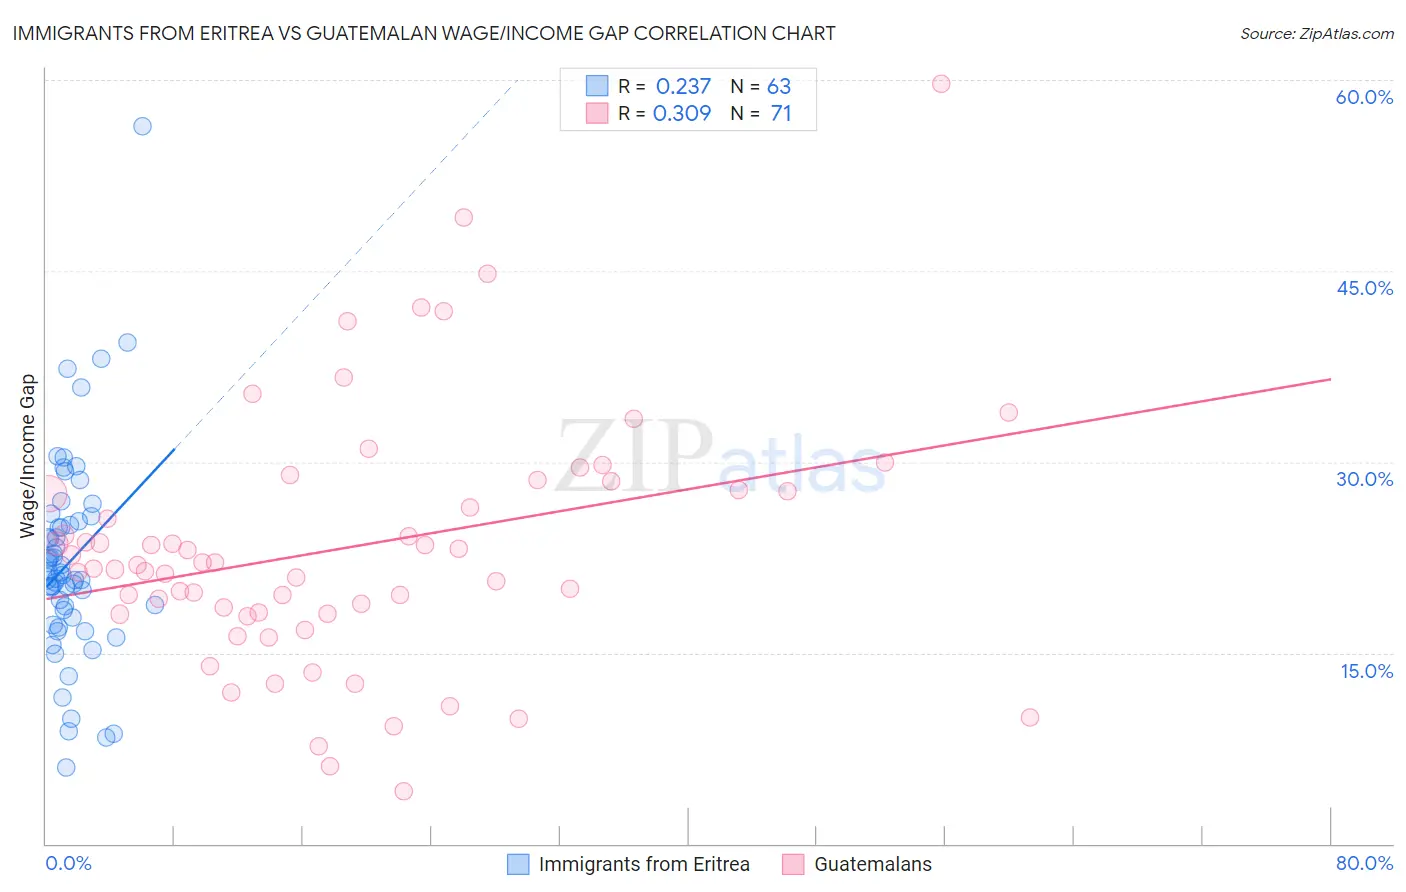
Immigrants from Eritrea vs Guatemalan Wage/Income Gap Correlation Chart
The statistical analysis conducted on geographies consisting of 104,849,653 people shows a weak positive correlation between the proportion of Immigrants from Eritrea and wage/income gap percentage in the United States with a correlation coefficient (R) of 0.237 and weighted average of 21.4%. Similarly, the statistical analysis conducted on geographies consisting of 409,292,341 people shows a mild positive correlation between the proportion of Guatemalans and wage/income gap percentage in the United States with a correlation coefficient (R) of 0.309 and weighted average of 22.6%, a difference of 5.5%.
Wage/Income Gap Correlation Summary
| Measurement | Immigrants from Eritrea | Guatemalan |
| Minimum | 6.0% | 4.1% |
| Maximum | 56.4% | 59.7% |
| Range | 50.4% | 55.6% |
| Mean | 22.2% | 23.3% |
| Median | 21.1% | 21.9% |
| Interquartile 25% (IQ1) | 17.7% | 18.1% |
| Interquartile 75% (IQ3) | 25.3% | 27.8% |
| Interquartile Range (IQR) | 7.6% | 9.7% |
| Standard Deviation (Sample) | 8.2% | 10.0% |
| Standard Deviation (Population) | 8.1% | 9.9% |
Similar Demographics by Wage/Income Gap
Demographics Similar to Immigrants from Eritrea by Wage/Income Gap
In terms of wage/income gap, the demographic groups most similar to Immigrants from Eritrea are Sierra Leonean (21.4%, a difference of 0.020%), Liberian (21.4%, a difference of 0.080%), Immigrants from Sierra Leone (21.4%, a difference of 0.080%), U.S. Virgin Islander (21.5%, a difference of 0.44%), and Lumbee (21.3%, a difference of 0.56%).
| Demographics | Rating | Rank | Wage/Income Gap |
| Immigrants | Somalia | 100.0 /100 | #37 | Exceptional 21.2% |
| Immigrants | Belize | 100.0 /100 | #38 | Exceptional 21.3% |
| Colville | 100.0 /100 | #39 | Exceptional 21.3% |
| Lumbee | 100.0 /100 | #40 | Exceptional 21.3% |
| Liberians | 100.0 /100 | #41 | Exceptional 21.4% |
| Immigrants | Sierra Leone | 100.0 /100 | #42 | Exceptional 21.4% |
| Sierra Leoneans | 100.0 /100 | #43 | Exceptional 21.4% |
| Immigrants | Eritrea | 100.0 /100 | #44 | Exceptional 21.4% |
| U.S. Virgin Islanders | 100.0 /100 | #45 | Exceptional 21.5% |
| Immigrants | Ethiopia | 100.0 /100 | #46 | Exceptional 21.6% |
| Immigrants | Congo | 100.0 /100 | #47 | Exceptional 21.7% |
| Blacks/African Americans | 100.0 /100 | #48 | Exceptional 21.7% |
| Ethiopians | 100.0 /100 | #49 | Exceptional 21.8% |
| Immigrants | Western Africa | 100.0 /100 | #50 | Exceptional 22.0% |
| Tohono O'odham | 100.0 /100 | #51 | Exceptional 22.1% |
Demographics Similar to Guatemalans by Wage/Income Gap
In terms of wage/income gap, the demographic groups most similar to Guatemalans are Central American Indian (22.7%, a difference of 0.24%), Spanish American Indian (22.5%, a difference of 0.32%), Menominee (22.7%, a difference of 0.41%), Immigrants from Nigeria (22.7%, a difference of 0.42%), and Indonesian (22.7%, a difference of 0.45%).
| Demographics | Rating | Rank | Wage/Income Gap |
| Immigrants | Cuba | 100.0 /100 | #58 | Exceptional 22.4% |
| Navajo | 100.0 /100 | #59 | Exceptional 22.4% |
| Immigrants | Middle Africa | 100.0 /100 | #60 | Exceptional 22.4% |
| Immigrants | Fiji | 100.0 /100 | #61 | Exceptional 22.4% |
| Immigrants | Guatemala | 100.0 /100 | #62 | Exceptional 22.5% |
| Immigrants | Ecuador | 100.0 /100 | #63 | Exceptional 22.5% |
| Spanish American Indians | 100.0 /100 | #64 | Exceptional 22.5% |
| Guatemalans | 99.9 /100 | #65 | Exceptional 22.6% |
| Central American Indians | 99.9 /100 | #66 | Exceptional 22.7% |
| Menominee | 99.9 /100 | #67 | Exceptional 22.7% |
| Immigrants | Nigeria | 99.9 /100 | #68 | Exceptional 22.7% |
| Indonesians | 99.9 /100 | #69 | Exceptional 22.7% |
| Immigrants | Uzbekistan | 99.9 /100 | #70 | Exceptional 22.7% |
| Immigrants | El Salvador | 99.9 /100 | #71 | Exceptional 22.8% |
| Sub-Saharan Africans | 99.9 /100 | #72 | Exceptional 22.8% |