Immigrants from Eritrea vs South American Indian Wage/Income Gap
COMPARE
Immigrants from Eritrea
South American Indian
Wage/Income Gap
Wage/Income Gap Comparison
Immigrants from Eritrea
South American Indians
21.4%
WAGE/INCOME GAP
100.0/ 100
METRIC RATING
44th/ 347
METRIC RANK
24.7%
WAGE/INCOME GAP
92.0/ 100
METRIC RATING
135th/ 347
METRIC RANK
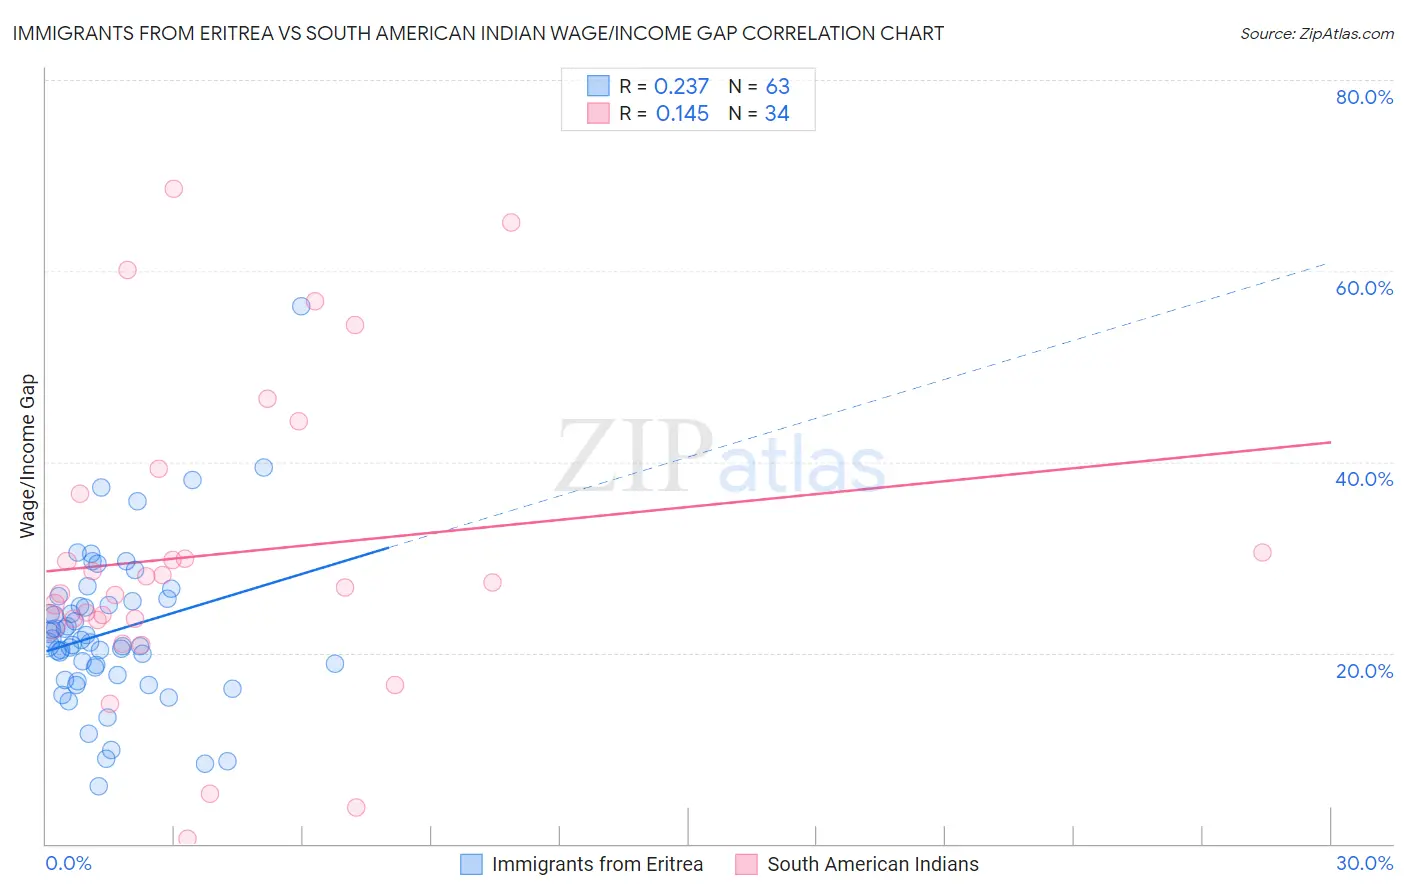
Immigrants from Eritrea vs South American Indian Wage/Income Gap Correlation Chart
The statistical analysis conducted on geographies consisting of 104,849,653 people shows a weak positive correlation between the proportion of Immigrants from Eritrea and wage/income gap percentage in the United States with a correlation coefficient (R) of 0.237 and weighted average of 21.4%. Similarly, the statistical analysis conducted on geographies consisting of 164,540,289 people shows a poor positive correlation between the proportion of South American Indians and wage/income gap percentage in the United States with a correlation coefficient (R) of 0.145 and weighted average of 24.7%, a difference of 15.4%.
Wage/Income Gap Correlation Summary
| Measurement | Immigrants from Eritrea | South American Indian |
| Minimum | 6.0% | 0.52% |
| Maximum | 56.4% | 68.7% |
| Range | 50.4% | 68.1% |
| Mean | 22.2% | 30.4% |
| Median | 21.1% | 27.1% |
| Interquartile 25% (IQ1) | 17.7% | 23.4% |
| Interquartile 75% (IQ3) | 25.3% | 36.7% |
| Interquartile Range (IQR) | 7.6% | 13.2% |
| Standard Deviation (Sample) | 8.2% | 16.2% |
| Standard Deviation (Population) | 8.1% | 15.9% |
Similar Demographics by Wage/Income Gap
Demographics Similar to Immigrants from Eritrea by Wage/Income Gap
In terms of wage/income gap, the demographic groups most similar to Immigrants from Eritrea are Sierra Leonean (21.4%, a difference of 0.020%), Liberian (21.4%, a difference of 0.080%), Immigrants from Sierra Leone (21.4%, a difference of 0.080%), U.S. Virgin Islander (21.5%, a difference of 0.44%), and Lumbee (21.3%, a difference of 0.56%).
| Demographics | Rating | Rank | Wage/Income Gap |
| Immigrants | Somalia | 100.0 /100 | #37 | Exceptional 21.2% |
| Immigrants | Belize | 100.0 /100 | #38 | Exceptional 21.3% |
| Colville | 100.0 /100 | #39 | Exceptional 21.3% |
| Lumbee | 100.0 /100 | #40 | Exceptional 21.3% |
| Liberians | 100.0 /100 | #41 | Exceptional 21.4% |
| Immigrants | Sierra Leone | 100.0 /100 | #42 | Exceptional 21.4% |
| Sierra Leoneans | 100.0 /100 | #43 | Exceptional 21.4% |
| Immigrants | Eritrea | 100.0 /100 | #44 | Exceptional 21.4% |
| U.S. Virgin Islanders | 100.0 /100 | #45 | Exceptional 21.5% |
| Immigrants | Ethiopia | 100.0 /100 | #46 | Exceptional 21.6% |
| Immigrants | Congo | 100.0 /100 | #47 | Exceptional 21.7% |
| Blacks/African Americans | 100.0 /100 | #48 | Exceptional 21.7% |
| Ethiopians | 100.0 /100 | #49 | Exceptional 21.8% |
| Immigrants | Western Africa | 100.0 /100 | #50 | Exceptional 22.0% |
| Tohono O'odham | 100.0 /100 | #51 | Exceptional 22.1% |
Demographics Similar to South American Indians by Wage/Income Gap
In terms of wage/income gap, the demographic groups most similar to South American Indians are Mexican American Indian (24.7%, a difference of 0.060%), Colombian (24.7%, a difference of 0.090%), Immigrants from Costa Rica (24.7%, a difference of 0.10%), Armenian (24.8%, a difference of 0.14%), and Immigrants from South Eastern Asia (24.8%, a difference of 0.23%).
| Demographics | Rating | Rank | Wage/Income Gap |
| Immigrants | Central America | 93.5 /100 | #128 | Exceptional 24.6% |
| Yup'ik | 93.3 /100 | #129 | Exceptional 24.7% |
| Alsatians | 93.2 /100 | #130 | Exceptional 24.7% |
| Immigrants | Philippines | 93.0 /100 | #131 | Exceptional 24.7% |
| Immigrants | Costa Rica | 92.4 /100 | #132 | Exceptional 24.7% |
| Colombians | 92.4 /100 | #133 | Exceptional 24.7% |
| Mexican American Indians | 92.2 /100 | #134 | Exceptional 24.7% |
| South American Indians | 92.0 /100 | #135 | Exceptional 24.7% |
| Armenians | 91.3 /100 | #136 | Exceptional 24.8% |
| Immigrants | South Eastern Asia | 90.9 /100 | #137 | Exceptional 24.8% |
| Immigrants | Bosnia and Herzegovina | 90.1 /100 | #138 | Exceptional 24.8% |
| Hispanics or Latinos | 89.5 /100 | #139 | Excellent 24.9% |
| Immigrants | Nepal | 89.3 /100 | #140 | Excellent 24.9% |
| Hawaiians | 89.3 /100 | #141 | Excellent 24.9% |
| Afghans | 88.1 /100 | #142 | Excellent 24.9% |