Immigrants from Eritrea vs Immigrants from Australia Wage/Income Gap
COMPARE
Immigrants from Eritrea
Immigrants from Australia
Wage/Income Gap
Wage/Income Gap Comparison
Immigrants from Eritrea
Immigrants from Australia
21.4%
WAGE/INCOME GAP
100.0/ 100
METRIC RATING
44th/ 347
METRIC RANK
28.2%
WAGE/INCOME GAP
0.3/ 100
METRIC RATING
292nd/ 347
METRIC RANK
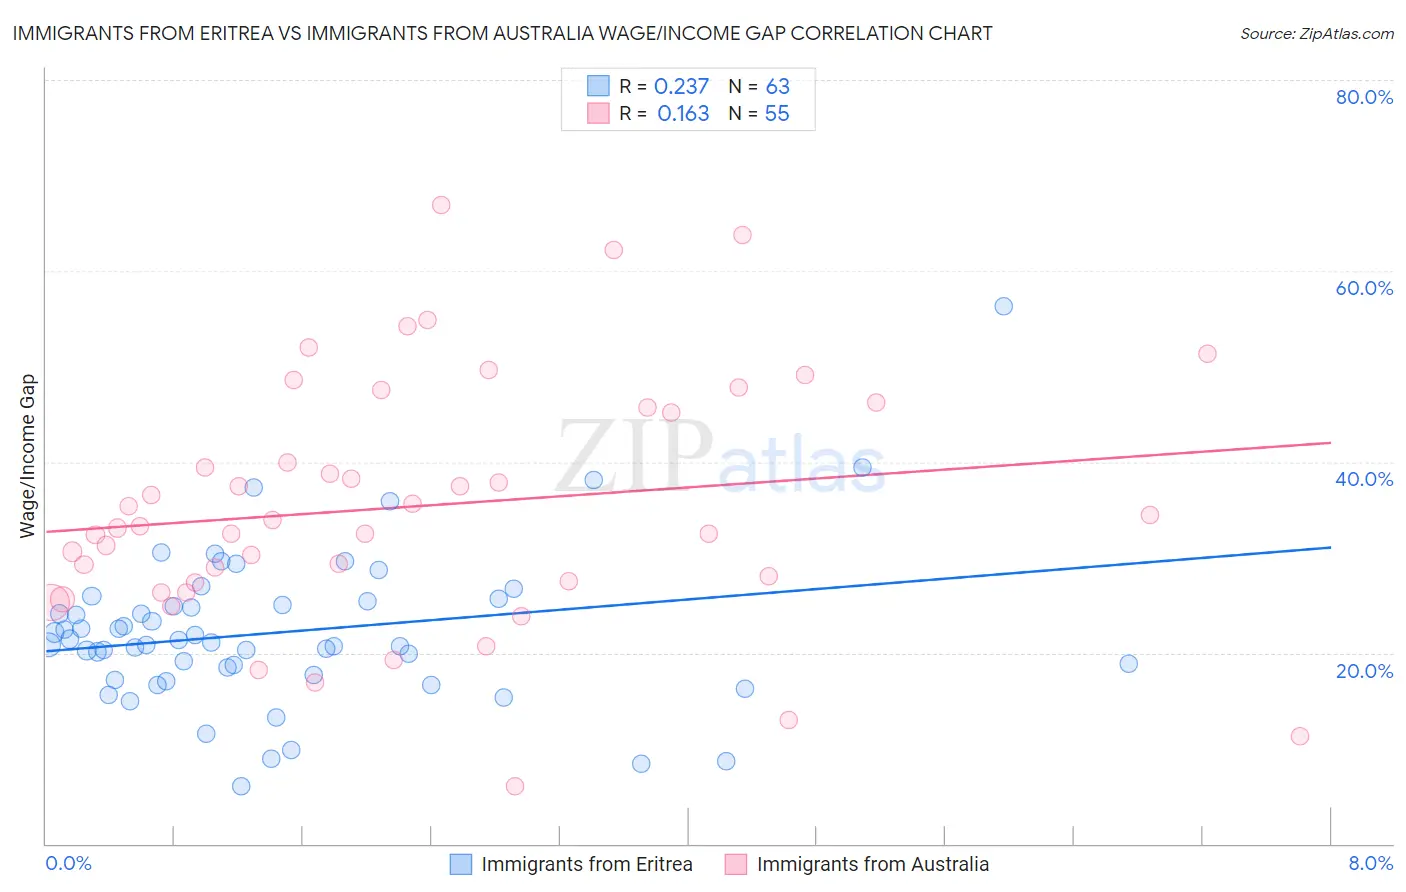
Immigrants from Eritrea vs Immigrants from Australia Wage/Income Gap Correlation Chart
The statistical analysis conducted on geographies consisting of 104,849,653 people shows a weak positive correlation between the proportion of Immigrants from Eritrea and wage/income gap percentage in the United States with a correlation coefficient (R) of 0.237 and weighted average of 21.4%. Similarly, the statistical analysis conducted on geographies consisting of 227,127,530 people shows a poor positive correlation between the proportion of Immigrants from Australia and wage/income gap percentage in the United States with a correlation coefficient (R) of 0.163 and weighted average of 28.2%, a difference of 31.5%.
Wage/Income Gap Correlation Summary
| Measurement | Immigrants from Eritrea | Immigrants from Australia |
| Minimum | 6.0% | 6.0% |
| Maximum | 56.4% | 66.9% |
| Range | 50.4% | 60.9% |
| Mean | 22.2% | 35.4% |
| Median | 21.1% | 33.2% |
| Interquartile 25% (IQ1) | 17.7% | 27.4% |
| Interquartile 75% (IQ3) | 25.3% | 45.7% |
| Interquartile Range (IQR) | 7.6% | 18.3% |
| Standard Deviation (Sample) | 8.2% | 13.0% |
| Standard Deviation (Population) | 8.1% | 12.9% |
Similar Demographics by Wage/Income Gap
Demographics Similar to Immigrants from Eritrea by Wage/Income Gap
In terms of wage/income gap, the demographic groups most similar to Immigrants from Eritrea are Sierra Leonean (21.4%, a difference of 0.020%), Liberian (21.4%, a difference of 0.080%), Immigrants from Sierra Leone (21.4%, a difference of 0.080%), U.S. Virgin Islander (21.5%, a difference of 0.44%), and Lumbee (21.3%, a difference of 0.56%).
| Demographics | Rating | Rank | Wage/Income Gap |
| Immigrants | Somalia | 100.0 /100 | #37 | Exceptional 21.2% |
| Immigrants | Belize | 100.0 /100 | #38 | Exceptional 21.3% |
| Colville | 100.0 /100 | #39 | Exceptional 21.3% |
| Lumbee | 100.0 /100 | #40 | Exceptional 21.3% |
| Liberians | 100.0 /100 | #41 | Exceptional 21.4% |
| Immigrants | Sierra Leone | 100.0 /100 | #42 | Exceptional 21.4% |
| Sierra Leoneans | 100.0 /100 | #43 | Exceptional 21.4% |
| Immigrants | Eritrea | 100.0 /100 | #44 | Exceptional 21.4% |
| U.S. Virgin Islanders | 100.0 /100 | #45 | Exceptional 21.5% |
| Immigrants | Ethiopia | 100.0 /100 | #46 | Exceptional 21.6% |
| Immigrants | Congo | 100.0 /100 | #47 | Exceptional 21.7% |
| Blacks/African Americans | 100.0 /100 | #48 | Exceptional 21.7% |
| Ethiopians | 100.0 /100 | #49 | Exceptional 21.8% |
| Immigrants | Western Africa | 100.0 /100 | #50 | Exceptional 22.0% |
| Tohono O'odham | 100.0 /100 | #51 | Exceptional 22.1% |
Demographics Similar to Immigrants from Australia by Wage/Income Gap
In terms of wage/income gap, the demographic groups most similar to Immigrants from Australia are Czechoslovakian (28.2%, a difference of 0.060%), Immigrants from Israel (28.2%, a difference of 0.11%), Australian (28.2%, a difference of 0.12%), Greek (28.2%, a difference of 0.13%), and Canadian (28.1%, a difference of 0.22%).
| Demographics | Rating | Rank | Wage/Income Gap |
| Italians | 0.4 /100 | #285 | Tragic 28.1% |
| Immigrants | Austria | 0.4 /100 | #286 | Tragic 28.1% |
| Okinawans | 0.4 /100 | #287 | Tragic 28.1% |
| Choctaw | 0.4 /100 | #288 | Tragic 28.1% |
| Canadians | 0.3 /100 | #289 | Tragic 28.1% |
| Australians | 0.3 /100 | #290 | Tragic 28.2% |
| Czechoslovakians | 0.3 /100 | #291 | Tragic 28.2% |
| Immigrants | Australia | 0.3 /100 | #292 | Tragic 28.2% |
| Immigrants | Israel | 0.3 /100 | #293 | Tragic 28.2% |
| Greeks | 0.3 /100 | #294 | Tragic 28.2% |
| Slovenes | 0.3 /100 | #295 | Tragic 28.3% |
| Northern Europeans | 0.3 /100 | #296 | Tragic 28.3% |
| Immigrants | North America | 0.2 /100 | #297 | Tragic 28.4% |
| Austrians | 0.2 /100 | #298 | Tragic 28.4% |
| Immigrants | North Macedonia | 0.2 /100 | #299 | Tragic 28.4% |