Pakistani vs Ottawa Householder Income Over 65 years
COMPARE
Pakistani
Ottawa
Householder Income Over 65 years
Householder Income Over 65 years Comparison
Pakistanis
Ottawa
$63,844
HOUSEHOLDER INCOME OVER 65 YEARS
95.3/ 100
METRIC RATING
107th/ 347
METRIC RANK
$53,217
HOUSEHOLDER INCOME OVER 65 YEARS
0.0/ 100
METRIC RATING
299th/ 347
METRIC RANK
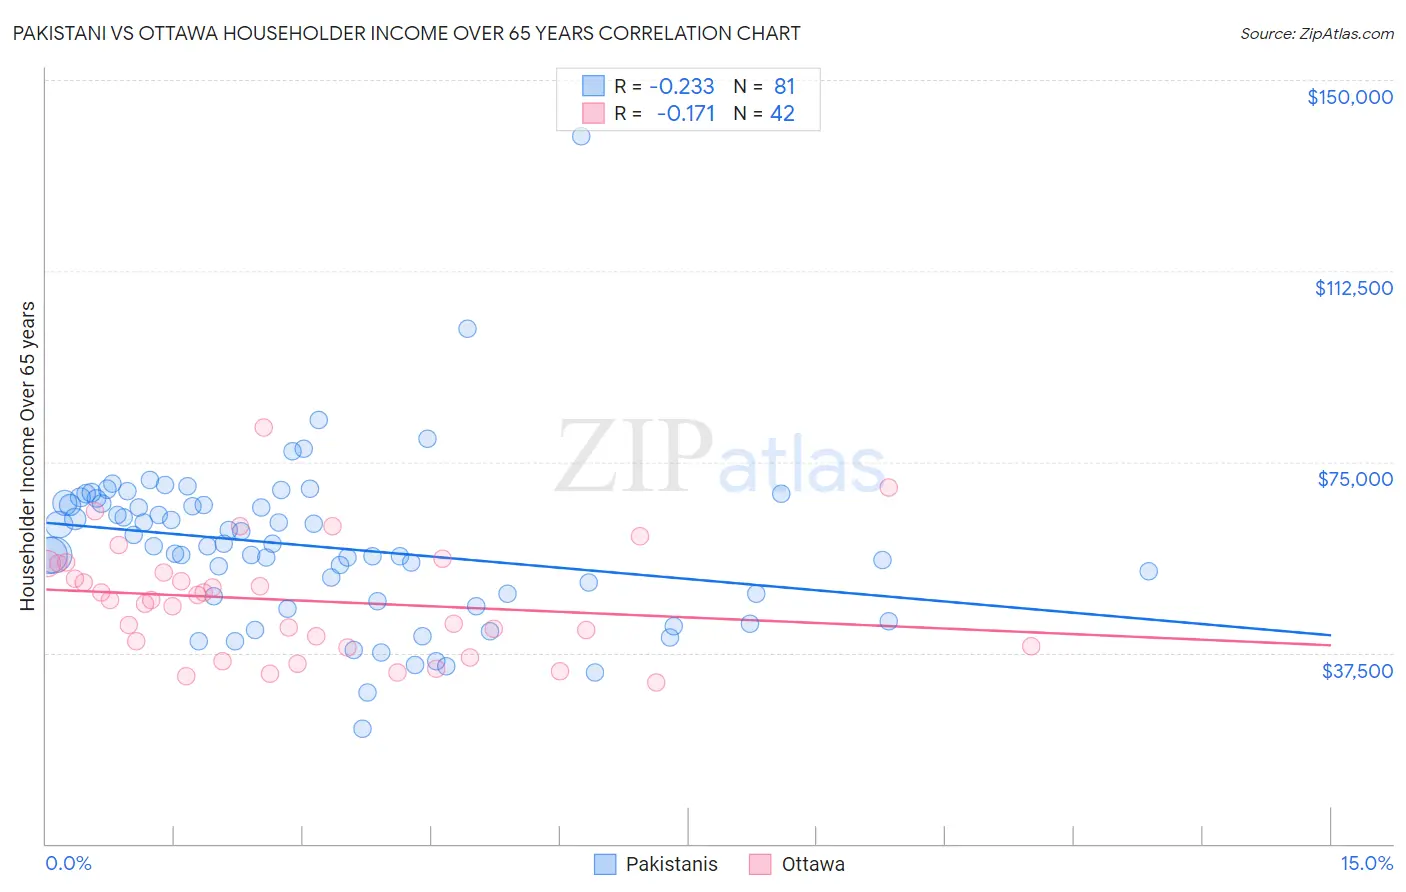
Pakistani vs Ottawa Householder Income Over 65 years Correlation Chart
The statistical analysis conducted on geographies consisting of 334,349,406 people shows a weak negative correlation between the proportion of Pakistanis and household income with householder over the age of 65 in the United States with a correlation coefficient (R) of -0.233 and weighted average of $63,844. Similarly, the statistical analysis conducted on geographies consisting of 49,912,496 people shows a poor negative correlation between the proportion of Ottawa and household income with householder over the age of 65 in the United States with a correlation coefficient (R) of -0.171 and weighted average of $53,217, a difference of 20.0%.
Householder Income Over 65 years Correlation Summary
| Measurement | Pakistani | Ottawa |
| Minimum | $22,611 | $31,583 |
| Maximum | $139,000 | $81,786 |
| Range | $116,389 | $50,203 |
| Mean | $58,427 | $47,771 |
| Median | $58,443 | $47,868 |
| Interquartile 25% (IQ1) | $48,104 | $38,750 |
| Interquartile 75% (IQ3) | $66,893 | $54,962 |
| Interquartile Range (IQR) | $18,789 | $16,212 |
| Standard Deviation (Sample) | $16,214 | $11,126 |
| Standard Deviation (Population) | $16,114 | $10,993 |
Similar Demographics by Householder Income Over 65 years
Demographics Similar to Pakistanis by Householder Income Over 65 years
In terms of householder income over 65 years, the demographic groups most similar to Pakistanis are Italian ($63,885, a difference of 0.060%), Immigrants from Argentina ($63,885, a difference of 0.060%), Palestinian ($63,800, a difference of 0.070%), Immigrants from Cameroon ($63,907, a difference of 0.10%), and European ($63,779, a difference of 0.10%).
| Demographics | Rating | Rank | Householder Income Over 65 years |
| Immigrants | South Eastern Asia | 96.3 /100 | #100 | Exceptional $64,089 |
| Immigrants | Italy | 96.2 /100 | #101 | Exceptional $64,065 |
| Chileans | 95.8 /100 | #102 | Exceptional $63,957 |
| British | 95.7 /100 | #103 | Exceptional $63,940 |
| Immigrants | Cameroon | 95.6 /100 | #104 | Exceptional $63,907 |
| Italians | 95.5 /100 | #105 | Exceptional $63,885 |
| Immigrants | Argentina | 95.5 /100 | #106 | Exceptional $63,885 |
| Pakistanis | 95.3 /100 | #107 | Exceptional $63,844 |
| Palestinians | 95.1 /100 | #108 | Exceptional $63,800 |
| Europeans | 95.0 /100 | #109 | Exceptional $63,779 |
| Immigrants | Zimbabwe | 94.3 /100 | #110 | Exceptional $63,643 |
| Immigrants | Spain | 93.7 /100 | #111 | Exceptional $63,540 |
| Syrians | 93.4 /100 | #112 | Exceptional $63,494 |
| Immigrants | Serbia | 92.7 /100 | #113 | Exceptional $63,387 |
| Immigrants | Saudi Arabia | 92.4 /100 | #114 | Exceptional $63,355 |
Demographics Similar to Ottawa by Householder Income Over 65 years
In terms of householder income over 65 years, the demographic groups most similar to Ottawa are Central American Indian ($53,232, a difference of 0.030%), Immigrants from Bahamas ($53,174, a difference of 0.080%), Immigrants from Latin America ($53,265, a difference of 0.090%), Yuman ($53,110, a difference of 0.20%), and Immigrants from Somalia ($53,333, a difference of 0.22%).
| Demographics | Rating | Rank | Householder Income Over 65 years |
| Shoshone | 0.0 /100 | #292 | Tragic $53,681 |
| Immigrants | Belize | 0.0 /100 | #293 | Tragic $53,665 |
| Senegalese | 0.0 /100 | #294 | Tragic $53,591 |
| Immigrants | Central America | 0.0 /100 | #295 | Tragic $53,420 |
| Immigrants | Somalia | 0.0 /100 | #296 | Tragic $53,333 |
| Immigrants | Latin America | 0.0 /100 | #297 | Tragic $53,265 |
| Central American Indians | 0.0 /100 | #298 | Tragic $53,232 |
| Ottawa | 0.0 /100 | #299 | Tragic $53,217 |
| Immigrants | Bahamas | 0.0 /100 | #300 | Tragic $53,174 |
| Yuman | 0.0 /100 | #301 | Tragic $53,110 |
| Spanish American Indians | 0.0 /100 | #302 | Tragic $53,077 |
| Choctaw | 0.0 /100 | #303 | Tragic $53,060 |
| Ute | 0.0 /100 | #304 | Tragic $52,949 |
| Pueblo | 0.0 /100 | #305 | Tragic $52,930 |
| Pennsylvania Germans | 0.0 /100 | #306 | Tragic $52,888 |