Black/African American vs Ottawa Child Poverty Among Boys Under 16
COMPARE
Black/African American
Ottawa
Child Poverty Among Boys Under 16
Child Poverty Among Boys Under 16 Comparison
Blacks/African Americans
Ottawa
24.5%
CHILD POVERTY AMONG BOYS UNDER 16
0.0/ 100
METRIC RATING
334th/ 347
METRIC RANK
19.5%
CHILD POVERTY AMONG BOYS UNDER 16
0.1/ 100
METRIC RATING
263rd/ 347
METRIC RANK
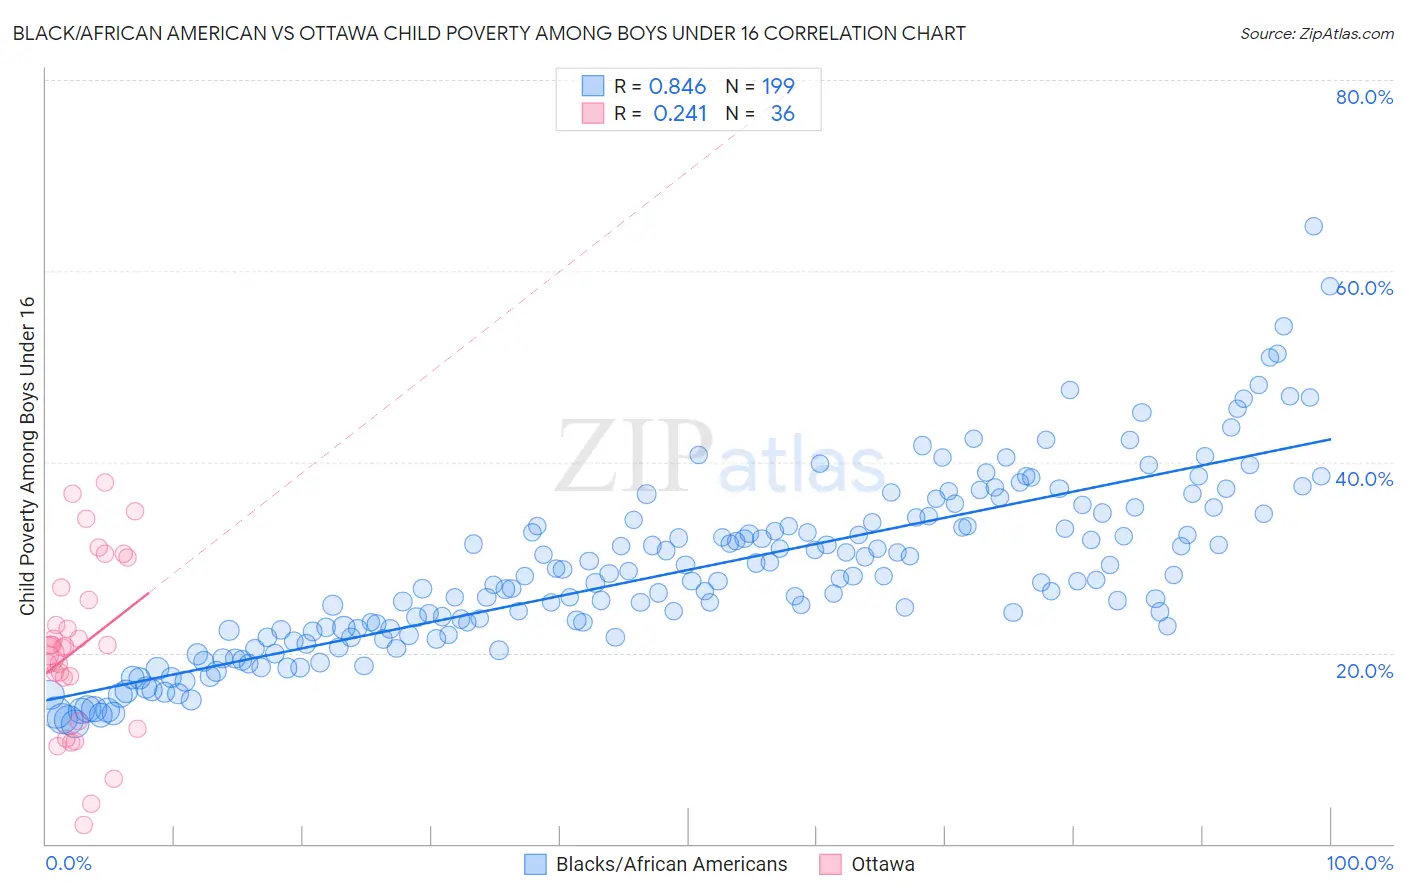
Black/African American vs Ottawa Child Poverty Among Boys Under 16 Correlation Chart
The statistical analysis conducted on geographies consisting of 548,051,875 people shows a very strong positive correlation between the proportion of Blacks/African Americans and poverty level among boys under the age of 16 in the United States with a correlation coefficient (R) of 0.846 and weighted average of 24.5%. Similarly, the statistical analysis conducted on geographies consisting of 49,695,002 people shows a weak positive correlation between the proportion of Ottawa and poverty level among boys under the age of 16 in the United States with a correlation coefficient (R) of 0.241 and weighted average of 19.5%, a difference of 25.6%.
Child Poverty Among Boys Under 16 Correlation Summary
| Measurement | Black/African American | Ottawa |
| Minimum | 12.5% | 1.9% |
| Maximum | 64.6% | 37.8% |
| Range | 52.1% | 35.9% |
| Mean | 28.6% | 20.5% |
| Median | 27.6% | 20.6% |
| Interquartile 25% (IQ1) | 21.9% | 15.1% |
| Interquartile 75% (IQ3) | 34.0% | 26.2% |
| Interquartile Range (IQR) | 12.1% | 11.1% |
| Standard Deviation (Sample) | 9.3% | 8.9% |
| Standard Deviation (Population) | 9.3% | 8.8% |
Similar Demographics by Child Poverty Among Boys Under 16
Demographics Similar to Blacks/African Americans by Child Poverty Among Boys Under 16
In terms of child poverty among boys under 16, the demographic groups most similar to Blacks/African Americans are Apache (24.5%, a difference of 0.12%), Immigrants from Dominican Republic (24.3%, a difference of 0.84%), Yup'ik (24.7%, a difference of 0.85%), Dominican (24.2%, a difference of 1.4%), and Colville (24.1%, a difference of 1.8%).
| Demographics | Rating | Rank | Child Poverty Among Boys Under 16 |
| Immigrants | Honduras | 0.0 /100 | #327 | Tragic 22.8% |
| Pueblo | 0.0 /100 | #328 | Tragic 23.5% |
| Natives/Alaskans | 0.0 /100 | #329 | Tragic 24.0% |
| Colville | 0.0 /100 | #330 | Tragic 24.1% |
| Dominicans | 0.0 /100 | #331 | Tragic 24.2% |
| Immigrants | Dominican Republic | 0.0 /100 | #332 | Tragic 24.3% |
| Apache | 0.0 /100 | #333 | Tragic 24.5% |
| Blacks/African Americans | 0.0 /100 | #334 | Tragic 24.5% |
| Yup'ik | 0.0 /100 | #335 | Tragic 24.7% |
| Sioux | 0.0 /100 | #336 | Tragic 25.3% |
| Cheyenne | 0.0 /100 | #337 | Tragic 25.8% |
| Hopi | 0.0 /100 | #338 | Tragic 25.9% |
| Houma | 0.0 /100 | #339 | Tragic 26.2% |
| Crow | 0.0 /100 | #340 | Tragic 26.3% |
| Immigrants | Yemen | 0.0 /100 | #341 | Tragic 28.9% |
Demographics Similar to Ottawa by Child Poverty Among Boys Under 16
In terms of child poverty among boys under 16, the demographic groups most similar to Ottawa are Iroquois (19.6%, a difference of 0.22%), Immigrants from Guyana (19.5%, a difference of 0.31%), Guyanese (19.6%, a difference of 0.32%), Immigrants from El Salvador (19.6%, a difference of 0.36%), and Vietnamese (19.6%, a difference of 0.37%).
| Demographics | Rating | Rank | Child Poverty Among Boys Under 16 |
| Immigrants | Liberia | 0.2 /100 | #256 | Tragic 19.3% |
| Mexican American Indians | 0.2 /100 | #257 | Tragic 19.4% |
| Potawatomi | 0.2 /100 | #258 | Tragic 19.4% |
| Spanish Americans | 0.2 /100 | #259 | Tragic 19.4% |
| Shoshone | 0.2 /100 | #260 | Tragic 19.4% |
| Immigrants | Ghana | 0.2 /100 | #261 | Tragic 19.4% |
| Immigrants | Guyana | 0.1 /100 | #262 | Tragic 19.5% |
| Ottawa | 0.1 /100 | #263 | Tragic 19.5% |
| Iroquois | 0.1 /100 | #264 | Tragic 19.6% |
| Guyanese | 0.1 /100 | #265 | Tragic 19.6% |
| Immigrants | El Salvador | 0.1 /100 | #266 | Tragic 19.6% |
| Vietnamese | 0.1 /100 | #267 | Tragic 19.6% |
| Spanish American Indians | 0.1 /100 | #268 | Tragic 19.6% |
| Immigrants | Cabo Verde | 0.1 /100 | #269 | Tragic 19.7% |
| Cherokee | 0.1 /100 | #270 | Tragic 19.7% |