Mexican vs Ottawa Householder Income Over 65 years
COMPARE
Mexican
Ottawa
Householder Income Over 65 years
Householder Income Over 65 years Comparison
Mexicans
Ottawa
$53,897
HOUSEHOLDER INCOME OVER 65 YEARS
0.1/ 100
METRIC RATING
285th/ 347
METRIC RANK
$53,217
HOUSEHOLDER INCOME OVER 65 YEARS
0.0/ 100
METRIC RATING
299th/ 347
METRIC RANK
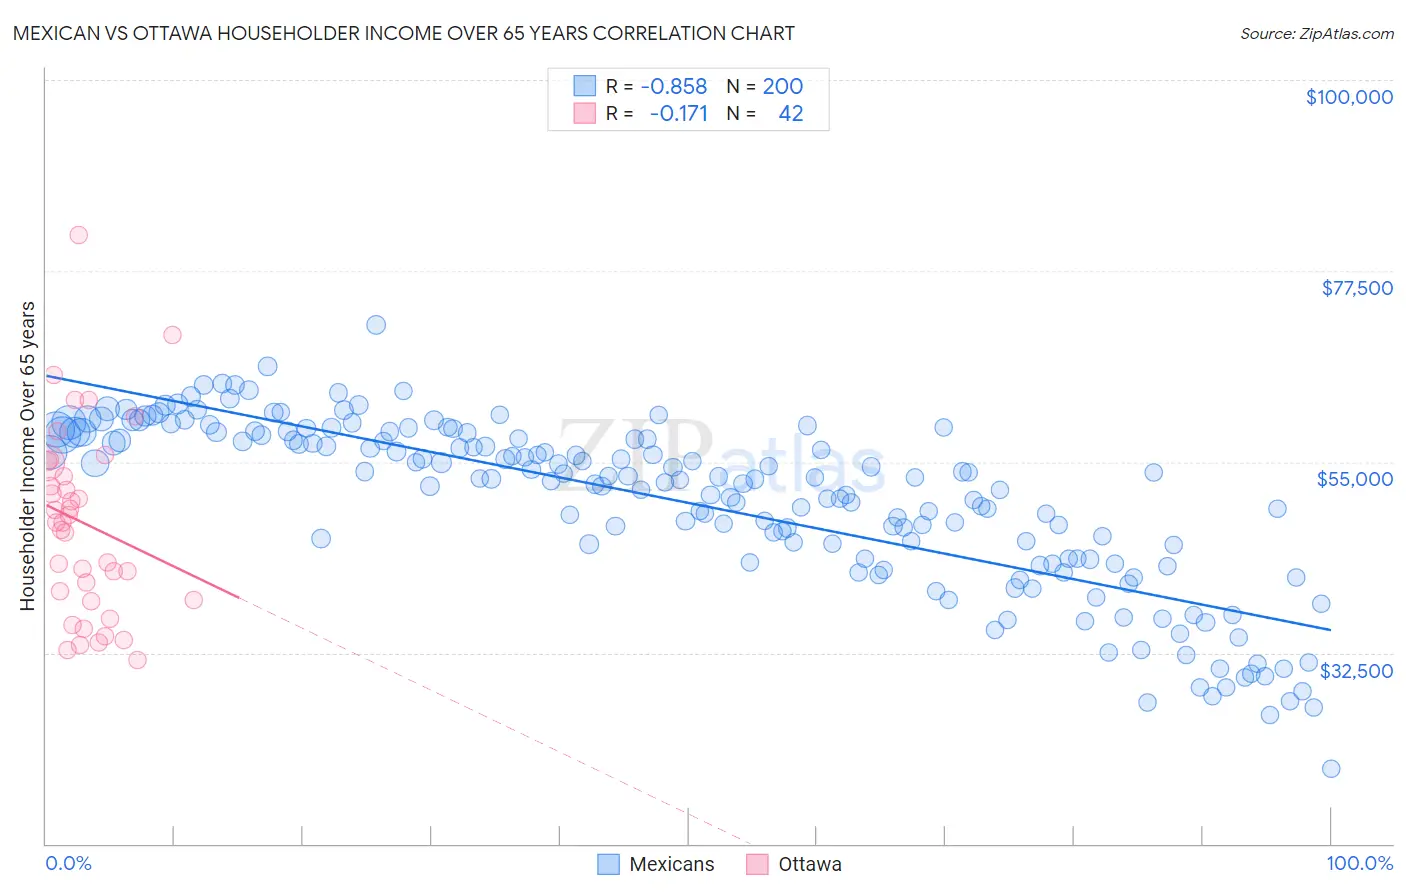
Mexican vs Ottawa Householder Income Over 65 years Correlation Chart
The statistical analysis conducted on geographies consisting of 559,960,320 people shows a very strong negative correlation between the proportion of Mexicans and household income with householder over the age of 65 in the United States with a correlation coefficient (R) of -0.858 and weighted average of $53,897. Similarly, the statistical analysis conducted on geographies consisting of 49,912,496 people shows a poor negative correlation between the proportion of Ottawa and household income with householder over the age of 65 in the United States with a correlation coefficient (R) of -0.171 and weighted average of $53,217, a difference of 1.3%.
Householder Income Over 65 years Correlation Summary
| Measurement | Mexican | Ottawa |
| Minimum | $18,818 | $31,583 |
| Maximum | $71,178 | $81,786 |
| Range | $52,360 | $50,203 |
| Mean | $50,150 | $47,771 |
| Median | $52,997 | $47,868 |
| Interquartile 25% (IQ1) | $43,543 | $38,750 |
| Interquartile 75% (IQ3) | $58,155 | $54,962 |
| Interquartile Range (IQR) | $14,612 | $16,212 |
| Standard Deviation (Sample) | $10,117 | $11,126 |
| Standard Deviation (Population) | $10,091 | $10,993 |
Demographics Similar to Mexicans and Ottawa by Householder Income Over 65 years
In terms of householder income over 65 years, the demographic groups most similar to Mexicans are Chippewa ($53,847, a difference of 0.090%), Immigrants from Guatemala ($53,950, a difference of 0.10%), Immigrants from Liberia ($53,967, a difference of 0.13%), Immigrants from Armenia ($53,974, a difference of 0.14%), and Immigrants from Barbados ($53,766, a difference of 0.24%). Similarly, the demographic groups most similar to Ottawa are Central American Indian ($53,232, a difference of 0.030%), Immigrants from Bahamas ($53,174, a difference of 0.080%), Immigrants from Latin America ($53,265, a difference of 0.090%), Yuman ($53,110, a difference of 0.20%), and Immigrants from Somalia ($53,333, a difference of 0.22%).
| Demographics | Rating | Rank | Householder Income Over 65 years |
| Immigrants | Armenia | 0.1 /100 | #282 | Tragic $53,974 |
| Immigrants | Liberia | 0.1 /100 | #283 | Tragic $53,967 |
| Immigrants | Guatemala | 0.1 /100 | #284 | Tragic $53,950 |
| Mexicans | 0.1 /100 | #285 | Tragic $53,897 |
| Chippewa | 0.1 /100 | #286 | Tragic $53,847 |
| Immigrants | Barbados | 0.1 /100 | #287 | Tragic $53,766 |
| Paiute | 0.1 /100 | #288 | Tragic $53,762 |
| Iroquois | 0.1 /100 | #289 | Tragic $53,737 |
| Chickasaw | 0.1 /100 | #290 | Tragic $53,732 |
| Africans | 0.0 /100 | #291 | Tragic $53,711 |
| Shoshone | 0.0 /100 | #292 | Tragic $53,681 |
| Immigrants | Belize | 0.0 /100 | #293 | Tragic $53,665 |
| Senegalese | 0.0 /100 | #294 | Tragic $53,591 |
| Immigrants | Central America | 0.0 /100 | #295 | Tragic $53,420 |
| Immigrants | Somalia | 0.0 /100 | #296 | Tragic $53,333 |
| Immigrants | Latin America | 0.0 /100 | #297 | Tragic $53,265 |
| Central American Indians | 0.0 /100 | #298 | Tragic $53,232 |
| Ottawa | 0.0 /100 | #299 | Tragic $53,217 |
| Immigrants | Bahamas | 0.0 /100 | #300 | Tragic $53,174 |
| Yuman | 0.0 /100 | #301 | Tragic $53,110 |
| Spanish American Indians | 0.0 /100 | #302 | Tragic $53,077 |