Black/African American vs Ottawa Unemployment Among Seniors over 75 years
COMPARE
Black/African American
Ottawa
Unemployment Among Seniors over 75 years
Unemployment Among Seniors over 75 years Comparison
Blacks/African Americans
Ottawa
9.4%
UNEMPLOYMENT AMONG SENIORS OVER 75 YEARS
0.5/ 100
METRIC RATING
266th/ 347
METRIC RANK
7.9%
UNEMPLOYMENT AMONG SENIORS OVER 75 YEARS
99.9/ 100
METRIC RATING
57th/ 347
METRIC RANK
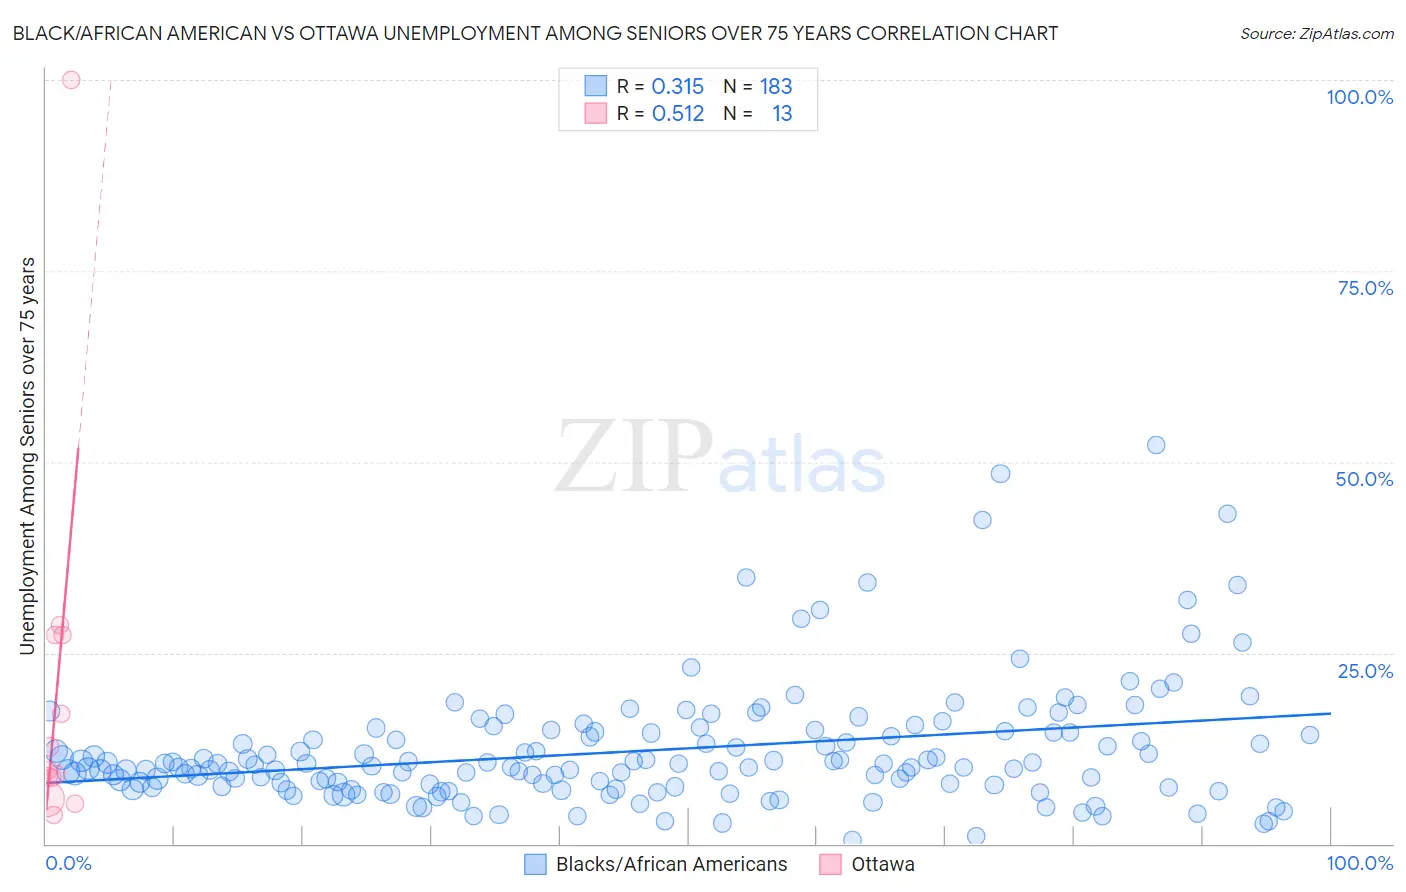
Black/African American vs Ottawa Unemployment Among Seniors over 75 years Correlation Chart
The statistical analysis conducted on geographies consisting of 234,580,439 people shows a mild positive correlation between the proportion of Blacks/African Americans and unemployment rate among seniors over the age of 75 in the United States with a correlation coefficient (R) of 0.315 and weighted average of 9.4%. Similarly, the statistical analysis conducted on geographies consisting of 36,097,023 people shows a substantial positive correlation between the proportion of Ottawa and unemployment rate among seniors over the age of 75 in the United States with a correlation coefficient (R) of 0.512 and weighted average of 7.9%, a difference of 18.7%.
Unemployment Among Seniors over 75 years Correlation Summary
| Measurement | Black/African American | Ottawa |
| Minimum | 0.50% | 3.8% |
| Maximum | 52.2% | 100.0% |
| Range | 51.7% | 96.2% |
| Mean | 12.2% | 20.3% |
| Median | 10.2% | 9.6% |
| Interquartile 25% (IQ1) | 7.6% | 7.3% |
| Interquartile 75% (IQ3) | 14.6% | 27.3% |
| Interquartile Range (IQR) | 7.0% | 20.0% |
| Standard Deviation (Sample) | 8.0% | 25.5% |
| Standard Deviation (Population) | 8.0% | 24.5% |
Similar Demographics by Unemployment Among Seniors over 75 years
Demographics Similar to Blacks/African Americans by Unemployment Among Seniors over 75 years
In terms of unemployment among seniors over 75 years, the demographic groups most similar to Blacks/African Americans are Immigrants from Mexico (9.4%, a difference of 0.12%), Greek (9.4%, a difference of 0.28%), Palestinian (9.3%, a difference of 0.32%), Puerto Rican (9.4%, a difference of 0.42%), and Iroquois (9.3%, a difference of 0.45%).
| Demographics | Rating | Rank | Unemployment Among Seniors over 75 years |
| Slovenes | 1.0 /100 | #259 | Tragic 9.3% |
| Immigrants | Cameroon | 1.0 /100 | #260 | Tragic 9.3% |
| Celtics | 0.8 /100 | #261 | Tragic 9.3% |
| Austrians | 0.7 /100 | #262 | Tragic 9.3% |
| Ukrainians | 0.7 /100 | #263 | Tragic 9.3% |
| Iroquois | 0.7 /100 | #264 | Tragic 9.3% |
| Palestinians | 0.6 /100 | #265 | Tragic 9.3% |
| Blacks/African Americans | 0.5 /100 | #266 | Tragic 9.4% |
| Immigrants | Mexico | 0.4 /100 | #267 | Tragic 9.4% |
| Greeks | 0.4 /100 | #268 | Tragic 9.4% |
| Puerto Ricans | 0.3 /100 | #269 | Tragic 9.4% |
| Yaqui | 0.3 /100 | #270 | Tragic 9.4% |
| Bulgarians | 0.3 /100 | #271 | Tragic 9.4% |
| Immigrants | Iraq | 0.3 /100 | #272 | Tragic 9.4% |
| Czechoslovakians | 0.3 /100 | #273 | Tragic 9.4% |
Demographics Similar to Ottawa by Unemployment Among Seniors over 75 years
In terms of unemployment among seniors over 75 years, the demographic groups most similar to Ottawa are Iranian (7.9%, a difference of 0.050%), Immigrants from Eastern Asia (7.9%, a difference of 0.17%), Filipino (7.9%, a difference of 0.18%), Indonesian (7.9%, a difference of 0.24%), and Immigrants from Morocco (7.9%, a difference of 0.29%).
| Demographics | Rating | Rank | Unemployment Among Seniors over 75 years |
| Immigrants | Latvia | 100.0 /100 | #50 | Exceptional 7.8% |
| Moroccans | 100.0 /100 | #51 | Exceptional 7.8% |
| Bahamians | 100.0 /100 | #52 | Exceptional 7.8% |
| Immigrants | Egypt | 100.0 /100 | #53 | Exceptional 7.9% |
| Immigrants | Malaysia | 99.9 /100 | #54 | Exceptional 7.9% |
| Filipinos | 99.9 /100 | #55 | Exceptional 7.9% |
| Immigrants | Eastern Asia | 99.9 /100 | #56 | Exceptional 7.9% |
| Ottawa | 99.9 /100 | #57 | Exceptional 7.9% |
| Iranians | 99.9 /100 | #58 | Exceptional 7.9% |
| Indonesians | 99.9 /100 | #59 | Exceptional 7.9% |
| Immigrants | Morocco | 99.9 /100 | #60 | Exceptional 7.9% |
| Uruguayans | 99.9 /100 | #61 | Exceptional 7.9% |
| Immigrants | Albania | 99.9 /100 | #62 | Exceptional 7.9% |
| Immigrants | Nicaragua | 99.9 /100 | #63 | Exceptional 7.9% |
| Immigrants | Taiwan | 99.9 /100 | #64 | Exceptional 7.9% |