Italian vs Chilean Householder Income Over 65 years
COMPARE
Italian
Chilean
Householder Income Over 65 years
Householder Income Over 65 years Comparison
Italians
Chileans
$63,885
HOUSEHOLDER INCOME OVER 65 YEARS
95.5/ 100
METRIC RATING
105th/ 347
METRIC RANK
$63,957
HOUSEHOLDER INCOME OVER 65 YEARS
95.8/ 100
METRIC RATING
102nd/ 347
METRIC RANK
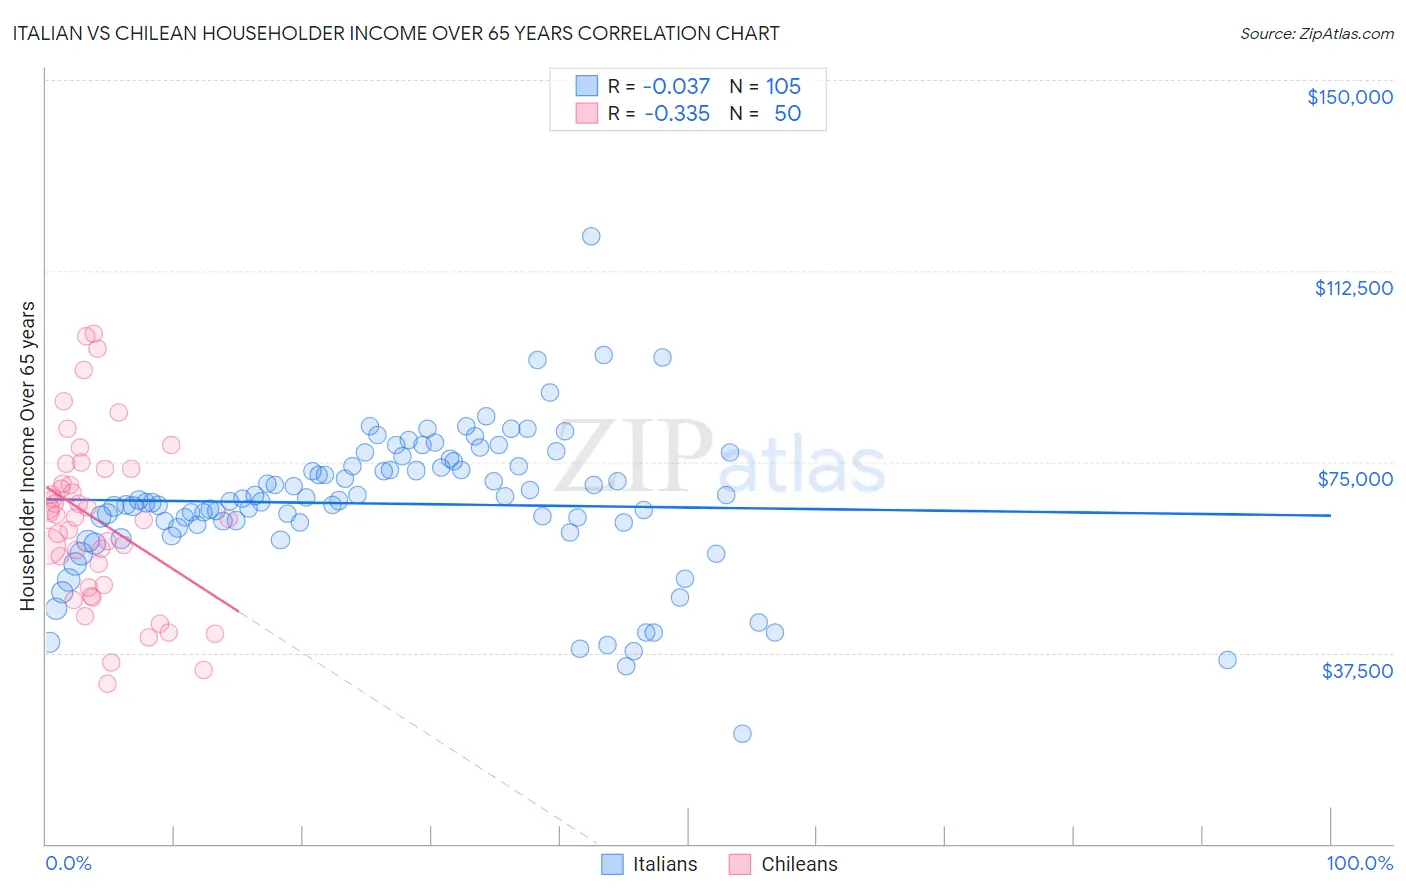
Italian vs Chilean Householder Income Over 65 years Correlation Chart
The statistical analysis conducted on geographies consisting of 569,380,775 people shows no correlation between the proportion of Italians and household income with householder over the age of 65 in the United States with a correlation coefficient (R) of -0.037 and weighted average of $63,885. Similarly, the statistical analysis conducted on geographies consisting of 256,269,150 people shows a mild negative correlation between the proportion of Chileans and household income with householder over the age of 65 in the United States with a correlation coefficient (R) of -0.335 and weighted average of $63,957, a difference of 0.11%.
Householder Income Over 65 years Correlation Summary
| Measurement | Italian | Chilean |
| Minimum | $21,635 | $31,406 |
| Maximum | $119,405 | $100,074 |
| Range | $97,770 | $68,668 |
| Mean | $66,782 | $63,656 |
| Median | $67,205 | $64,293 |
| Interquartile 25% (IQ1) | $62,321 | $50,804 |
| Interquartile 75% (IQ3) | $74,713 | $73,549 |
| Interquartile Range (IQR) | $12,392 | $22,745 |
| Standard Deviation (Sample) | $14,390 | $16,501 |
| Standard Deviation (Population) | $14,321 | $16,335 |
Demographics Similar to Italians and Chileans by Householder Income Over 65 years
In terms of householder income over 65 years, the demographic groups most similar to Italians are Immigrants from Argentina ($63,885, a difference of 0.0%), Immigrants from Cameroon ($63,907, a difference of 0.030%), Pakistani ($63,844, a difference of 0.060%), British ($63,940, a difference of 0.080%), and Palestinian ($63,800, a difference of 0.13%). Similarly, the demographic groups most similar to Chileans are British ($63,940, a difference of 0.030%), Immigrants from Cameroon ($63,907, a difference of 0.080%), Immigrants from Argentina ($63,885, a difference of 0.11%), Immigrants from Italy ($64,065, a difference of 0.17%), and Pakistani ($63,844, a difference of 0.18%).
| Demographics | Rating | Rank | Householder Income Over 65 years |
| Jordanians | 97.1 /100 | #93 | Exceptional $64,313 |
| Immigrants | Egypt | 97.0 /100 | #94 | Exceptional $64,299 |
| Immigrants | Latvia | 97.0 /100 | #95 | Exceptional $64,298 |
| Immigrants | Hungary | 97.0 /100 | #96 | Exceptional $64,277 |
| Sri Lankans | 96.7 /100 | #97 | Exceptional $64,201 |
| Romanians | 96.5 /100 | #98 | Exceptional $64,142 |
| Assyrians/Chaldeans/Syriacs | 96.4 /100 | #99 | Exceptional $64,108 |
| Immigrants | South Eastern Asia | 96.3 /100 | #100 | Exceptional $64,089 |
| Immigrants | Italy | 96.2 /100 | #101 | Exceptional $64,065 |
| Chileans | 95.8 /100 | #102 | Exceptional $63,957 |
| British | 95.7 /100 | #103 | Exceptional $63,940 |
| Immigrants | Cameroon | 95.6 /100 | #104 | Exceptional $63,907 |
| Italians | 95.5 /100 | #105 | Exceptional $63,885 |
| Immigrants | Argentina | 95.5 /100 | #106 | Exceptional $63,885 |
| Pakistanis | 95.3 /100 | #107 | Exceptional $63,844 |
| Palestinians | 95.1 /100 | #108 | Exceptional $63,800 |
| Europeans | 95.0 /100 | #109 | Exceptional $63,779 |
| Immigrants | Zimbabwe | 94.3 /100 | #110 | Exceptional $63,643 |
| Immigrants | Spain | 93.7 /100 | #111 | Exceptional $63,540 |
| Syrians | 93.4 /100 | #112 | Exceptional $63,494 |
| Immigrants | Serbia | 92.7 /100 | #113 | Exceptional $63,387 |