Immigrants from Lebanon vs Chilean Householder Income Over 65 years
COMPARE
Immigrants from Lebanon
Chilean
Householder Income Over 65 years
Householder Income Over 65 years Comparison
Immigrants from Lebanon
Chileans
$64,521
HOUSEHOLDER INCOME OVER 65 YEARS
97.6/ 100
METRIC RATING
85th/ 347
METRIC RANK
$63,957
HOUSEHOLDER INCOME OVER 65 YEARS
95.8/ 100
METRIC RATING
102nd/ 347
METRIC RANK
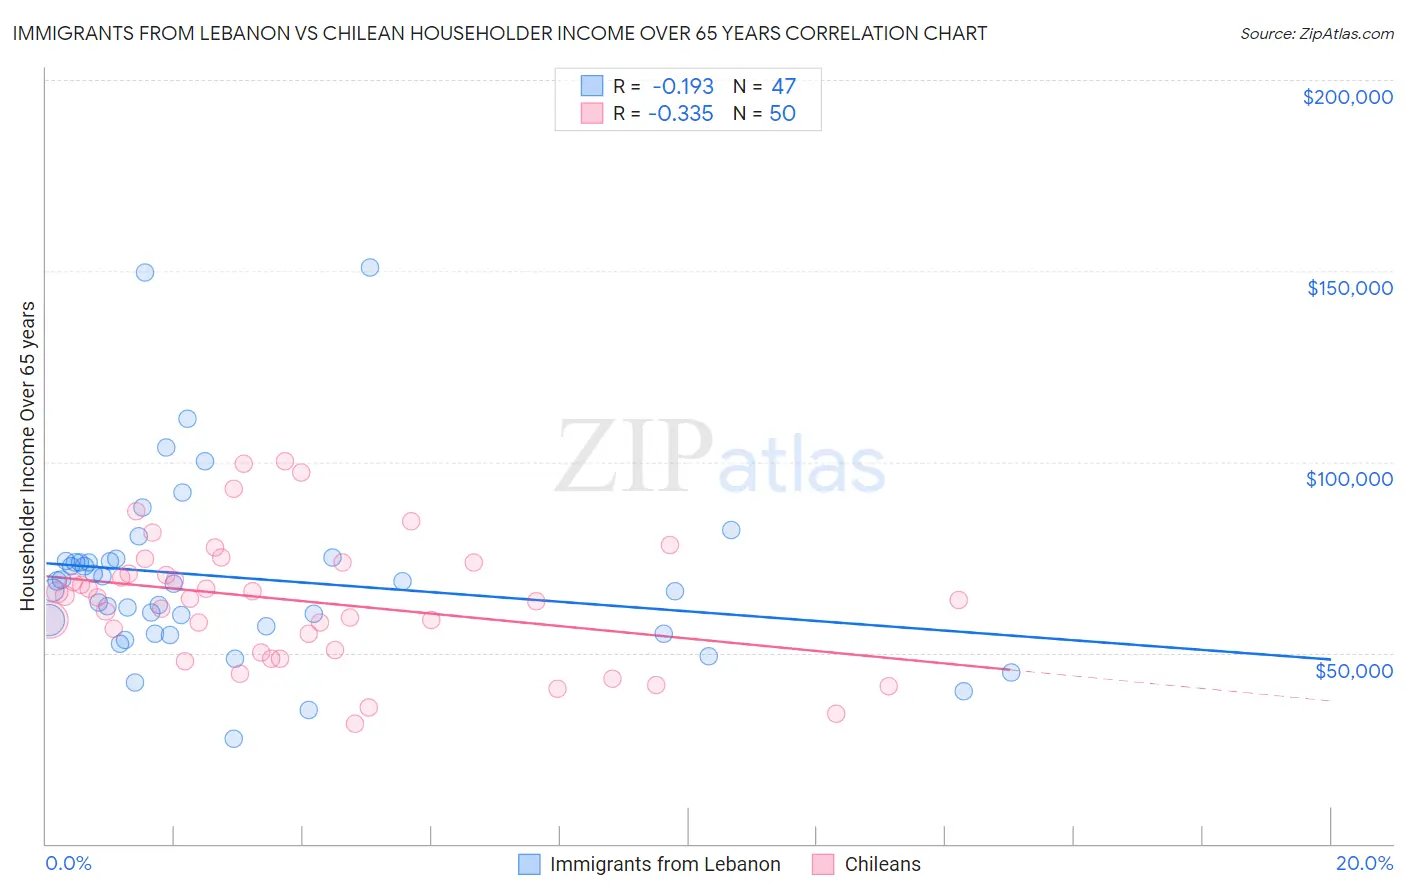
Immigrants from Lebanon vs Chilean Householder Income Over 65 years Correlation Chart
The statistical analysis conducted on geographies consisting of 216,930,382 people shows a poor negative correlation between the proportion of Immigrants from Lebanon and household income with householder over the age of 65 in the United States with a correlation coefficient (R) of -0.193 and weighted average of $64,521. Similarly, the statistical analysis conducted on geographies consisting of 256,269,150 people shows a mild negative correlation between the proportion of Chileans and household income with householder over the age of 65 in the United States with a correlation coefficient (R) of -0.335 and weighted average of $63,957, a difference of 0.88%.
Householder Income Over 65 years Correlation Summary
| Measurement | Immigrants from Lebanon | Chilean |
| Minimum | $27,500 | $31,406 |
| Maximum | $150,974 | $100,074 |
| Range | $123,474 | $68,668 |
| Mean | $69,669 | $63,656 |
| Median | $68,139 | $64,293 |
| Interquartile 25% (IQ1) | $55,101 | $50,804 |
| Interquartile 75% (IQ3) | $74,095 | $73,549 |
| Interquartile Range (IQR) | $18,994 | $22,745 |
| Standard Deviation (Sample) | $23,870 | $16,501 |
| Standard Deviation (Population) | $23,615 | $16,335 |
Demographics Similar to Immigrants from Lebanon and Chileans by Householder Income Over 65 years
In terms of householder income over 65 years, the demographic groups most similar to Immigrants from Lebanon are Immigrants from Russia ($64,512, a difference of 0.010%), Austrian ($64,470, a difference of 0.080%), Immigrants from Romania ($64,462, a difference of 0.090%), Paraguayan ($64,443, a difference of 0.12%), and Immigrants from Kuwait ($64,433, a difference of 0.14%). Similarly, the demographic groups most similar to Chileans are British ($63,940, a difference of 0.030%), Immigrants from Italy ($64,065, a difference of 0.17%), Immigrants from South Eastern Asia ($64,089, a difference of 0.21%), Assyrian/Chaldean/Syriac ($64,108, a difference of 0.24%), and Romanian ($64,142, a difference of 0.29%).
| Demographics | Rating | Rank | Householder Income Over 65 years |
| Northern Europeans | 97.9 /100 | #83 | Exceptional $64,658 |
| Immigrants | Greece | 97.9 /100 | #84 | Exceptional $64,636 |
| Immigrants | Lebanon | 97.6 /100 | #85 | Exceptional $64,521 |
| Immigrants | Russia | 97.6 /100 | #86 | Exceptional $64,512 |
| Austrians | 97.5 /100 | #87 | Exceptional $64,470 |
| Immigrants | Romania | 97.5 /100 | #88 | Exceptional $64,462 |
| Paraguayans | 97.4 /100 | #89 | Exceptional $64,443 |
| Immigrants | Kuwait | 97.4 /100 | #90 | Exceptional $64,433 |
| Immigrants | Oceania | 97.4 /100 | #91 | Exceptional $64,416 |
| Immigrants | Bulgaria | 97.3 /100 | #92 | Exceptional $64,379 |
| Jordanians | 97.1 /100 | #93 | Exceptional $64,313 |
| Immigrants | Egypt | 97.0 /100 | #94 | Exceptional $64,299 |
| Immigrants | Latvia | 97.0 /100 | #95 | Exceptional $64,298 |
| Immigrants | Hungary | 97.0 /100 | #96 | Exceptional $64,277 |
| Sri Lankans | 96.7 /100 | #97 | Exceptional $64,201 |
| Romanians | 96.5 /100 | #98 | Exceptional $64,142 |
| Assyrians/Chaldeans/Syriacs | 96.4 /100 | #99 | Exceptional $64,108 |
| Immigrants | South Eastern Asia | 96.3 /100 | #100 | Exceptional $64,089 |
| Immigrants | Italy | 96.2 /100 | #101 | Exceptional $64,065 |
| Chileans | 95.8 /100 | #102 | Exceptional $63,957 |
| British | 95.7 /100 | #103 | Exceptional $63,940 |