Native/Alaskan vs Chilean Householder Income Over 65 years
COMPARE
Native/Alaskan
Chilean
Householder Income Over 65 years
Householder Income Over 65 years Comparison
Natives/Alaskans
Chileans
$52,081
HOUSEHOLDER INCOME OVER 65 YEARS
0.0/ 100
METRIC RATING
314th/ 347
METRIC RANK
$63,957
HOUSEHOLDER INCOME OVER 65 YEARS
95.8/ 100
METRIC RATING
102nd/ 347
METRIC RANK
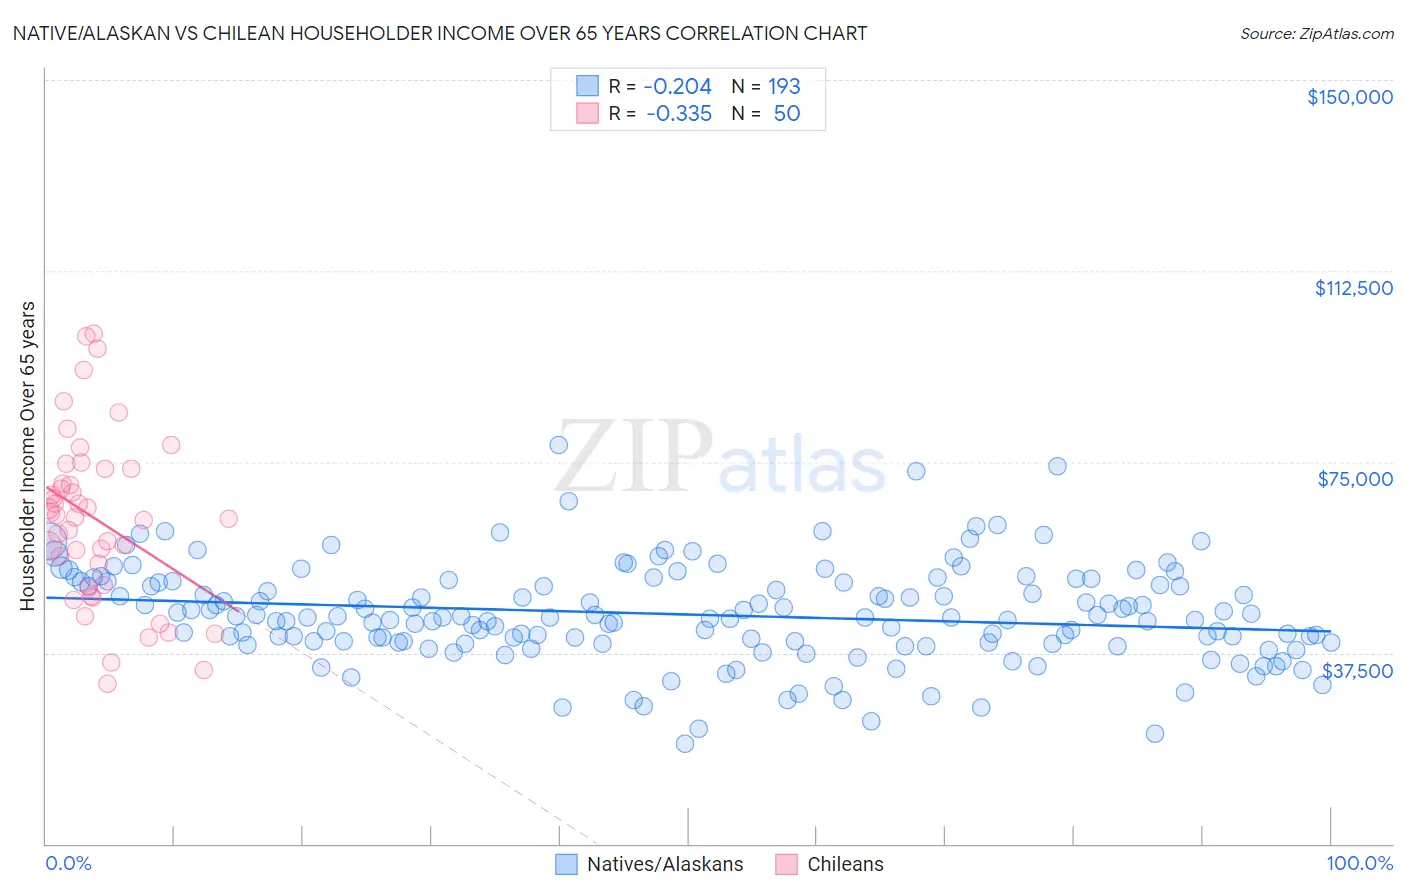
Native/Alaskan vs Chilean Householder Income Over 65 years Correlation Chart
The statistical analysis conducted on geographies consisting of 509,572,105 people shows a weak negative correlation between the proportion of Natives/Alaskans and household income with householder over the age of 65 in the United States with a correlation coefficient (R) of -0.204 and weighted average of $52,081. Similarly, the statistical analysis conducted on geographies consisting of 256,269,150 people shows a mild negative correlation between the proportion of Chileans and household income with householder over the age of 65 in the United States with a correlation coefficient (R) of -0.335 and weighted average of $63,957, a difference of 22.8%.
Householder Income Over 65 years Correlation Summary
| Measurement | Native/Alaskan | Chilean |
| Minimum | $19,554 | $31,406 |
| Maximum | $78,193 | $100,074 |
| Range | $58,639 | $68,668 |
| Mean | $45,041 | $63,656 |
| Median | $44,466 | $64,293 |
| Interquartile 25% (IQ1) | $39,545 | $50,804 |
| Interquartile 75% (IQ3) | $51,398 | $73,549 |
| Interquartile Range (IQR) | $11,852 | $22,745 |
| Standard Deviation (Sample) | $9,551 | $16,501 |
| Standard Deviation (Population) | $9,526 | $16,335 |
Similar Demographics by Householder Income Over 65 years
Demographics Similar to Natives/Alaskans by Householder Income Over 65 years
In terms of householder income over 65 years, the demographic groups most similar to Natives/Alaskans are Immigrants from Nicaragua ($52,085, a difference of 0.010%), U.S. Virgin Islander ($52,072, a difference of 0.020%), Immigrants from the Azores ($52,121, a difference of 0.080%), Creek ($51,949, a difference of 0.25%), and Immigrants from St. Vincent and the Grenadines ($51,922, a difference of 0.30%).
| Demographics | Rating | Rank | Householder Income Over 65 years |
| Hispanics or Latinos | 0.0 /100 | #307 | Tragic $52,832 |
| Immigrants | Mexico | 0.0 /100 | #308 | Tragic $52,801 |
| Hondurans | 0.0 /100 | #309 | Tragic $52,634 |
| Sioux | 0.0 /100 | #310 | Tragic $52,509 |
| Seminole | 0.0 /100 | #311 | Tragic $52,373 |
| Immigrants | Azores | 0.0 /100 | #312 | Tragic $52,121 |
| Immigrants | Nicaragua | 0.0 /100 | #313 | Tragic $52,085 |
| Natives/Alaskans | 0.0 /100 | #314 | Tragic $52,081 |
| U.S. Virgin Islanders | 0.0 /100 | #315 | Tragic $52,072 |
| Creek | 0.0 /100 | #316 | Tragic $51,949 |
| Immigrants | St. Vincent and the Grenadines | 0.0 /100 | #317 | Tragic $51,922 |
| Haitians | 0.0 /100 | #318 | Tragic $51,912 |
| Immigrants | Honduras | 0.0 /100 | #319 | Tragic $51,888 |
| Colville | 0.0 /100 | #320 | Tragic $51,739 |
| Menominee | 0.0 /100 | #321 | Tragic $51,719 |
Demographics Similar to Chileans by Householder Income Over 65 years
In terms of householder income over 65 years, the demographic groups most similar to Chileans are British ($63,940, a difference of 0.030%), Immigrants from Cameroon ($63,907, a difference of 0.080%), Italian ($63,885, a difference of 0.11%), Immigrants from Argentina ($63,885, a difference of 0.11%), and Immigrants from Italy ($64,065, a difference of 0.17%).
| Demographics | Rating | Rank | Householder Income Over 65 years |
| Immigrants | Latvia | 97.0 /100 | #95 | Exceptional $64,298 |
| Immigrants | Hungary | 97.0 /100 | #96 | Exceptional $64,277 |
| Sri Lankans | 96.7 /100 | #97 | Exceptional $64,201 |
| Romanians | 96.5 /100 | #98 | Exceptional $64,142 |
| Assyrians/Chaldeans/Syriacs | 96.4 /100 | #99 | Exceptional $64,108 |
| Immigrants | South Eastern Asia | 96.3 /100 | #100 | Exceptional $64,089 |
| Immigrants | Italy | 96.2 /100 | #101 | Exceptional $64,065 |
| Chileans | 95.8 /100 | #102 | Exceptional $63,957 |
| British | 95.7 /100 | #103 | Exceptional $63,940 |
| Immigrants | Cameroon | 95.6 /100 | #104 | Exceptional $63,907 |
| Italians | 95.5 /100 | #105 | Exceptional $63,885 |
| Immigrants | Argentina | 95.5 /100 | #106 | Exceptional $63,885 |
| Pakistanis | 95.3 /100 | #107 | Exceptional $63,844 |
| Palestinians | 95.1 /100 | #108 | Exceptional $63,800 |
| Europeans | 95.0 /100 | #109 | Exceptional $63,779 |